 RSS Feed
 by Calculated Risk on 8/18/2010 07:17:00 AM
Showing posts with label mortgage rates. Show all posts
Showing posts with label mortgage rates. Show all posts
Wednesday, August 18, 2010
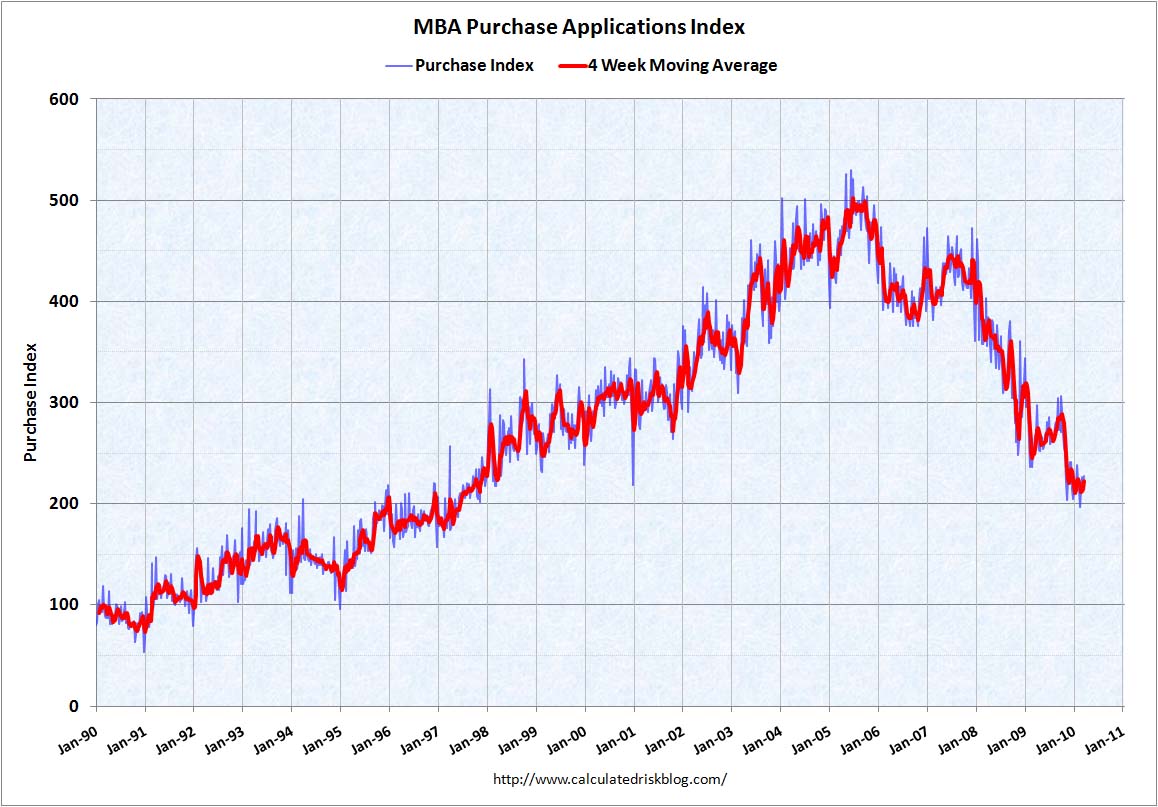
MBA: Mortgage refinance activity increases sharply, Purchase activity declines
The MBA reports: Refinance Activity Increases to Highest Level Since May 2009 in Latest MBA Weekly Survey
The Refinance Index increased 17.1 percent from the previous week and was the highest Refinance Index observed in the survey since the week ending May 15, 2009. The seasonally adjusted Purchase Index decreased 3.4 percent from one week earlier.
...
The average contract interest rate for 30-year fixed-rate mortgages increased to 4.60 percent from 4.57 percent, with points increasing to 0.92 from 0.89 (including the origination fee) for 80 percent loan-to-value (LTV) ratio loans.
 Click on graph for larger image in new window.
This graph shows the MBA Purchase Index and four week moving average since 1990.
After falling sharply in May, the purchase index has been moving sideways for about three months. The index is 42% below the level of the last week of April (and about 32% below the last week of April using the 4-week average).
This recent collapse in the purchase index has already shown up as a decline in new home sales (counted when the contract is signed), and will show up in the July and August existing home sales report (July sales to be reported next week).
Thursday, August 12, 2010
Freddie Mac: 30 Year Mortgages Rates fall to series record low
by Calculated Risk on 8/12/2010 10:50:00 AM
From MarketWatch: Freddie Mac: Fixed-rate mortgages at record lows
Freddie Mac said Thursday the 30-year fixed-rate mortgage average fell to record low of 4.44% with an average 0.7 point for the week ending Aug. 12. In the previous period, the average was 4.49% ...This calls for a long term graph ...
 Click on graph for larger image in new window.
This graph shows the 30 year fixed rate mortgage interest rate based on the Freddie Mac survey since 1971.
The decline in mortgage rates is related to the weak economy and falling Treasury yields. Rates will probably fall again this week with the Ten Year Treasury yield down to 2.7%.
Note: this series only goes back to 1971. Mortgage rates were at or below 5% back in the 1950s.
Wednesday, August 04, 2010
MBA: Mortgage Purchase Applications increase slightly last week
by Calculated Risk on 8/04/2010 07:24:00 AM
The MBA reports: Mortgage Applications Increase in Latest MBA Weekly Survey
The Refinance Index increased 1.3 percent from the previous week. The seasonally adjusted Purchase Index increased 1.5 percent from one week earlier. This third straight weekly increase in the Purchase Index was driven by government purchase applications which increased 3.4 percent from last week, while conventional purchase applications were essentially flat.
...
The average contract interest rate for 30-year fixed-rate mortgages decreased to 4.60 percent from 4.69 percent, with points increasing to 0.93 from 0.88 (including the origination fee) for 80 percent loan-to-value (LTV) ratio loans.
 Click on graph for larger image in new window.
This graph shows the MBA Purchase Index and four week moving average since 1990.
The purchase index has increased slightly for three straight weeks - but is still 40% below the level of the last week of April (and about 33% below the last week of April using the 4-week average).
This recent collapse in the purchase index has already shown up as a decline in new home sales (counted when the contract is signed), and will show up in the July and August existing home sales reports (counted at close of escrow).
Wednesday, July 14, 2010
MBA: Mortgage Purchase Applications lowest since December 1996
by Calculated Risk on 7/14/2010 07:46:00 AM
The MBA reports: Mortgage Applications Decrease in Latest MBA Weekly Survey
The Refinance Index decreased 2.9 percent from the previous week and the seasonally adjusted Purchase Index decreased 3.1 percent from one week earlier. This was the lowest Purchase Index observed in the survey since December 1996.
...
The average contract interest rate for 30-year fixed-rate mortgages increased to 4.69 percent from 4.68 percent, with points increasing to 0.96 from 0.86 (including the origination fee) for 80 percent loan-to-value (LTV) ratio loans.
 Click on graph for larger image in new window.
This graph shows the MBA Purchase Index and four week moving average since 1990.
Mortgage applications have fallen off a cliff. The weekly applications index is at the lowest level since December 1996, and and the four week average is at the lowest level since September 1995 - almost 15 years ago. The four week average is off 35% since the mini-peak in April (the weekly index is off 44% since the end of April).
This collapse in the mortgage application index has already shown up as a decline in new home sales, and will show up in the July existing home sales report (counted at close of escrow).
Thursday, July 08, 2010
30 Year Mortgage Rates fall to Record Low
by Calculated Risk on 7/08/2010 02:16:00 PM
From Freddie Mac: 30-Year Fixed Rate Mortgage Drops Slightly to Create Another New Low
Freddie Mac today released the results of its Primary Mortgage Market Survey® (PMMS®) in which the 30-year fixed-rate mortgage (FRM) averaged 4.57 percent with an average 0.7 point for the week ending July 8, 2010, down from last week when it averaged 4.58 percent. Last year at this time, the 30-year FRM averaged 5.20 percent. This rate is yet another all-time low in Freddie Mac’s 39-year survey.
...
“With mortgage rates falling to historic lows, refinance activity has been strong over the past three months,” said Frank Nothaft, Freddie Mac vice president and chief economist. “The Bureau of Economic Analysis. reported that the effective mortgage rate of all loans outstanding was just below six percent in the first quarter of 2010, the lowest since the series began in 1977. Since the start of the second quarter, two out of three mortgage applications on average were for refinancing, according the Mortgage Bankers Association."
 Click on graph for larger image in new window.
This graph shows the 30 year fixed rate mortgage interest rate from the Freddie Mac Primary Mortgage Market Survey®.
The red line is a quarterly estimate from the BEA of the effective rate of interest on all outstanding mortgages (Owner- and Tenant-occupied residential housing).
The effective rate on outstanding mortgages is at a series low of just under 6%, but the rate is moving down slowly since so many borrowers can't refinance because they do not qualify (either because the property value is too low or their incomes are insufficient).
Wednesday, July 07, 2010
Falling Mortgage Rates and Refi Mini-Boom
by Calculated Risk on 7/07/2010 09:50:00 AM
The Mortgage Bankers Association reported this morning that refinance activity increased again:
The Refinance Index increased 9.2 percent from the previous week and is the highest Refinance Index observed in the survey since the week ending May 15, 2009.
...
The refinance share of mortgage activity increased to 78.7 percent of total applications from 76.8 percent the previous week, which is the highest refinance share observed in the survey since April 2009.
 Click on graph for larger image in new window.
This graph shows the monthly MBA refinance index (Blue) and mortgage rates from the Freddie Mac Primary Mortgage Market Survey - and the Fed Funds target rate since Jan 1990.
Even with the recent decline in mortgage rates, refinance activity is still well below the peak in 2009. The reason is the 30 year mortgage rate is only slightly below the rates of April and May 2010 (4.6% now compared to just over 4.8% in 2009), so for those who refinanced last year there isn't much incentive to refinance now (considering the cost to refinance).
Of course many homeowners can't refinance because they owe more than their homes are worth, or their incomes have declined and they can't qualify.
Thursday, June 24, 2010
30 Year Mortgage Rates fall to Record Low
by Calculated Risk on 6/24/2010 10:54:00 AM
From Reuters: Mortgage Rates Drop to Lowest Level on Record
Interest rates on U.S. 30-year fixed-rate mortgages, the most widely used loan, averaged 4.69 percent for the week ended June 24, the lowest since Freddie Mac started the survey in April 1971.
 Click on graph for larger image in new window.
This graph shows the 30 year fixed rate mortgage interest rate, and the Ten year Treasury yield since 2002. The 30 year mortgage rate is now at a series low (started in 1971), although the spread between the mortgage rate and the treasury yield has widened about 30 bps recently.
The decline in mortgage rates is related to the weak economy and falling treasury yields.
Wednesday, June 16, 2010
MBA: Mortgage Purchase Applications increase slightly, near 13 Year Low
by Calculated Risk on 6/16/2010 07:11:00 AM
The MBA reports: Mortgage Applications Increase in Latest MBA Weekly Survey
The Refinance Index increased 21.1 percent from the previous week. This is the highest Refinance Index recorded in the survey since May 2009. The seasonally adjusted Purchase Index increased 7.3 percent from one week earlier, which is the first increase in six weeks.
...
“Mortgage applications for home purchases increased last week, the first increase in over a month. Refinance applications also picked up significantly over the week,” said Michael Fratantoni, MBA’s Vice President of Research and Economics. “While it is clear that purchase applications in May dropped sharply as a result of the tax credit induced increase in applications in April, it is unclear whether we are seeing the beginnings of a rebound now.”
...
The average contract interest rate for 30-year fixed-rate mortgages increased to 4.82 percent from 4.81 percent, with points decreasing to 0.89 from 1.02 (including the origination fee) for 80 percent loan-to-value (LTV) ratio loans.
 Click on graph for larger image in new window.
This graph shows the MBA Purchase Index and four week moving average since 1990.
The purchase index has collapsed following the expiration of the tax credit suggesting home sales will fall sharply too. This is the lowest level for 4-week average of the purchase index since February 1997.
Wednesday, May 26, 2010
Mortgage Refinance Activity
by Calculated Risk on 5/26/2010 11:33:00 PM
With the recent decline in mortgage rates, the Mortgage Bankers Association (MBA) has reported an increase in refinance activity. But so far the activity is far below the levels of early 2009 even though mortgage rates are at about the same level.
This is because most people who could refinance already did last year ... Click on graph for larger image in new window.
This graph shows the weekly MBA refinance activity, and the Ten Year Treasury yield (Note: Using the 10 year to approximate moves in mortgage rates).
Every time the 10 year yield drops sharply, refinance activity picks up. But notice what happened at the end of 1995. The Ten Year yield dropped, but the increase in refinance activity was muted. This was because mortgage rates didn't fall below the rates of a couple years earlier - and many people had already refinanced at those lower rates.
The same thing is happening now, and although activity has increased, there will only be a huge surge in refinance activity if mortgage rates fall below the rates of 2009.
MBA: Mortgage Purchase Applications at 13 Year Low
by Calculated Risk on 5/26/2010 08:07:00 AM
The MBA reports: Mortgage Refinance Applications Continue to Increase, Purchase Applications Decline Further
The Market Composite Index, a measure of mortgage loan application volume, increased 11.3 percent on a seasonally adjusted basis from one week earlier ...
The Refinance Index increased 17.0 percent from the previous week. This third consecutive increase marks the highest Refinance Index recorded in the survey since October 2009. The seasonally adjusted Purchase Index decreased 3.3 percent from one week earlier and is the lowest Purchase Index observed in the survey since April 1997.
...
“Refinance application volume jumped last week as continuing financial market turmoil related to the budget crises in Europe extended the opportunity for homeowners to lock in at historically low mortgage rates,” said Michael Fratantoni, MBA’s Vice President of Research and Economics. “In contrast, purchase applications fell further this week, following last week’s sharp decline, keeping the purchase index at 13-year lows.”
...
The average contract interest rate for 30-year fixed-rate mortgages decreased to 4.80 percent from 4.83 percent, with points remaining constant at 1.08 (including the origination fee) for 80 percent loan-to-value (LTV) ratio loans. This is the lowest 30-year fixed-rate recorded in the survey since the week ending November 27, 2009.
 Click on graph for larger image in new window.
This graph shows the MBA Purchase Index and four week moving average since 1990.
There was a spike in purchase applications in April, followed by a decline to a 13 year low last week. As Fratantoni noted last week: "The data continue to suggest that the tax credit pulled sales into April at the expense of the remainder of the spring buying season."
Thursday, May 20, 2010
Freddie Mac: Near Record Low Mortgage Rates
by Calculated Risk on 5/20/2010 02:45:00 PM
From Freddie Mac: Long- and Short-Term Mortgage Rates Fall Again This Week
Freddie Mac today released the results of its Primary Mortgage Market Survey® (PMMS®) in which the 30-year fixed-rate mortgage (FRM) averaged 4.84 percent with an average 0.7 point for the week ending May 20, 2010, down from last week when it averaged 4.93 percent. Last year at this time, the 30-year FRM averaged 4.82 percent. Once again, the 30-year FRM has not been lower since the week ending December 10, 2009, when it averaged 4.81 percent.The record low was 4.71% for the week of Dec 3, 2009 (series started in 1971).
The decline in mortgage rates is being driven by the decrease in the Treasury yield. The Ten Year treasury yield is currently at 3.26%.
 Click on graph for larger image in new window.
This graph shows the 30 year mortgage rates from the Freddie Mac survey, and the ten year Treasury yields, since January 2008.
The spread between the two series has widened slightly since the program ended.
From Bloomberg:
The difference between yields on the Fannie Mae securities and 10-year Treasuries widened 0.03 percentage point to 0.81 percentage point, Bloomberg data show. The spread reached 0.59 percentage point on March 29, the lowest on record ... The gap climbed to 0.86 percentage point May 6, after holding near that low in April.As an aside, the euro has strengthened a little and is close to 1.26 dollars today - up from 1.23 yesterday.
Wednesday, May 19, 2010
MBA: Mortgage Purchase Applications 'Plummet' to 13 Year Low
by Calculated Risk on 5/19/2010 07:31:00 AM
The MBA reports: Mortgage Purchase Applications Plummet While Refinance Applications Increase in Latest MBA Weekly Survey
The Market Composite Index, a measure of mortgage loan application volume, decreased 1.5 percent on a seasonally adjusted basis from one week earlier....
The Refinance Index increased 14.5 percent from the previous week and the seasonally adjusted Purchase Index decreased 27.1 percent from one week earlier. This is the lowest Purchase Index observed in the survey since May of 1997. ...
“Purchase applications plummeted 27 percent last week and have declined almost 20 percent over the past month, despite relatively low interest rates. The data continue to suggest that the tax credit pulled sales into April at the expense of the remainder of the spring buying season. In fact, this drop occurred even as rates on 30-year fixed-rate mortgages continued to fall, and at 4.83 percent are at their lowest level since November 2009,” said Michael Fratantoni, MBA’s Vice President of Research and Economics. “However, refinance borrowers did react to these lower rates, with refi applications up almost 15 percent, hitting their highest level in nine weeks.”
... The average contract interest rate for 30-year fixed-rate mortgages decreased to 4.83 percent from 4.96 percent, with points increasing to 1.08 from 0.91 (including the origination fee) for 80 percent loan-to-value (LTV) ratio loans.
 Click on graph for larger image in new window.
This graph shows the MBA Purchase Index and four week moving average since 1990.
There was a spike in purchase applications in April, followed by a decline to a 13 year low last week. As Fratantoni noted: "The data continue to suggest that the tax credit pulled sales into April at the expense of the remainder of the spring buying season."
Wednesday, April 07, 2010
MBA: Mortgage Refinance Actvity Declines as Rates Rise
by Calculated Risk on 4/07/2010 08:52:00 AM
The MBA reports: Mortgage Refinance Applications Decrease in Latest MBA Weekly Survey
The Market Composite Index, a measure of mortgage loan application volume, decreased 11.0 percent on a seasonally adjusted basis from one week earlier. ...
The Refinance Index decreased 16.9 percent from the previous week and the seasonally adjusted Purchase Index increased 0.2 percent from one week earlier. ...
The refinance share of mortgage activity decreased to 58.7 percent of total applications from 63.2 percent the previous week, marking the lowest share observed in the survey since the week ending August 28, 2009. ...
The average contract interest rate for 30-year fixed-rate mortgages increased to 5.31 percent from 5.04 percent, with points decreasing to 0.64 from 1.07 (including the origination fee) for 80 percent loan-to-value (LTV) ratio loans. This is the highest 30-year rate recorded in the survey since the first week of August 2009.
 Click on graph for larger image in new window.
This graph shows the MBA Purchase Index and four week moving average since 1990.
Although purchase activity was flat week-to-week, the four week average is moving up due to buyers trying to beat the expiration of the tax credit. I expect any increase in activity this year to be less than the increase last year when buyers rushed to beat the expiration of the initial tax credit.
Monday, April 05, 2010
Rising Mortgage Rates: The End of the Refi mini-Boom?
by Calculated Risk on 4/05/2010 03:15:00 PM
The Ten Year treasury yield hit 4.0% this morning for the first time since Oct 2008. Mortgage rates are moving up too and that probably means that refinance activity will decline sharply. Click on graph for larger image in new window.
Refinance activity picks up when mortgage rates fall (for obvious reasons), and this graph shows the monthly refinance activity (MBA refinance index) and the 30 year fixed mortgage rate and one year adjustable mortgage rate (both from the Freddie Mac Primary Mortgage Market Survey) - and the Fed Funds target rate since Jan 1990.
Notice that following the '90/'91 and '01 recessions, the Fed kept lowering the Fed Funds rate because of high unemployment rates. This spurred refinance activity. The Fed can't lower the Fed Funds rate now - and could only spur refinance activity if they restarted the MBS purchase program.  The second graph shows the weekly MBA refinance activity, and the Ten Year Treasury yield.
When the ten year yield drops sharply, usually refinance activity picks up. And when the yield increases, refinance activity declines.
With the yield on the Ten Year Treasury increasing to 4%, and the end of the Fed MBS purchase program last week, mortgage rates will probably rise and refinance activity will fall sharply.
Wednesday, March 24, 2010
MBA: Mortgage Applications Decrease, Rates Rise
by Calculated Risk on 3/24/2010 08:52:00 AM
The MBA reports: Mortgage Refinance Applications Decrease in Latest MBA Weekly Survey
The Market Composite Index, a measure of mortgage loan application volume, decreased 4.2 percent on a seasonally adjusted basis from one week earlier. ...
The Refinance Index decreased 7.1 percent from the previous week and the seasonally adjusted Purchase Index increased 2.7 percent from one week earlier. ...
The refinance share of mortgage activity decreased to 65.0 percent of total applications from 67.3 percent the previous week. This is the lowest refinance share observed in the survey since the week ending October 30, 2009. ...
The average contract interest rate for 30-year fixed-rate mortgages increased to 5.01 percent from 4.91 percent, with points decreasing to 0.76 from 1.30 (including the origination fee) for 80 percent loan-to-value (LTV) ratio loans.
 Click on graph for larger image in new window.
This graph shows the MBA Purchase Index and four week moving average since 1990.
There was a slight increase in purchase applications last week, but the 4-week average is still near the levels of 1997 - after falling sharply at the end of last year. This index shows no indication yet of the expected increase in home sales due to the expiration of the home buyer tax credit.
Wednesday, March 17, 2010
MBA: Mortgage Applications Decrease, Mortgage Rates Fall
by Calculated Risk on 3/17/2010 08:03:00 AM
The MBA reports: Mortgage Applications Decrease in Latest MBA Weekly Survey
The Market Composite Index, a measure of mortgage loan application volume, decreased 1.9 percent on a seasonally adjusted basis from one week earlier. ...
The Refinance Index decreased 1.7 percent from the previous week and the seasonally adjusted Purchase Index decreased 2.3 percent from one week earlier. ...
The refinance share of mortgage activity increased to 67.3 percent of total applications from 67.2 percent the previous week. ...
The average contract interest rate for 30-year fixed-rate mortgages decreased to 4.91 percent from 5.01 percent, with points increasing to 1.30 from 0.82 (including the origination fee) for 80 percent loan-to-value (LTV) ratio loans. This is the lowest 30-year fixed-rate observed in the survey since mid-December of 2009, yet the effective rate was unchanged from last week due to the significant increase in points.
 Click on graph for larger image in new window.
This graph shows the MBA Purchase Index and four week moving average since 1990.
Even with mortgage rates below 5%, the 4 week average of the purchase index is still at the levels of 1997.
Thursday, March 11, 2010
The Countdown: Federal Reserve MBS Purchases 98.4% Complete
by Calculated Risk on 3/11/2010 05:10:00 PM
Some key points:
Here is the Federal Reserve balance sheet break down from the Atlanta Fed weekly Financial Highlights released today (as of last week):
 Click on graph for larger image in new window.
Graph Source: Altanta Fed.
From the Atlanta Fed:
The balance sheet contracted $6.9 billion for the week ended March 3.Holdings of agency debt and mortgage backed securities shrank $4.7 billion, and other assets declined by $2.2 billion. The balance sheet is expected to peak during the first half of this year after the MBS purchase program is completed and purchases settle on the balance sheet.
 The second graph shows the MBS purchases by week. From the Atlanta Fed:
 The NY Fed purchased an additional net $10 billion in MBS for the week ending ending March 10th. This puts the total purchases at $1.230 trillion or almost 98.4% complete. Just $20 billion more and three weeks to go ...The Fed purchased a net total of $10 billion of agency-backed MBS through the week of March 3. This purchase brings its total purchases up to $1.22 trillion, and by the end of the first quarter 2010 the Fed will have purchased $1.25 trillion (thus, it is 98% complete).
The Fed's balance sheet released today shows "only" $1.029 trillion in MBS on March 10th. As mentioned above, the difference is the NY Fed announces the purchases when they contract to buy; the Federal Reserve places the MBS on the balance sheet when the contract settles.
The countdown ends in 3 weeks, and I don't expect any fireworks ...
Thursday, March 04, 2010
Freddie Mac: Mortgage Rates below 5% Again
by Calculated Risk on 3/04/2010 02:58:00 PM
From Freddie Mac:
Freddie Mac today released the results of its Primary Mortgage Market Survey® (PMMS®) in which the 30-year fixed-rate mortgage (FRM) averaged 4.97 percent with an average 0.7 point for the week ending March 4, 2010, down from last week when it averaged 5.05 percent. Last year at this time, the 30-year FRM averaged 5.15 percent.
 Click on graph for larger image in new window.
As an aside, in a research note yesterday, Goldman Sachs argued "our analysis only points to a modest rise in mortgage rates of around 10bp when the Fed stops buying MBS in a few weeks." Further they argue the large increase (maybe 80 bps increase in spread) will not happen until the Fed announces they will be selling MBS.
Thursday, February 25, 2010
Fed MBS Purchases and the Impact on Mortgage Rates
by Calculated Risk on 2/25/2010 02:07:00 PM
First, the following graph is from the Atlanta Fed Financial Highlights, and shows the weekly Fed MBS purchases since January 2009: Click on graph for larger image.
From the Atlanta Fed:
Freddie Mac report that mortgage rates increased last week. From Freddie Mac: Long-Term Rates Rise to Over 5 Percent for the First Time in Three WeeksThe Fed purchased a net total of $11 billion of agency-backed MBS through the week of February 17. This purchase brings its total purchases up to $1.199 trillion, and by the end of the first quarter of 2010 the Fed will have purchased $1.25 trillion (thus, it is 96% complete).
Freddie Mac today released the results of its Primary Mortgage Market Survey® (PMMS®) in which the 30-year fixed-rate mortgage (FRM) averaged 5.05 percent with an average 0.7 point for the week ending February 25, 2010, up from last week when it averaged 4.93 percent. Last year at this time, the 30-year FRM averaged 5.07 percent.
...
“Interest rates for 30-year fixed mortgages followed long-term bond yields higher and rose above 5 percent this week amid a mixed set of economic data reports” said Frank Nothaft, Freddie Mac vice president and chief economist.
 And that brings us to this graph from Political Calculations based on some of my posts: Predicting Mortgage Rates and Treasury Yields
Using their calculator and a Ten Year Yield of 3.75%, we would expect the 30 year Freddie Mac fixed mortgage rate to be around 5.62%. Current mortgage rates are lower than expected - as they have been since early in 2009 - and some of the difference from the expected rate is probably due to the Fed's MBS purchases (also prepayment speed is a factor - and also just randomness).
 The final graph shows the expected mortgage rates (UPDATE: based on formula in previous graph) with Ten Year Treasury yields on the x-axis, and actual mortgage rates from Freddie Mac (weekly) since the beginning of 2009 on the y-axis.
Note: Y-axis doesn't start at zero to better show the change.
There are many factors in determining the spread between the Ten Year Treasury yield and the 30 year mortgage rates (like the supply of new MBS) - but this graph suggests to me that mortgage rates will rise 35 to 50 bps relative to the Ten Year when the Fed stops buying agency MBS at the end of March.
Monday, February 15, 2010
Predictions on Mortgage Rates after the Fed Stops Buying
by Calculated Risk on 2/15/2010 03:51:00 PM
From Carolyn Said at the San Francisco Chronicle: Mortgage rates poised to jump as Fed cuts funds. The following predictions are excerpts from her article:
And a couple earlier predictions:Guy Cecala, publisher of Inside Mortgage Finance. "My opinion is that rates will go up a full percentage point initially," meaning that 30-year fixed conforming loans, now hovering around 5 percent, would hit 6 percent. Keith Gumbinger, vice president of HSH Associates, which compiles mortgage loan data, thinks that rates will slowly rise to about 5.75 percent after the Fed withdraws. Julian Hebron, branch manager at RPM Mortgage's San Francisco office, anticipates a bump up to around 5.5 percent by summer ... Christopher Thornberg, principal at Beacon Economics in Los Angeles [said] "Clearly, when they stop printing all that money, it's going to be a shock to the system. I have to assume that when they pull back on it, it will cause a 100- to 200-basis-points rise" to rates of 6 percent or 7 percent ...
My own estimate is for an increase in the spread - relative to the 10 Year Treasury - of about 35 bps (maybe 50 bps).


