 RSS Feed
 by Calculated Risk on 12/23/2010 11:58:00 AM
Showing posts with label PCE. Show all posts
Showing posts with label PCE. Show all posts
Thursday, December 23, 2010
Comments on November Personal Income and Outlays Report
The BEA released the Personal Income and Outlays report for November this morning.
Personal income increased $42.3 billion, or 0.3 percent ... Personal consumption expenditures (PCE) increased $43.3 billion, or 0.4 percent.The following graph shows real Personal Consumption Expenditures (PCE) through November (2005 dollars). Note that the y-axis doesn't start at zero to better show the change.
...
Real PCE -- PCE adjusted to remove price changes -- increased 0.3 percent in November, compared with an increase of 0.5 percent in October.
 Click on graph for large image.
The quarterly change in PCE is based on the change from the average in one quarter, compared to the average of the preceding quarter.
The two-month method of estimating real PCE growth for Q4 (a fairly accurate method), suggests real PCE growth of 4.3% in Q4! So this looks like a pretty strong quarter for growth in personal consumption. The last time real PCE grew at more than 4% was in 2006.
Also personal income less transfer payments increased again in November. This increased to $9,305 billion (SAAR, 2005 dollars) from $9,282 billion in October. This measure had stalled out over the summer.
 This graph shows real personal income less transfer payments as a percent of the previous peak. This has been slow to recover - and is still 4.5% below the previous peak - but personal income less transfer payments is growing again.
Some of the increase in spending came from a decline in the personal saving rate, but overall this was a positive report and suggests solid GDP growth in Q4 (3% or higher).
Wednesday, November 24, 2010
Comments on October Personal Income and Outlays Report
by Calculated Risk on 11/24/2010 03:28:00 PM
The BEA released the Personal Income and Outlays report for October this morning.
Personal income increased $57.6 billion, or 0.5 percent ... Personal consumption expenditures (PCE) increased $44.0 billion, or 0.4 percent.The following graph shows real Personal Consumption Expenditures (PCE) through October (2005 dollars). Note that the y-axis doesn't start at zero to better show the change.
...
Real PCE -- PCE adjusted to remove price changes -- increased 0.3 percent in October, compared with an increaseof 0.2 percent in September.
 Click on graph for large image.
The quarterly change in PCE is based on the change from the average in one quarter, compared to the average of the preceding quarter.
Even with no growth in November and December, PCE growth will be close to 2% in Q4, and it will probably be closer to 3% (annualized growth rate).
Also personal income less transfer payments increased sharply in October. This increased to $9,285.7 billion (SAAR, 2005 dollars) from $9,252.2 billion in September. This measure had stalled out over the summer.
 This graph shows real personal income less transfer payments as a percent of the previous peak. This has been slow to recover - and is still 4.7% below the previous peak - but is recovering again.
 Overall this was a fairly positive report, in line with consensus expectations, and suggests decent (but not robust) growth in October.
Monday, November 01, 2010
Personal income declines 0.1%, Spending increases 0.2% in September
by Calculated Risk on 11/01/2010 08:30:00 AM
From the BEA: Personal Income and Outlays, June 2010
Personal income decreased $16.8 billion, or 0.1 percent, and disposable personal income (DPI) decreased $20.3 billion, or 0.2 percent, in September ... Personal consumption expenditures (PCE) increased $17.3 billion, or 0.2 percent.
...
Real PCE -- PCE adjusted to remove price changes -- increased 0.1 percent in September, compared with an increase of 0.3 percent in August.
...
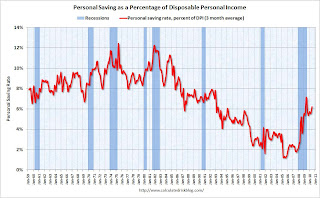
Personal saving as a percentage of disposable personal income was 5.3 percent in September, compared with 5.6 percent in August.
 Click on graph for large image.
This graph shows real personal income less transfer payments since 1969.
This measure of economic activity is moving sideways - similar to what happened following the 2001 recession.
This month the saving rate decreased ...
 This graph shows the saving rate starting in 1959 (using a three month trailing average for smoothing) through the Setpember Personal Income report.
 In September, income declined 0.1%, and spending increased 0.2% - so the saving rate decreased to 5.3% in September (5.5% using a three month average).
I expect the saving rate to rise some more over the next year, perhaps to 8% or so - keeping the pace of PCE growth below income growth.
Tuesday, August 03, 2010
Personal Income, Spending flat in June
by Calculated Risk on 8/03/2010 08:30:00 AM
From the BEA: Personal Income and Outlays, June 2010
Personal income increased $3.0 billion, or less than 0.1 percent ... Personal consumption expenditures (PCE) decreased $2.9 billion, or less than 0.1 percent.
...
Real PCE -- PCE adjusted to remove price changes -- increased 0.1 percent in June, compared with an increase of 0.2 percent in May.
...
Personal saving as a percentage of disposable personal income was 6.4 percent in June
 Click on graph for large image.
This graph shows the saving rate starting in 1959 (using a three month trailing average for smoothing) through the June Personal Income report. The saving rate increased to 6.4% in June (increased to 6.2% using a three month average).
I expect the saving rate to rise some more over the next year, perhaps to 8% or so - keeping the pace of PCE growth below income growth. But the good news is the saving rate is much higher than orginally estimated, so much of the expected drag from an increase in the saving rate has already happened.
Saturday, July 31, 2010
Restaurant Index shows contraction in June
by Calculated Risk on 7/31/2010 08:56:00 AM
This is one of several industry specific indexes I track each month.  Click on graph for larger image in new window.
Same store sales and customer traffic both declined in June (on a year-over-year basis). This is the third consecutive month of declines.
Unfortunately the data for this index only goes back to 2002.
Note: Any reading above 100 shows expansion for this index.
From the National Restaurant Association (NRA): Industry Outlook Softened in June as the Restaurant Performance Index Declined for the Third Consecutive Month
As a result of a dampened outlook among restaurant operators, the National Restaurant Association's comprehensive index of restaurant activity declined for the third consecutive month in June. The Association's Restaurant Performance Index (RPI) - a monthly composite index that tracks the health of and outlook for the U.S. restaurant industry - stood at 99.5 in June, down 0.3 percent from May and the lowest index level since February.Restaurants are a discretionary expense, and this contraction could be because of the sluggish recovery or might suggest further weakness in consumer spending in the months ahead.
In addition, the RPI stood below 100 for the second consecutive month, which signifies contraction in the index of key industry indicators.
...
Restaurant operators reported a net decline in same-store sales for the third consecutive month in June, though the results were a modest improvement from the May performance.
...
Restaurant operators also reported a net decline in customer traffic levels in June.
...
Along with soft sales and traffic results, restaurant operators reported a dip in capital spending activity.
...
Restaurant operators are also not as optimistic about the direction of the overall economy. ... Restaurant operators’plans for capital expenditures fell to a six-month low this month.
emphasis added
Friday, July 30, 2010
Revisions: Real GDP and PCE well below previous peak
by Calculated Risk on 7/30/2010 11:32:00 AM
Error Correction: Sorry - I confused annual rates and quarterly rates.
Real GDP is 1.1% below the pre-recession peak, so if GDP would have to grow at 4.4% in Q3 the economy to be back to the pre-recession level.
Real PCE is 0.85% below the pre-recession peak, so PCE would have to grow at 3.4% in Q3 to be back to the pre-recession level.
________________________________________________________
These two graphs show the revisions for real GDP and PCE. Click on graph for larger image in new window.
The recession was clearly worse than originally estimated (we suspected this already using Gross Domestic Income).
In fact real GDP in Q2 2010 was lower than originally reported for Q1 2010. And annualized real GDP is still 1.1% below the pre-recession peak. This means that real GDP would have to grow at a 4.3% rate over the next quarter to reach the recession peak.
This shows that St Louis Fed President Bullard was too optimistic in a speech last month. From Bullard in June: The Global Recovery and Monetary Policy
"As of the first quarter of 2010, real GDP stands just shy of the 2008 second quarter level, so that growth of about 1.25 percent would be sufficient to allow real GDP to surpass the previous peak. At that point, the U.S. economy would be fully "recovered" from the very sharp downturn of late 2008 and early 2009. To be clear, the 1.25 percent is a quarterly number, and would be 5.0 percent at an annual rate. Although I think that 5.0 percent at an annual rate is too much to expect for current quarter real GDP growth, it seems like a reasonable possibility over the next two quarters combined. Given these conditions, I expect the U.S. recovery in GDP to be complete in the third quarter of this year."I disagreed with him, and pointed out that GDI suggested downward revisions.
 Real PCE was revised down even more.
Annualized real PCE is now 0.85% below the pre-recession peak, and would have to grow 3.4% over the next quarter to reach the previous peak.
Cleveland Fed President Sandra Pianalto had it right in February: When the Small Stuff Is Anything But Small
[I]t may take years just to get back to the level of output we enjoyed in 2007, just before the economic crisis began.If things go well, the economy will be back to pre-recession levels later this year or in 2011. No wonder there is so little investment. And no wonder there is so little hiring!
Wednesday, June 30, 2010
Restaurant Index "Softened" in May
by Calculated Risk on 6/30/2010 11:57:00 AM
This is one of several industry specific indexes I track each month.  Click on graph for larger image in new window.
For the second consecutive month, same store sales and customer traffic both declined in May (year-over-year).
This has taken a toll on the positive outlook in the "expectations index" and the overall index showed contraction in May.
Unfortunately the data for this index only goes back to 2002.
Note: Any reading above 100 shows expansion for this index.
From the National Restaurant Association (NRA): Restaurant Industry Outlook Softened in May as Restaurant Performance Index Fell Below 100
The outlook for the restaurant industry softened in May, as the National Restaurant Association’s comprehensive index of restaurant activity fell below 100 for the first time in three months. The Association’s Restaurant Performance Index (RPI) – a monthly composite index that tracks the health of and outlook for the U.S. restaurant industry – stood at 99.7 in May, down 0.7 percent from April’s level of 100.4.Restaurants are a discretionary expense, and they tend to be 'first in, last out' of a recession for consumer spending (as opposed to housing that is usually first in and first out). Since restaurants both lead and lag recessions, this contraction could be because of the sluggish recovery or might suggest further weakness in consumer spending in the months ahead.
...
Restaurant operators reported a net decline in same-store sales for the second consecutive month in May.
...
Restaurant operators also reported softer customer traffic results in May.
...
Although sales and traffic results softened in May, restaurant operators reported an uptick in capital spending activity.
...
Although restaurant operators remain optimistic about sales growth in the months ahead, their optimism slipped somewhat in recent months.
emphasis added
Monday, June 28, 2010
Personal Income up 0.4%, Spending Increases 0.2% in May
by Calculated Risk on 6/28/2010 08:30:00 AM
From the BEA: Personal Income and Outlays, April 2010
Personal income increased $53.7 billion, or 0.4 percent ... Personal consumption expenditures (PCE) increased $24.4 billion, or 0.2 percent.The following graph shows real Personal Consumption Expenditures (PCE) through May (2005 dollars). Note that the y-axis doesn't start at zero to better show the change.
...
Real PCE -- PCE adjusted to remove price changes -- increased 0.3 percent in May, in contrast to a decrease of less than 0.1 percent in April
...
Personal saving as a percentage of disposable personal income was 4.0 percent in May, compared with 3.8 percent in April.
 Click on graph for large image.
The quarterly change in PCE is based on the change from the average in one quarter, compared to the average of the preceding quarter.
Even with no growth in June, PCE growth in Q2 would be
The National Bureau of Economic Research (NBER) uses several measures to determine if the economy is in recession. One of the measures is real personal income less transfer payments (see NBER memo). This increased in May to $9,113.9 billion (SAAR) and is barely above the low of October 2009 ($8,987 billion).
 This graph shows real personal income less transfer payments since 1969.
This measure of economic activity is moving sideways - similar to what happened following the 2001 recession.
This month income increased faster than spending ... meaning the saving rate increased.
 This graph shows the saving rate starting in 1959 (using a three month trailing average for smoothing) through the May Personal Income report. The saving rate increased to 4.0% in April (increased to 3.7% using a three month average).
 I still expect the saving rate to rise over the next couple of years slowing the growth in PCE.
The increase in income was good news, but personal income less transfer payments are still only 1.4% above the low of last year.
Monday, May 31, 2010
Real PCE Growth in Q2
by Calculated Risk on 5/31/2010 09:13:00 AM
Note: Here is the Weekly Summary and a Look Ahead (it will be a busy week).
On Friday, the BEA released the Personal Income and Outlays report for April. The report showed that Real PCE increased less than 0.1 percent in April (compared to March).
Even though the month-to-month increase was small, this was fairly large increase from January (comparing the first month of Q2 to the first month of Q1).
In calculating PCE for the GDP report, the quarterly change in PCE is based on the change from the average in one quarter, compared to the average of the preceding quarter.
The following graph illustrates how this is calculated. Note that the y-axis doesn't start at zero to better show the change.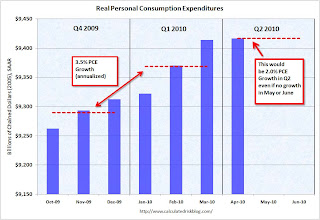 Click on graph for large image.
The blue columns show real PCE by month, and the dashed red lines are the quarterly average.
PCE didn't increase much in January compared to December either, but there was strong growth in February and March. This resulted in PCE growing at an annualized rate of 3.5% for Q1.
Even if PCE was flat in May and June compared to April (preliminary reports suggest growth in May), real PCE would grow at 2.0% in Q2. More likely - with some growth in May and June - PCE will grow closer to 3% in Q2.
This is just a reminder that PCE growth (and GDP growth) is pretty much already baked into Q2.
Best to all.
Friday, May 28, 2010
April Personal Income up 0.4%, Spending Increases Slightly
by Calculated Risk on 5/28/2010 08:30:00 AM
From the BEA: Personal Income and Outlays, April 2010
Personal income increased $54.4 billion, or 0.4 percent ... Personal consumption expenditures (PCE) increased $4.0 billion, or less than 0.1 percent.The following graph shows real Personal Consumption Expenditures (PCE) through April (2005 dollars). Note that the y-axis doesn't start at zero to better show the change.
...
Real PCE -- PCE adjusted to remove price changes -- increased less than 0.1 percent in April
...
Personal saving as a percentage of disposable personal income was 3.6 percent in April, compared with 3.1 percent in March.
 Click on graph for large image.
The quarterly change in PCE is based on the change from the average in one quarter, compared to the average of the preceding quarter.
The colored rectangles show the quarters, and the blue bars are the real monthly PCE.
Spending only increased slightly in April compared to March.
The National Bureau of Economic Research (NBER) uses several measures to determine if the economy is in recession. One of the measures is real personal income less transfer payments (see NBER memo). This increased in April to $9,059 billion (SAAR) and is barely above the low of October 2009 ($8,987 billion).
 This graph shows real personal income less transfer payments since 1969.
This measure of economic activity is moving sideways - similar to what happened following the 2001 recession.
This month income increased faster than spending ... meaning the saving rate increased.
 This graph shows the saving rate starting in 1959 (using a three month trailing average for smoothing) through the April Personal Income report. The saving rate increased to 3.6% in April (decreased slightly using a three month average).
 I still expect the saving rate to rise over the next couple of years slowing the growth in PCE.
The increase in income was good news, but personal income less transfer payments are still barely above the low of last year.
Thursday, May 06, 2010
Q1 PCE Growth came from Transfer Payments and Reductions in Personal Saving
by Calculated Risk on 5/06/2010 01:02:00 PM
This is a theme I've probably already pounded into the ground ... but here is some more from the Atlanta Fed's Economic Highlights:  Click on graph for larger image in new window.
This graph is from the Altanta Fed and shows the month-to-month increase in government transfer payments (green) and the change in real personal income less transfer payments (flat red line).
From the Atlanta Fed:
The major contributor to income growth during the past several months has been transfer payments.We could take this a step further ... the following table shows month-to-month increase in transfer payments and the month-to-month reduction in personal saving - and then compares to the month-to-month increase in Personal Consumption Expenditures (PCE). Note: all numbers are annual rates.
| Monthly Increase, Billions (SAAR) | Jan-10 | Feb-10 | Mar-10 |
|---|---|---|---|
| Government Transfer Payments | |||
| Old-age, survivors, disability, and health insurance benefits | -1.5 | 3.1 | 5.1 |
| Government unemployment insurance benefits | -6.6 | -2.2 | 11.8 |
| Other | 33.7 | 6.4 | 7.8 |
| Reduction in Personal saving | 55.1 | 54 | 28.2 |
| Total Saving Reduction and Transfer Payments | 80.7 | 61.3 | 52.9 |
| Increase in Personal outlays | 34.4 | 58.3 | 60.6 |
This shows that the entire increase in consumption in Q1 was due to transfer payments and reductions in the saving rate (now down to 2.7% in March). I suppose the saving rate could go to zero - although I expect it to increase, maybe incorrectly! - but at some point increases in consumption are going to have to come from jobs and income growth, not government transfer payments and reductions in the saving rate.
Monday, May 03, 2010
March Personal Income up 0.3%, Spending Increases 0.6%
by Calculated Risk on 5/03/2010 08:33:00 AM
The BEA released Q1 data on Friday, and here is the March data from the BEA: Personal Income and Outlays, March 2010
Personal income increased $36.0 billion ... Personal consumption expenditures (PCE) increased $58.6 billion, or 0.6 percent.Once again spending increased much faster than income ... meaning the saving rate declined again.
...
Real PCE -- PCE adjusted to remove price changes -- increased 0.5 percent in March, the same increase as in February.
...
Personal saving -- DPI less personal outlays -- was $304.0 billion in March, compared with $332.2 billion in February. Personal saving as a percentage of disposable personal income was 2.7 percent in March, compared with 3.0 percent in February.
 Click on graph for large image.
This graph shows the saving rate starting in 1959 (using a three month trailing average for smoothing) through the March Personal Income report. The saving rate fell to 2.7% in March.
I still expect the saving rate to rise over the next couple of years slowing the growth in PCE.
The following graph shows real Personal Consumption Expenditures (PCE) through March (2005 dollars). Note that the y-axis doesn't start at zero to better show the change.
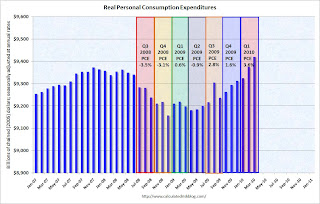 The quarterly change in PCE is based on the change from the average in one quarter, compared to the average of the preceding quarter.
The colored rectangles show the quarters, and the blue bars are the real monthly PCE.
The increase in PCE in March was strong and PCE increased 3.6% SAAR in Q1 2010. This increase in spending was driven by less saving and transfer payments.
The National Bureau of Economic Research (NBER) uses several measures to determine if the economy is in recession. One of the measures is real personal income less transfer payments (see NBER memo). This was flat in March at $9,039.4 billion (SAAR) compared to 9,037.5 billion in February, and is barely above the low of September 2009 ($9,000 billion).
 This graph shows real personal income less transfer payments since 1969.
This measure of economic activity is moving sideways - similar to what happened following the 2001 recession.
This is a solid report for PCE, but PCE growth is not sustainable without jobs and income growth.
Friday, April 30, 2010
Restaurant Index shows Expansion in March
by Calculated Risk on 4/30/2010 02:41:00 PM
This is one of several industry specific indexes I track each month.  Click on graph for larger image in new window.
This is the first time in 29 months that the index is showing expansion.
Unfortunately the data for this index only goes back to 2002.
Note: Any reading above 100 shows expansion for this index.
From the National Restaurant Association (NRA): Restaurant Industry Outlook Continues to Improve as Restaurant Performance Index Tops 100 for the First Time in More Than Two Years
[T]the National Restaurant Association’s Restaurant Performance Index (RPI) ... stood at 100.5 in March, up 1.4 percent from February and its strongest level since September 2007. In addition, the RPI rose above 100 for the first time in 29 months, which signifies expansion in the index of key industry indicators.Restaurants are a discretionary expense, and they tend to be 'first in, last out' of a recession for consumer spending (as opposed to housing that is usually first in and first out).
The RPI’s solid performance in March was driven by improvements among both the current-situation and forward-looking indicators,” said Hudson Riehle, senior vice president of the Research and Knowledge Group for the Association. “Restaurant operators reported net gains in both same-store sales and customer traffic in March, the first time in 31 months that both indicators stood in positive territory.”
“In addition, restaurant operators are increasingly optimistic about growth in sales and staffing levels in the months ahead, while their outlook for the economy soared to its strongest level in five years,” Riehle added.
...
For the first time in 22 months, restaurant operators reported net positive same-store sales.
...
Restaurant operators also reported a net increase in customer traffic in March, the first positive reading in 31 months.
emphasis added
Monday, March 29, 2010
February Personal Income Flat, Spending Increases
by Calculated Risk on 3/29/2010 08:30:00 AM
From the BEA: Personal Income and Outlays, January 2010
Personal income increased $1.2 billion, or less than 0.1 percent ... Personal consumption expenditures (PCE) increased $34.7 billion, or 0.3 percent.Stagnant income and increased spending means the saving rate declined again ...
...
Real PCE -- PCE adjusted to remove price changes -- increased 0.3 percent in February, compared with an increase of 0.2 percent in January.
...
Personal saving -- DPI less personal outlays -- was $340.0 billion in February, compared with $374.9 billion in January. Personal saving as a percentage of disposable personal income was 3.1 percent in February, compared with 3.4 percent in January.
 Click on graph for large image.
This graph shows the saving rate starting in 1959 (using a three month trailing average for smoothing) through the February Personal Income report. The saving rate fell to 3.1% in February.
I still expect the saving rate to rise over the next couple of years - possibly to 8% or more - slowing the growth in PCE.
The following graph shows real Personal Consumption Expenditures (PCE) through February (2005 dollars). Note that the y-axis doesn't start at zero to better show the change.
 The quarterly change in PCE is based on the change from the average in one quarter, compared to the average of the preceding quarter.
The colored rectangles show the quarters, and the blue bars are the real monthly PCE.
The increase in PCE in February was fairly strong (a 3.0% annual rate over the last three months). Using the Two Month average method, this suggests PCE growth in Q1 2010 will be around 3.0%. That will be the highest growth rate since Q1 2007, however this is being driven by less saving and transfer payments - not growth in income.
The National Bureau of Economic Research (NBER) uses several measures to determine if the economy is in recession. One of the measures is real personal income less transfer payments (see NBER memo). This declined in February to $9,006.4 billion (SAAR) from $9,020.2 billion in January, and is barely above the low of September 2009 ($9,000 billion).
 This graph shows real personal income less transfer payments since 1969.
This measure of economic activity is moving sideways - similar to what happened following the 2001 recession.
To sum it up:
This is a decent report for PCE, but PCE growth is not sustainable without income growth.
Friday, March 26, 2010
Q4 GDP Revised down to 5.6%
by Calculated Risk on 3/26/2010 08:18:00 AM
Real gross domestic product -- the output of goods and services produced by labor and property located in the United States -- increased at an annual rate of 5.6 percent in the fourth quarter of 2009 ... Real personal consumption expenditures increased 1.6 percent in the fourth quarter.The headline GDP number was revised down to 5.6% annualized growth in Q4 (from 5.9%). The following table shows the changes from the "advance estimate" to the "second estimate" to the "third estimate" for several key categories:
| Advance | Second Estimate | Third Estimate | |
|---|---|---|---|
| GDP | 5.7% | 5.9% | 5.6% |
| PCE | 2.0% | 1.7% | 1.6% |
| Residential Investment | 5.7% | 5.0% | 3.8% |
| Structures | -15.4% | -13.9% | -18.0% |
| Equipment & Software | 13.3% | 18.2% | 19.0% |
Monday, March 01, 2010
January Personal Income Flat, Spending Increases
by Calculated Risk on 3/01/2010 08:30:00 AM
From the BEA: Personal Income and Outlays, January 2010
Personal income increased $11.4 billion, or 0.1 percent, and disposable personal income (DPI) decreased $47.6 billion, or 0.4 percent, in January, according to the Bureau of Economic Analysis. ... Personal consumption expenditures (PCE) increased $52.4 billion, or 0.5 percent.
...
Real PCE -- PCE adjusted to remove price changes -- increased 0.3 percent in January, compared with an increase of 0.1 percent in December.
...
Personal saving -- DPI less personal outlays -- was $367.2 billion in January, compared with $467.9 billion in December. Personal saving as a percentage of disposable personal income was 3.3 percent in January, compared with 4.2 percent in December.
Monday, February 01, 2010
December PCE and Saving Rate
by Calculated Risk on 2/01/2010 08:30:00 AM
From the BEA: Personal Income and Outlays, November 2009
Personal Personal income increased $44.5 billion, or 0.4 percent, and disposable personal income (DPI) increased $45.9 billion, or 0.4 percent, in December, according to the Bureau of Economic Analysis. Personal consumption expenditures (PCE) increased $22.6 billion, or 0.2 percent.
...
Real PCE -- PCE adjusted to remove price changes -- increased 0.1 percent in December, compared with an increase of 0.4 percent in November.
...
Personal saving -- DPI less personal outlays -- was $534.2 billion in December, compared with $506.3 billion in November. Personal saving as a percentage of disposable personal income was 4.8 percent in December, compared with 4.5 percent in November.
 Click on graph for large image.
This graph shows the saving rate starting in 1959 (using a three month centered average for smoothing) through the December Personal Income report. The saving rate was 4.8% in December.
I expect the saving rate to continue to rise over the next couple of years - possibly to 8% or more - slowing the growth in PCE.
The following graph shows real Personal Consumption Expenditures (PCE) through December (2005 dollars). Note that the y-axis doesn't start at zero to better show the change.
 The quarterly change in PCE is based on the change from the average in one quarter, compared to the average of the preceding quarter.
The colored rectangles show the quarters, and the blue bars are the real monthly PCE.
The question is what happens to PCE growth in 2010?
Saturday, December 26, 2009
Inventories and Q4 GDP
by Calculated Risk on 12/26/2009 05:49:00 PM
Back in October, as a preview to the Q3 GDP report, I wrote: Inventory Restocking and Q3 GDP
I noted that GDP growth in Q3 and Q4 weren't in question because of a transitory boost from changes in private inventories and from stimulus spending.
Here is a repeat of the graph showing the contributions to GDP from changes in private inventories for the last several recessions. The blue shaded area is the last two quarters of each recession, and the light area is the first four quarters of each recovery. Click on graph for larger image in new window.
The Red line is the median of the last 5 recessions - and indicates about a 2% contribution to GDP from changes in inventories, for each of the first two quarters coming out of a recession.
The key is this boost is transitory.
Last quarter I thought a 1% to 2% contribution from changes in inventories was possible. The actual contribution was 0.69%. I suspect that changes in inventories will add more to Q4; probably closer to 2%.
I also thought Personal Consumption Expenditures (PCE) would be fairly strong in Q3, especially because of the cash-for-clunkers program. My guess was "3% PCE growth in Q3, and that would mean a contribution to GDP of about 2%." The final numbers were 2.8% and a contribution of 1.96%.
The following graph shows real Personal Consumption Expenditures (PCE) through November 2009 (in 2005 dollars). Note that the y-axis doesn't start at zero to better show the change. The quarterly change in PCE is based on the change from the average in one quarter, compared to the average of the preceding quarter.
The colored rectangles show the quarters, and the blue bars are the real monthly PCE.
Using the "two-month method" for estimating Q4 PCE growth gives an estimate of just under 1%. However - note that PCE in August was distorted by the cash-for-clunkers program (and that impacts the two-month method). So my guess is PCE growth in Q4 will be around 1.7% or a contribution to GDP of 1.2% or so. (less than the growth in Q3).
As I've noted, residential investment has been moving sideways, although that will show up more in Q1 2010 than in Q4. So we can add in a positive contributions from net exports, some increase in residential investment (although smaller than in Q3), an increase in equipment and software investment - and subtract out investment in non-residential structures - and Q4 should look pretty healthy.
In a reserach note this week, Ed McKelvey at Goldman Sachs called the 2nd half "ho-hum":
"At a time of the year when ho-ho-ho is the catchword, the first six months of the US economic recovery look distinctly ho-hum following the latest reports. ... Although we continue to estimate a 4% growth rate for the fourth quarter, with upside risk to that figure, the composition of this growth is not strong. Almost half of it comes from a sharp slowing in the rate at which inventories are being drawn down ..."
 And it is probably a good time to repeat this graph from economy.com's Mark Zandi suggesting the greatest impact from the stimulus package is now behind us.
This suggests that all of the growth in Q3 was due to the stimulus package (and then some), and the impact is now waning - only 2% in Q4, and 1.5% in Q1 2010 - and then the impact on GDP growth will be negative in the 2nd half of 2010.
As "ho-hum" as the 2nd half of 2009 was, I expect GDP growth to be more sluggish in 2010 for the following reasons:
So I still think GDP growth will be sluggish in 2010, with downside risks.
Note: There are several upside and downside risks to this view.
Wednesday, December 23, 2009
November PCE and Saving Rate
by Calculated Risk on 12/23/2009 08:30:00 AM
From the BEA: Personal Income and Outlays, November 2009
Personal income increased $49.7 billion, or 0.4 percent, and disposable personal income (DPI) increased $54.1 billion, or 0.5 percent, in November, according to the Bureau of Economic Analysis. Personal consumption expenditures (PCE) increased $47.9 billion, or 0.5 percent.
...
Real PCE -- PCE adjusted to remove price changes -- increased 0.2 percent in November, compared with an increase of 0.4 percent in October.
...
Personal saving -- DPI less personal outlays -- was $525.1 billion in November, compared with $516.7 billion in October. Personal saving as a percentage of disposable personal income was 4.7 percent in November, the same as in October.
 Click on graph for large image.
This graph shows the saving rate starting in 1959 (using a three month centered average for smoothing) through the November Personal Income report. The saving rate was 4.7% in November.
I expect the saving rate to continue to rise - possibly to 8% or more - slowing the growth in PCE.
The following graph shows real Personal Consumption Expenditures (PCE) through November (2005 dollars). Note that the y-axis doesn't start at zero to better show the change.
The quarterly change in PCE is based on the change from the average in one quarter, compared to the average of the preceding quarter.The colored rectangles show the quarters, and the blue bars are the real monthly PCE.
Using the two-month method for estimating Q4 PCE growth gives an estimate of just under 1%. However - note that PCE in August was distorted by the cash-for-clunkers program. So my guess is PCE growth in Q4 will be around 1.7%.
Thursday, October 29, 2009
Random Thoughts on the Q3 GDP Report
by Calculated Risk on 10/29/2009 07:29:00 PM
After the Q1 GDP report was released, I wrote: GDP Report: The Good News. The headline number in Q1 was ugly, but there was a clear shift in the negative GDP contributions from leading sectors to lagging sectors.
Here is a repeat of the table from that earlier post showing a simplified typical temporal order for emerging from a recession:
| During Recession | Lags End of Recession | Significantly Lags End of Recession | |
| Residential Investment | Investment, Equipment & Software | Investment, non-residential Structures | |
| PCE | Unemployment(1) | ||
(1) In recent recessions, unemployment significantly lagged the end of the recession. That is very likely this time too.
Now look at the Q3 GDP report from leading to lagging sectors:
This is exactly what I'd expect a recovery to look like.
Unfortunately ... the two leading sectors, residential investment (RI) and personal consumption expenditures (PCE), will both be under pressure for some time. The Census Bureau report this morning showed that there are still far too many excess housing units (homes and rental units) available. There cannot be a sustained recovery in RI without a boom in new home sales and housing starts, and it is difficult to imagine a boom in new home sales with the large overhang of housing units.
It takes household formation to reduce the excess inventory, and household formation requires job creation so that individuals and families will feel more confident and move out of their parent's basements. Some day there will be a boom in household formation, once job creation returns, but usually the first jobs in a recovery are from RI and PCE - so the economy is in sort of a circular trap.
That is why we need policies aimed at job creation and household formation. As housing economist Tom Lawler wrote today in a note to clients: "policies that move renter households into owned homes but that don't stimulate household formations MAKE MATTERS WORSE!"
And the other leading sector, PCE, is also under pressure. The personal saving rate declined in Q3 to 3.3%, but the decline was probably temporary. I expect the saving rate to increase over the next year or two to around 8% - as households repair their balance sheets - and that will be a constant drag on PCE.
I expect Q4 GDP to be similar to Q3, however I think growth in 2010 will be sluggish - with downside risks. I think RI and PCE will be sluggish in 2010, and the stimulus will fade (and become a drag in the 2nd half of 2010).
Here is a look at investment:
 Click on graph for larger image in new window.
Residential investment (RI) had declined for 14 consecutive quarters, and the increase in Q3 2009 was the first since 2005.
This puts RI as a percent of GDP at 2.5%, just barely above the record low - since WWII - set last quarter.
 The second graph shows non-residential investment as a percent of GDP.
Business investment in equipment and software increased 1.1% (annualized), breaking a streak of 6 consecutive quarterly declines.
Investment in non-residential structures was only off 9.0% (annualized) and will probably be revised down (this happened last quarter). I expect non-residential investment in structures to decline sharply over the next several quarters. In previous downturns the economy recovered long before nonresidential investment in structures recovered - and that will probably be true again this time.
When the supplemental data is released, I'll post graphs of investment in retail, offices, and hotels, and a breakdown of residential investment.
Some possibly interesting notes:


