 RSS Feed
 by Calculated Risk on 5/24/2011 10:00:00 AM
Showing posts with label New Home Sales. Show all posts
Showing posts with label New Home Sales. Show all posts
Tuesday, May 24, 2011
New Home Sales in April at 323 Thousand SAAR, Ties Record low for April
The Census Bureau reports New Home Sales in April were at a seasonally adjusted annual rate (SAAR) of 323 thousand. This was up from a revised 301 thousand in March (revised from 300 thousand).
 Click on graph for larger image in graph gallery.
The first graph shows New Home Sales vs. recessions since 1963. The dashed line is the current sales rate.
Sales of new one-family houses in April 2011 were at a seasonally adjusted annual rate of 323,000 ... This is 7.3 percent (±16.6%)* above the revised March rate of 301,000, but is 23.1 percent (±9.7%) below the April 2010 estimate of 420,000.And a long term graph for New Home Months of Supply:
 Months of supply decreased to 6.5 in April from 7.2 months in March. The all time record was 12.1 months of supply in January 2009. This is still higher than normal (less than 6 months supply is normal).
The seasonally adjusted estimate of new houses for sale at the end of April was 175,000. This represents a supply of 6.5 months at the current sales rate.On inventory, according to the Census Bureau:
"A house is considered for sale when a permit to build has been issued in permit-issuing places or work has begun on the footings or foundation in nonpermit areas and a sales contract has not been signed nor a deposit accepted."Starting in 1973 the Census Bureau broke this down into three categories: Not Started, Under Construction, and Completed.
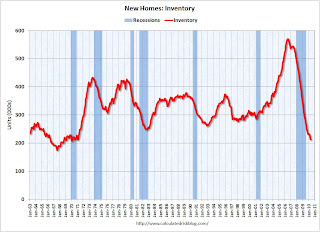
 This graph shows the three categories of inventory starting in 1973.
The inventory of completed homes for sale fell to 67,000 units in April. The combined total of completed and under construction is at the lowest level since this series started.
 The last graph shows sales NSA (monthly sales, not seasonally adjusted annual rate).
In April 2011 (red column), 32 thousand new homes were sold (NSA). This ties the record low for the month of April.
The record low for April was 32 thousand in both 1982 and 2009 - and now 2011. The high was 116 thousand in 2005.
Although above the consensus forecast of 300 thousand, this ties the record low for April - and new home sales have averaged only 298 thousand SAAR over the last 12 months ... moving sideways at a very low level.
Wednesday, March 23, 2011
New Home Sales Fall to Record Low in February
by Calculated Risk on 3/23/2011 10:00:00 AM
The Census Bureau reports New Home Sales in February were at a seasonally adjusted annual rate (SAAR) of 250 thousand. This was down from a revised 301 thousand in January.
 Click on graph for larger image in graph gallery.
The first graph shows New Home Sales vs. recessions since 1963. The dashed line is the current sales rate.
Sales of new single-family houses in February 2011 were at a seasonally adjusted annual rate of 250,000 ... This is 16 9 percent 16.9 (±19.1%)* below the revised January rate of 301,000 and is 28.0 percent (±14.8%) below the February 2010 estimate of 347,000.And a long term graph for New Home Months of Supply:
 Months of supply increased to 8.9 in February from 7.4 months in January. The all time record was 12.1 months of supply in January 2009. This is very high (less than 6 months supply is normal).
The seasonally adjusted estimate of new houses for sale at the end of February was 186,000. This represents a supply of 8.9 months at the current sales rate.On inventory, according to the Census Bureau:
"A house is considered for sale when a permit to build has been issued in permit-issuing places or work has begun on the footings or foundation in nonpermit areas and a sales contract has not been signed nor a deposit accepted."Starting in 1973 the Census Bureau broke this down into three categories: Not Started, Under Construction, and Completed.
 This graph shows the three categories of inventory starting in 1973.
The inventory of completed homes for sale fell to 76,000 units in February. The combined total of completed and under construction is at the lowest level since this series started.
 The last graph shows sales NSA (monthly sales, not seasonally adjusted annual rate).
In February 2010 (red column), 19 thousand new homes were sold (NSA). This is a new record low for the month of February.
The previous record low for February was 27 thousand in 2010. The high was 109 thousand in 2005.
This was a new record low sales rate and well below the consensus forecast of 290 thousand homes sold (SAAR). Another very weak report ...
Thursday, February 24, 2011
New Home Sales decrease in January
by Calculated Risk on 2/24/2011 10:00:00 AM
The Census Bureau reports New Home Sales in January were at a seasonally adjusted annual rate (SAAR) of 284 thousand. This is down from a revised 325 thousand in December.
 Click on graph for larger image in new window.
The first graph shows New Home Sales vs. recessions since 1963. The dashed line is the current sales rate.
Sales of new single-family houses in January 2011 were at a seasonally adjusted annual rate of 284,000 ... This is 12 6 12.6 percent (±11.2%) below the revised December rate of 325,000 and is 18.6 percent (±15.4%) below the January 2010 estimate of 349,000.And a long term graph for New Home Months of Supply:
 Months of supply increased to 7.9 in January from 7.0 months in December. The all time record was 12.1 months of supply in January 2009. This is still high (less than 6 months supply is normal).
The seasonally adjusted estimate of new houses for sale at the end of January was 188,000. This represents a supply of 7.9 months at the current sales rate.On inventory, according to the Census Bureau:
"A house is considered for sale when a permit to build has been issued in permit-issuing places or work has begun on the footings or foundation in nonpermit areas and a sales contract has not been signed nor a deposit accepted."Starting in 1973 the Census Bureau broke this down into three categories: Not Started, Under Construction, and Completed.
 This graph shows the three categories of inventory starting in 1973.
The inventory of completed homes for sale fell to 78,000 units in January. And the combined total of completed and under construction is at the lowest level since this series started.
This is the "good" news - in most areas the 'completed' and 'under construction' inventory of new homes is fairly lean.
 The last graph shows sales NSA (monthly sales, not seasonally adjusted annual rate).
In January 2010 (red column), 19 thousand new homes were sold (NSA). This is a new record low for the month of January.
The previous record low for January was 24 thousand in 2009 and 2010.
This was below the consensus forecast of 310 thousand homes sold (SAAR).
New home sales have averaged 293 thousand per month (annual rate) over the last nine months - all below the previous record low. Another very weak report ...
Wednesday, January 26, 2011
New Home Sales increase in December
by Calculated Risk on 1/26/2011 10:00:00 AM
The Census Bureau reports New Home Sales in December were at a seasonally adjusted annual rate (SAAR) of 329 thousand. This is up from a revised 280 thousand in November.
 Click on graph for larger image in new window.
The first graph shows monthly new home sales (NSA - Not Seasonally Adjusted or annualized).
Note the Red columns for 2010. In December 2010, 22 thousand new homes were sold (NSA). This is a new record low for the month of December.
The previous record low for December was 23 thousand in 1966; the record high was 87 thousand in December 2005.
 The second graph shows New Home Sales vs. recessions since 1963. The dashed line is the current sales rate.
Sales of new single-family houses in December 2010 were at a seasonally adjusted annual rate of 329,000 ... This is 17.5 percent (±17.7%)* above the revised November rate of 280,000, but is 7.6 percent (±17.0%)* below the December 2009 estimate of 356,000.And another long term graph - this one for New Home Months of Supply.
 Months of supply decreased to 6.9 in December from 8.4 in November. The all time record was 12.1 months of supply in January 2009. This is still high (less than 6 months supply is normal).
The seasonally adjusted estimate of new houses for sale at the end of December was 190,000. This represents a supply of 6.9 months at the current sales rate.
 The final graph shows new home inventory.
 The 329 thousand annual sales rate for December is still very low, and this was just the weakest December on record. This was above the consensus forecast of 300 thousand homes sold (SAAR).
It says something when sales increase and are still below the previous record lows for all years prior to 2010. New Home sales are still bouncing along the bottom - the good news is inventory is still declining.
Thursday, December 23, 2010
New Home Sales weak in November
by Calculated Risk on 12/23/2010 10:00:00 AM
The Census Bureau reports New Home Sales in November were at a seasonally adjusted annual rate (SAAR) of 290 thousand. This is up from a revised 275 thousand in October.
 Click on graph for larger image in new window.
The first graph shows monthly new home sales (NSA - Not Seasonally Adjusted or annualized).
Note the Red columns for 2010. In November 2010, 21 thousand new homes were sold (NSA). This is a new record low for November.
The previous record low for the month of November was 26 thousand in 1966 and 2009; the record high was 86 thousand in November 2005.
 The second graph shows New Home Sales vs. recessions since 1963. The dashed line is the current sales rate.
Sales of new single-family houses in November 2010 were at a seasonally adjusted annual rate of 290,000 ... This is 5.5 percent (±16.2%)* above the revised October rate of 275,000, but is 21.2 percent (±13.3%) below the November 2009 estimate of 368,000And another long term graph - this one for New Home Months of Supply.
 Months of supply decreased to 8.2 in November from 8.8 in October. The all time record was 12.4 months of supply in January 2009. This is still high (less than 6 months supply is normal).
The seasonally adjusted estimate of new houses for sale at the end of November was 197,000. This represents a supply of 8.2 months at the current sales rate.
 The final graph shows new home inventory.
 The 290 thousand annual sales rate for November is just above the all time record low in August (274 thousand). This was the weakest November on record and below the consensus forecast of 300 thousand.
This was another very weak report.
Wednesday, November 24, 2010
New Home Sales decline in October
by Calculated Risk on 11/24/2010 10:00:00 AM
The Census Bureau reports New Home Sales in October were at a seasonally adjusted annual rate (SAAR) of 283 thousand. This is down from 308 thousand in September.
 Click on graph for larger image in new window.
The first graph shows monthly new home sales (NSA - Not Seasonally Adjusted or annualized).
Note the Red columns for 2010. In October 2010, 23 thousand new homes were sold (NSA). This is a new record low for October.
The previous record low for the month of October was 29 thousand in 1981; the record high was 105 thousand in October 2005.
 The second graph shows New Home Sales vs. recessions for the last 47 years. The dashed line is the current sales rate.
Sales of new single-family houses in October 2010 were at a seasonally adjusted annual rate of 283,000, according to estimates released jointly today by the U.S. Census Bureau and the Department of Housing and Urban Development. This is 8.1 percent (±16.1%)* below the revised September rate of 308,000 and is 28.5 percent (±12.6%) below the October 2009 estimate of 396,000.And another long term graph - this one for New Home Months of Supply.
 Months of supply increased to 8.6 in October from 7.9 in September. The all time record was 12.4 months of supply in January 2009. This is still high (less than 6 months supply is normal).
The seasonally adjusted estimate of new houses for sale at the end of October was 202,000. This represents a supply of 8.6 months at the current sales rate.
 The final graph shows new home inventory.
 The 283 thousand annual sales rate for October is just above the all time record low in August (275 thousand). This was the weakest October on record and well below the consensus forecast of 314 thousand.
This was another very weak report.
Wednesday, October 27, 2010
New Home Sales increased slightly in September, still near record low
by Calculated Risk on 10/27/2010 10:00:00 AM
The Census Bureau reports New Home Sales in September were at a seasonally adjusted annual rate (SAAR) of 307 thousand. This is slightly higher than in August (288 thousand SAAR).
 Click on graph for larger image in new window.
The first graph shows monthly new home sales (NSA - Not Seasonally Adjusted or annualized).
Note the Red columns for 2010. In September 2010, 24 thousand new homes were sold (NSA). This is a new record low for September.
The previous record low for the month of September was 28 thousand in 1981; the record high was 95 thousand in September 2005.
 The second graph shows New Home Sales vs. recessions for the last 47 years. The dashed line is the current sales rate.
Sales of new single-family houses in September 2010 were at a seasonally adjusted annual rate of 307,000, according to estimates released jointly today by the U.S. Census Bureau and the Department of Housing and Urban Development. This is 6.6 percent (±16.9%)* above the revised August rate of 288,000, but is 21.5 percent (±13.3%) below the September 2009 estimate of 391,000.And another long term graph - this one for New Home Months of Supply.
 Months of supply decreased to 8.0 in September from 8.6 in August. The all time record was 12.4 months of supply in January 2009. This is still high (less than 6 months supply is normal).
The seasonally adjusted estimate of new houses for sale at the end of September was 204,000. This represents a supply of 8.0 months at the current sales rate.
 The final graph shows new home inventory.
 The 307 thousand annual sales rate for September is just above the all time record low in May (282 thousand). This was the weakest September on record.
New home sales are important for the economy and jobs - and this indicates that residential investment will be a sharp drag on GDP in Q3.
Friday, September 24, 2010
New Home Sales: Unchanged from July, Worst August on Record
by Calculated Risk on 9/24/2010 10:00:00 AM
NOTE: My host (Google) is not uploading images this morning - I'm working on a fix. You can follow the links to the images.
The Census Bureau reports New Home Sales in August were at a seasonally adjusted annual rate (SAAR) of 288 thousand. This is unchanged from July.
Here is the graph for New Home Sales NSA.
The first graph shows monthly new home sales (NSA - Not Seasonally Adjusted or annualized).
Note the Red columns for 2010. In August 2010, 25 thousand new homes were sold (NSA). This is a new record low for August.
The previous record low for the month of August was 34 thousand in 1981; the record high was 110 thousand in August 2005.
The second graph shows New Home Sales vs. recessions for the last 47 years.
Sales of new single-family houses in August 2010 were at a seasonally adjusted annual rate of 288,000, according to estimates released jointly today by the U.S. Census Bureau and the Department of Housing and Urban Development. This is unchanged (±16.7%)* from the revised July rate of 288,000 and is 28.9 percent (±11.0%) below the August 2009 estimate of 405,000.And another long term graph - this one for New Home Months of Supply.
The third graph is for Months of Supply
Months of supply decreased to 8.6 in August from 8.7 in July. The all time record was 12.4 months of supply in January 2009. This is still very high (less than 6 months supply is normal).
The seasonally adjusted estimate of new houses for sale at the end of August was 206,000. This represents a supply of 8.6 months at the current sales rate.The final graph shows new home inventory.
The 288 thousand annual sales rate for August is just above the all time record low in May (282 thousand). This was another very weak report. New home sales are important for the economy and jobs - and this indicates that residential investment will be a sharp drag on GDP in Q3.
Note: Sorry for the technical problems.
Wednesday, August 25, 2010
New Home Sales decline to Record Low in July
by Calculated Risk on 8/25/2010 10:00:00 AM
The Census Bureau reports New Home Sales in July were at a seasonally adjusted annual rate (SAAR) of 276 thousand. This is an decrease from the record low of 315 thousand in June (revised down from 330 thousand).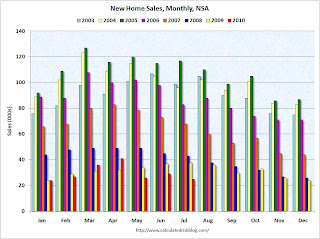 Click on graph for larger image in new window.
The first graph shows monthly new home sales (NSA - Not Seasonally Adjusted or annualized).
Note the Red columns for 2010. In July 2010, 25 thousand new homes were sold (NSA). This is a new record low for July.
The previous record low for the month of July was 31 thousand in 1982; the record high was 117 thousand in July 2005. The second graph shows New Home Sales vs. recessions for the last 47 years.
Sales of new single-family houses in July 2010 were at a seasonally adjusted annual rate of 276,000, according to estimates released jointly today by the U.S. Census Bureau and the Department of Housing and Urban Development. This is 12.4 percent (±10.8%) below the revised June rate of 315,000 and is 32.4 percent (±8.7%) below the July 2009 estimate of 408,000.And another long term graph - this one for New Home Months of Supply.
 Months of supply increased to 9.1 in July from 8.0 in June. The all time record was 12.4 months of supply in January 2009. This is still very high (less than 6 months supply is normal).
The seasonally adjusted estimate of new houses for sale at the end of July was 210,000. This represents a supply of 9.1 months at the current sales rate.
 The final graph shows new home inventory.
 The 276 thousand annual sales rate for July is the all time record low (May was revised up a little). This was another very weak report. New home sales are important for the economy and jobs - and this indicates that residential investment will be a sharp drag on GDP in Q3.
Wednesday, July 28, 2010
More Builder Evidence of Tax Credit Goose, Post-Credit Bust
by Calculated Risk on 7/28/2010 06:04:00 PM
CR Note: This is from housing economist Tom Lawler.
Meritage Homes, the 11th largest US home builder in 2009, reported that net home orders in the quarter ended 6/30/10 totaled 900, down 21.5% from the comparable quarter of 2009. Home deliveries, in contrast, jumped by 35.6% from a year ago to 1,207, reflecting buyers’ (and the builders) rush to close prior to the expected 6/30 closing date deadline for the federal home buyer tax credit. Compared to the previous quarter, net orders fell 15.4% while home closings surged by 49.4%. As a result, the company order backlog as of 6/30/10 fell to 1,044, down 22.7% from 3/31/10 and down 34.4% from a year ago.
Company officials were reportedly “surprised” by the extent of the post-tax-credit slowdown, and some analysts were a little spooked by the company’s move to increase active communities this year in California, Arizona, and Florida, while reducing its footprint in “lower-margin” Texas markets, as well as its recent acquisitions of land/lots. Meritage noted that margins on its newer communities have been higher than on older communities, in part because it purchased “deeply discounted” lots – especially in CA/AZ/FL. The company also said that it had “reduced our incentives while maintaining prices,” though whether it can do so in the post-tax-credit world remained unclear. Meritage, btw, appears to be one of those builders cited in yesterday’s WSJ article that may increase building in troubled markets that have not fully recovered yet because of land/lot acquisitions. (“Housing Glut is Likely to Build,”, July 27th, p. A2. This article, by the way, vastly overstates the potential for an increase in housing production related to SOME builders buying land/lots, often mainly either from other troubled builders or from banks. It also ignored surveys of builders indicating that most have dramatically cut their building production plans following the post-tax-credit plunge in sales, and ignored the sharp drop in SF building permits in May and June!!!)
M/I Homes, the 16th largest US home builder in 2009, reported that net home orders in the quarter ended 6/30/10 totaled 602, down 20.7% from the comparable quarter of 2009. Home deliveries last quarter totaled 790, up 60.6% form a year ago, as buyers (and the builder) rushed to close prior to the expected 6/30 closing date deadline for the federal home buyer tax credit. Compared to the previous quarter, net orders in the latest quarter fell by 21.3% while home deliveries surged by 64.9%. As a result, the company’s order backlog fell to 748 on 6/30/10, down 20.1% from 3/31/10 and down 32.4% from a year ago.
M/I CEO Robert Schottenstein noted that “coincident with the expiration of the tax credit on April 30, 2010 (for contract signings), we experienced a noticeable decline in our sales activity for May and June, resulting in a 21% decline in sales for the quarter” (implying BIG declines in May and June!) – breaking the company's previous string of six consecutive YOY gains in net orders.
At the risk of repeating myself (yet again!!!), the incoming data on home builders highlight that new home sales based on settlements actually surged in Q2/10 vs. Q1/10, even though contracts signed on a seasonally adjusted basis declined. Similarly, existing home sales closed in Q2 increased from Q1, even though new pending home sales declined. So for you “home data folks” who I guess because of ignorance add closed existing home sales to new SF home sales based on contracts signed/deposits taken (as reported by Census) to measure total home sales – stop it, it’s just wrong, and doing so makes you look like a fool!
CR Note: This was from Tom Lawler.
Monday, July 26, 2010
New Home Sales: Worst June on Record
by Calculated Risk on 7/26/2010 10:00:00 AM
Ignore all the month to previous month comparisons. May was revised down sharply and that makes the increase look significant. Here is the bottom line: this was the worst June for new home sales on record.
The Census Bureau reports New Home Sales in June were at a seasonally adjusted annual rate (SAAR) of 330 thousand. This is an increase from the record low of 267 thousand in May (revised from 300 thousand). Click on graph for larger image in new window.
The first graph shows monthly new home sales (NSA - Not Seasonally Adjusted).
Note the Red columns for 2010. In June 2010, 30 thousand new homes were sold (NSA). This is a new record low for June.
The previous record low for the month of June was 34 thousand in 1982; the record high was 115 thousand in June 2005.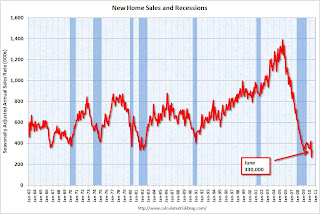 The second graph shows New Home Sales vs. recessions for the last 47 years.
Sales of new single-family houses in June 2010 were at a seasonally adjusted annual rate of 330,000 ... This is 23.6 percent (±15.3%) above the revised May rate of 267,000, but is 16.7 percent (±10.9%) below the June 2009 estimate of 396,000.And another long term graph - this one for New Home Months of Supply.
 Months of supply decreased to 7.6 in June from a revised 9.6 in May (revised from 8.5). The all time record was 12.4 months of supply in January 2009. This is still very high (less than 6 months supply is normal).
 The seasonally adjusted estimate of new houses for sale at the end of June was 210,000. This represents a supply of 7.6 months at the current sales rate.
 The final graph shows new home inventory.
 The 267 thousand annual sales rate for May is the all time record. This is a very sharp downward revision.
The 330 thousand in June is the worst June on record. With all the gyrations, it is difficult to see what is happening month to month, but overall this was a very weak report.
Wednesday, June 23, 2010
New Home Sales collapse to Record Low in May
by Calculated Risk on 6/23/2010 10:00:00 AM
The Census Bureau reports New Home Sales in May were at a seasonally adjusted annual rate (SAAR) of 300 thousand. This is a sharp decrease from the revised rate of 446 thousand in April (revised from 504 thousand). Click on graph for larger image in new window.
The first graph shows monthly new home sales (NSA - Not Seasonally Adjusted).
Note the Red columns for 2010. In May 2010, 28 thousand new homes were sold (NSA). This is a new record low.
The previous record low for the month of May was 34 thousand in 2009; the record high was 120 thousand in May 2005. The second graph shows New Home Sales vs. recessions for the last 45 years.
Sales of new single-family houses in May 2010 were at a seasonally adjusted annual rate of 300,000 ... This is 32.7 percent (±9.9%) below the revised April rate of 446,000 and is 18.3 percent (±13.0%) below the May 2009 estimate of 367,000.And another long term graph - this one for New Home Months of Supply.
 Months of supply increased to 8.5 in May from 5.8 April. The all time record was 12.4 months of supply in January 2009. Since the sales rate declined sharply, the months of supply increased - this is still very high (less than 6 months supply is normal).
 The seasonally adjusted estimate of new houses for sale at the end of May was 213,000. This represents a supply of 8.5 months at the current sales rate.
 The final graph shows new home inventory.
 New home sales are counted when the contract is signed, so the tax credit related pickup in sales activity happened in April. This pulled demand forward, and April was probably the peak for new home sales this year.
The 300 thousand annual sales rate is a new all time record low. The previous record low annual sales rate was 338 thousand in September 1981.
Wednesday, June 16, 2010
Toll Brothers: Demand Choppy, Sales Down
by Calculated Risk on 6/16/2010 06:19:00 PM
Just a few weeks ago, new Toll CEO-designate Doug Yearley, Jr. noted:
"With demand increasing in many areas, we are very focused on growth."Uh, nevermind ...
From Toll today (ht Brian):
Joel H. Rassman, chief financial officer, stated: ... "While much of the attention surrounding the recent decline in housing indicators has focused on the expiration of the housing tax credit, we believe our customers' buying decisions have been driven more by consumer confidence than by the tax credit. As we noted in our second-quarter earnings press release of May 26, 2010, we believe the volatility in the financial markets and the high U.S. unemployment rate continue to weigh on the nation's psyche. Additionally, in the past several weeks, concerns about the financial crisis in Europe and escalating regional political tensions, coupled with worries about the oil spill in the Gulf of Mexico and its effects on the economy and the environment have negatively impacted the outlook of American consumers.Slightly ahead on a community bases - with 21% fewer communities. Do the math - they are running close to 20% below last year. And 40% below last year over the last three weeks (20% fewer deposits and 21% fewer communities).
"In the three weeks following our earnings conference call on May 26, 2010, our per-community deposits have been running about 20% behind the comparable period in last year's third quarter and our per-community traffic has been running about 3% behind. Thus, for the first six weeks of our FY 2010 third quarter beginning May 1, 2010, we are slightly ahead of last year's third-quarter pace of contracts signed on a per community basis. However, we have 21% fewer communities than one year ago.
"Although demand in recent weeks has been quite choppy, in general, we continue to believe that the housing market has emerged from its darkest period of late 2008 through early 2009. ... At the moment, consumers view the economic glass as half empty: volatile financial markets, global deficit concerns and the oil spill in the Gulf are all contributing to this gloom. We believe that once the employment picture begins to brighten and the economy stabilizes, consumer confidence will improve and the housing market should begin a steadier recovery."And there you have what might be the popular Q2 meme: blame the oil spill for poor results.
Wednesday, May 26, 2010
New Home Prices: Median Lowest since 2003
by Calculated Risk on 5/26/2010 12:40:00 PM
As part of the new home sales report, the Census Bureau reported that the median price for new homes fell to the lowest level since 2003. Click on graph for larger image in new window.
This graph shows the median and average new home price. It appears the builders sold at a lower price point in April, and that helped boost sales.
This makes sense since many of the buyers were trying to take advantage of the housing tax credit (and probably using FHA insurance). Since the modification programs and the delays in foreclosure limited the number of distressed sales - many buyers at the low end found buying a new home easier than buying an existing home. The second graph shows the percent of new home sales by price.
Half of all home sales were under $200K in April - tying Jan 2009 as the highest level since 2003 (there was panic selling in Jan 2009).
And excluding Jan 2009, this is the highest percentage under $300K since May 2003 - and the highest under 400K since April 2003.
To summarize: the homebuilders sold 16,000 more units in April 2010 than in April 2009 - probably because of the tax credit, and at lower prices - and now sales will decline sharply in May probably close to the 34,000 units sold in May 2009.
New Home Sales increase to 504K Annual Rate in April
by Calculated Risk on 5/26/2010 10:00:00 AM
The Census Bureau reports New Home Sales in April were at a seasonally adjusted annual rate (SAAR) of 504 thousand. This is an increase from the revised rate of 439 thousand in March (revised from 411 thousand). Click on graph for larger image in new window.
The first graph shows monthly new home sales (NSA - Not Seasonally Adjusted).
Note the Red columns for 2010. In April 2010, 48 thousand new homes were sold (NSA).
The record low for the month of April was 32 thousand in 1982 and 2009; the record high was 116 thousand in 2005. The second graph shows New Home Sales vs. recessions for the last 45 years.
Sales of new one-family houses in April 2010 were at a seasonally adjusted annual rate of 504,000 ... This is 14.8 percent (±19.5%)* above the revised March rate of 439,000 and is 47.8 percent (±26.0%) above the April 2009 estimate of 341,000.And another long term graph - this one for New Home Months of Supply.
 Months of supply declined to 5.0 in April from 6.2 in March. This is significantly below the all time record of 12.4 months of supply set in January 2009. This would be about normal, except the months of supply will increase next month when sales decline.
The seasonally adjusted estimate of new houses for sale at the end of April was 211,000. This represents a supply of 5.0 months at the current sales rate.
 The final graph shows new home inventory.
 New home sales are counted when the contract is signed, so this pickup in activity is related to the tax credit.
For new home sales, the tax credit selling ended in April and sales will probably decline sharply in May.
Tuesday, May 18, 2010
Q1: Quarterly Housing Starts and New Home Sales
by Calculated Risk on 5/18/2010 11:27:00 AM
This morning the Census Bureau released the "Quarterly Starts and Completions by Purpose and Design" report for Q1 2010.  Click on graph for larger image in new window.
The first graph shows the NSA quarterly starts intent for four categories since 1975: single family built for sale, owner built (includes contractor built for owner), starts built for rent, and condos built for sale.
Condo starts in Q1 were just above the all time record low last quarter (4,000 vs 3,000 in Q4 2009).
Units built for rent set an all time record low in Q1 (19,000 units in Q1 2010 compared to the previous record low of 20,000 units in Q4 2009). This year a record low number of rental units will be built, and that is one reason the rental vacancy rate should continue to decline (household formation should be significantly higher than the increase in housing units in 2010).
Owner built units are just above the record low set in Q1 2009 (25,000 units in Q1 2010 compared to 24,000 units in Q1 2009).
And the largest category - starts of single family units, built for sale - increased to 86,000 in Q1.
With starts so low in every category, the number of units added to the housing stock in 2010 will be at a record low - and that will help reduce the significant excess inventory of housing units.
Comparing Housing Starts and New Home Sales
Monthly housing starts (even single family starts) cannot be compared directly to new home sales, because the monthly housing starts report from the Census Bureau includes apartments, owner built units and condos that are not included in the new home sales report.
However it is possible to compare "Single Family Starts, Built for Sale" to New Home sales on a quarterly basis. This is not perfect because of reporting differences and changes in cancellation rate - but it is close. The quarterly report shows that there were 86,000 single family starts, built for sale, in Q1 2010, and that is the same as the 86,000 new homes sold for the same period. This data is Not Seasonally Adjusted (NSA).
This breaks a streak of 9 consecutive quarter with homebuilders selling more homes than they started.
Note: new home sales are reported when contracts are signed, so it is appropriate to compare sales to starts (as opposed to completions).  This graph provides a quarterly comparison of housing starts and new home sales. In 2005, and most of 2006, starts (blue) were higher than sales (red), and inventories of new homes increased. For the previous 9 quarters, starts were below sales – and new home inventories declined. In Q1 starts and sales were about the same. Historically builders sell more home in Q1 than they start, but they probably started more homes this year anticipating some extra sales in April related to the expiring tax credit.
Friday, April 23, 2010
Home Sales: Distressing Gap
by Calculated Risk on 4/23/2010 01:00:00 PM
First a comment on the seasonal adjustment ... on a Not Seasonally Adjusted (NSA) basis, the Census Bureau reported there were 38,000 new homes sold in March. That is up from 31,000 in March 2009.
Some (or all) of the increase was due to a one time event - the tax credit that expires in April. The Census Bureau doesn't know the number of homes sold due to the tax credit, so they report the Seasonally Adjusted Annual Rate (SAAR) assuming this is the underlying rate of sales. It isn't.
The April new home sales headline number will be distorted too, but the key is the actual underlying sales rate is much lower.
Note: remember the tax credit shows up in the new home sales numbers when the contract is signed (March and April), and in the existing home sales numbers when the transactions are closed (April through June).
The following graph shows existing home sales (left axis) and new home sales (right axis) through March. Click on graph for larger image in new window.
The initial gap was caused by the flood of distressed sales. This kept existing home sales elevated, and depressed new home sales since builders couldn't compete with the low prices of all the foreclosed properties.
The spike in existing home sales last year was due primarily to the first time homebuyer tax credit. Notice that there was also a bump last year in new home sales from the tax credit.
We are seeing another bump this year with the expiration of the extension of the tax credit.
The second graph shows the same information as a ratio - new home sales divided by existing home sales - through March 2010. The ratio increased because the tax credit impacts new home sales first. I suspect this ratio will be at or near the all time low later this year.
Eventually this ratio will return to the historical range of new home sales being around 15% to 20% of existing home sales. However it will probably take a number of years to return to a more normal market.


