 RSS Feed
 by Calculated Risk on 6/10/2010 11:59:00 AM
Showing posts with label Flow of Funds. Show all posts
Showing posts with label Flow of Funds. Show all posts
Thursday, June 10, 2010
Q1 Flow of Funds: Household Net Worth off $11.4 Trillion from Peak
The Federal Reserve released the Q1 2010 Flow of Funds report today: Flow of Funds.
According to the Fed, household net worth is now off $11.4 Trillion from the peak in 2007, but up $6.3 trillion from the trough in Q1 2009. A majority of the decline in net worth is from real estate assets with a loss of about $6.4 trillion in value from the peak. Stock market losses are still substantial too. Click on graph for larger image in new window.
This is the Households and Nonprofit net worth as a percent of GDP.
This includes real estate and financial assets (stocks, bonds, pension reserves, deposits, etc) net of liabilities (mostly mortgages). Note that this does NOT include public debt obligations.
Note that this ratio was relatively stable for almost 50 years, and then we saw the stock market and housing bubbles. This graph shows homeowner percent equity since 1952.
Household percent equity (as measured by the Fed) collapsed when house prices collapsed in 2007 and 2008.
In Q1 2010, household percent equity (of household real estate) was up to 38.2% from the all time low of 33.3% last year. The increase was due to both an increase in the value of household real estate and a $99 billion decline in mortgage debt.
Note: something less than one-third of households have no mortgage debt. So the approximately 50+ million households with mortgages have far less than 38.2% equity. The third graph shows household real estate assets and mortgage debt as a percent of GDP. Household assets as a percent of GDP decreased slightly in Q1 as the value of real estate assets declined slightly, and GDP increased.
Mortgage debt declined by $99 billion in Q1. Mortgage debt has now declined by $377 billion from the peak.
Thursday, March 11, 2010
Flow of Funds Report: Mortgage Debt Declines by $53Billion in Q4
by Calculated Risk on 3/11/2010 12:14:00 PM
Update: corrected mortgage debt amount.
The Federal Reserve released the Q4 2009 Flow of Funds report today: Flow of Funds.
According to the Fed, household net worth is now off $11.8 Trillion from the peak in 2007, but up $5.0 trillion from the trough last year. A majority of the decline in net worth is from real estate assets with a loss of about $7.0 trillion in value from the peak. Stock market losses are still substantial too. Click on graph for larger image in new window.
This is the Households and Nonprofit net worth as a percent of GDP.
This includes real estate and financial assets (stocks, bonds, pension reserves, deposits, etc) net of liabilities (mostly mortgages). Note that this does NOT include public debt obligations.
Note that this ratio was relatively stable for almost 50 years, and then we saw the stock market and housing bubbles. This graph shows homeowner percent equity since 1952.
Household percent equity (of household real estate) was up to 43.6% from the all time low of 40.8% last year. The increase was due to both an increase in the value of household real estate and a $72 billion decline in mortgage debt.
Note: something less than one-third of households have no mortgage debt. So the approximately 50+ million households with mortgages have far less than 43.6% equity. The third graph shows household real estate assets and mortgage debt as a percent of GDP. Household assets as a percent of GDP increased in Q3 because of an increase in real estate values.
Mortgage debt declined by $53 billion in Q4. Mortgage debt has now declined by $290 billion from the peak, but that seems insignificant compared to the $7 trillion decline in household real estate value.
Thursday, September 17, 2009
Fed: Household Net Worth Off $12.2 Trillion From Peak
by Calculated Risk on 9/17/2009 11:59:00 AM
The Fed released the Q2 2009 Flow of Funds report today: Flow of Funds.
According to the Fed, household net worth is now off $12.2 Trillion from the peak in 2007. Click on graph for larger image in new window.
This is the Households and Nonprofit net worth as a percent of GDP.
This includes real estate and financial assets (stocks, bonds, pension reserves, deposits, etc) net of liabilities (mostly mortgages). Note that this does NOT include public debt obligations.
According to the Fed, household net worth increased in Q2 mostly from increases in stock holdings - although the value of household real estate increased slightly too.
Note that this ratio was relatively stable for almost 50 years, and then ... bubbles! This graph shows homeowner percent equity since 1952.
Household percent equity (of household real estate) was up to 43% from the all time low last quarter of 41.9%. The increase was due to a slight increase in the value of household real estate and a decline in mortgage debt - and also a decline in overall GDP (so the ratio increases).
When prices were increasing dramatically, the percent homeowner equity was stable or declining because homeowners were extracting equity from their homes. Now, with prices falling, the percent homeowner equity has been cliff diving.
Note: approximately 31% of households do not have a mortgage. So the 50+ million households with mortgages have far less than 43% equity. The third graph shows household real estate assets and mortgage debt as a percent of GDP. Household assets as a percent of GDP increased slightly in Q2 - because of a slight increase in real estate values, and a decline in GDP.
Mortgage debt declined, but was flat as a percent of GDP in Q2 - since GDP declined too.
After a bubble, the value of assets decline, but most of the debt remains.
Thursday, March 12, 2009
Fed: Household Net Worth Cliff Dives in Q4
by Calculated Risk on 3/12/2009 12:13:00 PM
The Fed released the Q4 2008 Flow of Funds report today: Flow of Funds. Click on graph for larger image in new window.
This is the Households and Nonprofit Net Worth as a percent of GDP.
This includes real estate and financial assets (stocks, bonds, pension reserves, deposits, etc) net of liabilities (mostly mortgages).
This ratio was relatively stable for almost 50 years, and then ... bubbles!
Rex Nutting at MarketWatch has more: Household net worth plunges 18% in 2008
Hit by the double whammy of declining home prices and a falling stock market, U.S. households saw their net worth fall by $11.2 trillion, or 18%, to $51.5 trillion at the end of 2008, wiping out five years of gains ...Household percent equity was at an all time low of 43.0%.
 This graph shows homeowner percent equity since 1952.
 When prices were increasing dramatically, the percent homeowner equity was declining because homeowners were extracting equity from their homes. Now, with prices falling, the percent homeowner equity is Cliff Diving!
Note: approximately 31% of households do not have a mortgage. So the 50+ million households with mortgages have far less than 43.0% equity.

The third graph shows household real estate assets and mortgage debt as a percent of GDP. Household assets as a percent of GDP is now declining rapidly. Mortgage debt as a percent of GDP was up slightly in Q4, and is only declining slowly.
It's an old lesson: Assets values can fall quickly, but debt lingers!
Thursday, September 18, 2008
Fed: Household Percent Equity Declines
by Calculated Risk on 9/18/2008 03:03:00 PM
The Fed released the Q1 2008 Flow of Funds report today: Flow of Funds.
Household percent equity was at an all time low of 45.2%. Click on graph for larger image in new window.
This graph shows homeowner percent equity since 1952.
When prices were increasing dramatically in recent years, the percent homeowner equity was declining because homeowners were extracting equity from their homes. Now, with prices falling, the percent homeowner equity is declining even faster.
Note: approximately 31% of households do not have a mortgage. So the 50+ million households with mortgages have far less equity than 45.2%. The second graph shows household real estate assets and mortgage debt as a percent of GDP. Household assets as a percent of GDP is now declining. Mortgage debt as a percent of GDP has declined for the last two quarters.
More later ...
Thursday, June 05, 2008
Fed: Household Real Estate Assets Declined $431 Billion in Q1
by Calculated Risk on 6/05/2008 11:25:00 AM
The Fed released the Q1 2008 Flow of Funds report today: Flow of Funds.
The Fed report shows that household real estate assets decreased from $20.046 trillion in Q4 to $19.717 trillion in Q1 2008. That is a decline of $328.9 billion.
When we subtract out new single family structure investment and residential improvement, the value of existing household real estate assets declined by $431 Billion.
Household percent equity was at an all time low of 46.2%. Click on graph for larger image in new window.
This graph shows homeowner percent equity since 1952. Even though prices have risen dramatically in recent years, the percent homeowner equity has fallen significantly (because of mortgage equity extraction 'MEW'). With prices now falling - and expected to continue to fall - the percent homeowner equity will probably decline rapidly in the coming quarters.
Note: approximately 31% of household have no mortgage. So the 50+ milllion households with mortgage have far less equity than 46.2%. The second graph shows household real estate assets and mortgage debt as a percent of GDP. Household assets as a percent of GDP is now declining, although mortgage debt as a percent of GDP only decreased slightly in Q1.
More later ...
Thursday, March 06, 2008
Fed: Household Percent Equity Plummets in Q4
by Calculated Risk on 3/06/2008 12:27:00 PM
The Fed released the Q4 Flow of Funds report today: Flow of Funds.
The Fed report shows that household real estate assets decreased from $20.325 Trillion in Q3 to $20.155 Trillion in Q4. That is a decline of $170.2 billion.
When we subtract out new single family structure investment and residential improvement, the value of existing household real estate assets declined by $282 Billion.
The simple math: Decrease in household assets: $20,154.7 billion minus $20,324.9 billion equals minus $170.2 billion. Now subtract investment in new single family structures ($259.7 Billion Seasonally Adjusted Annual Rate) and improvements ($187.2 Billion SAAR). Note: to make it simple, divide the SAAR by 4.
Finally negative $170.2B minus $259.7/4 minus $187.2B/4 equals a decline in existing assets of $282 Billion.
Household percent equity was at an all time low of 47.8%. Click on graph for larger image.
This graph shows homeowner percent equity since 1952. Even though prices have risen dramatically in recent years, the percent homeowner equity has fallen significantly (because of mortgage equity extraction 'MEW'). With prices now falling - and expected to continue to fall - the percent homeowner equity will probably decline rapidly in the coming quarters.
Note: approximately 31% of household have no mortgage. So the 50+ milllion households with mortgage have far less equity than 47.8%. The second graph shows household real estate assets and mortgage debt as a percent of GDP. Household assets as a percent of GDP is now declining, although mortgage debt as a percent of GDP still increased slightly in Q4.
This is just the beginning. If house prices fall 20%, households will lose $4 trillion in equity. If they fall 30%, households will lose $6 trillion in equity.
Thursday, December 06, 2007
Fed: Existing Household Real Estate Assets Decline $67 Billion in Q3
by Calculated Risk on 12/06/2007 07:16:00 PM
Here is some more data from the Fed's Flow of Funds report.
The Fed report shows that household real estate assets increased from $20.94 Trillion in Q2 to $20.99 Trillion in Q3. However, when we subtract out new single family structure investment and residential improvement, the value of existing household real estate assets declined by $67 Billion.
The simple math: Increase in household assets: $20,991.18 Billion minus $20,937.62 Billion equals $53.56 Billion. Now subtract investment in new single family structures ($297.2 Billion Seasonally Adjusted Annual Rate) and improvements ($185.8 Billion SAAR). Note: to make it simple, divide the SAAR by 4.
Finally $53.56B minus $297.2B/4 minus $185.8B/4 equals a decline in existing assets of $67.2B. This was a quarterly price decline of about 0.3%, about the same as the OFHEO House Price index decline.
As mentioned earlier, household equity declined by $128 Billion in Q3.
Household debt increased by $182.1 Billion in Q3 (down from $213.6B in Q2, and up slightly from $181.48B in Q1 2007). The mortgage equity withdrawal numbers will probably still be fairly strong in Q3.
Household percent equity was at an all time low of 50.4%.
This graph shows homeowner percent equity since 1954. Even though prices have risen dramatically in recent years, the percent homeowner equity has fallen significantly (because of mortgage equity extraction 'MEW'). With prices now falling - and expected to continue to fall - the percent homeowner equity will probably decline rapidly in the coming quarters.
Also note that this percent equity includes all homeowners. Based on the methodology in this post, aggregate percent equity for households with a mortgage has fallen to 33% from 36% at the end of 2006.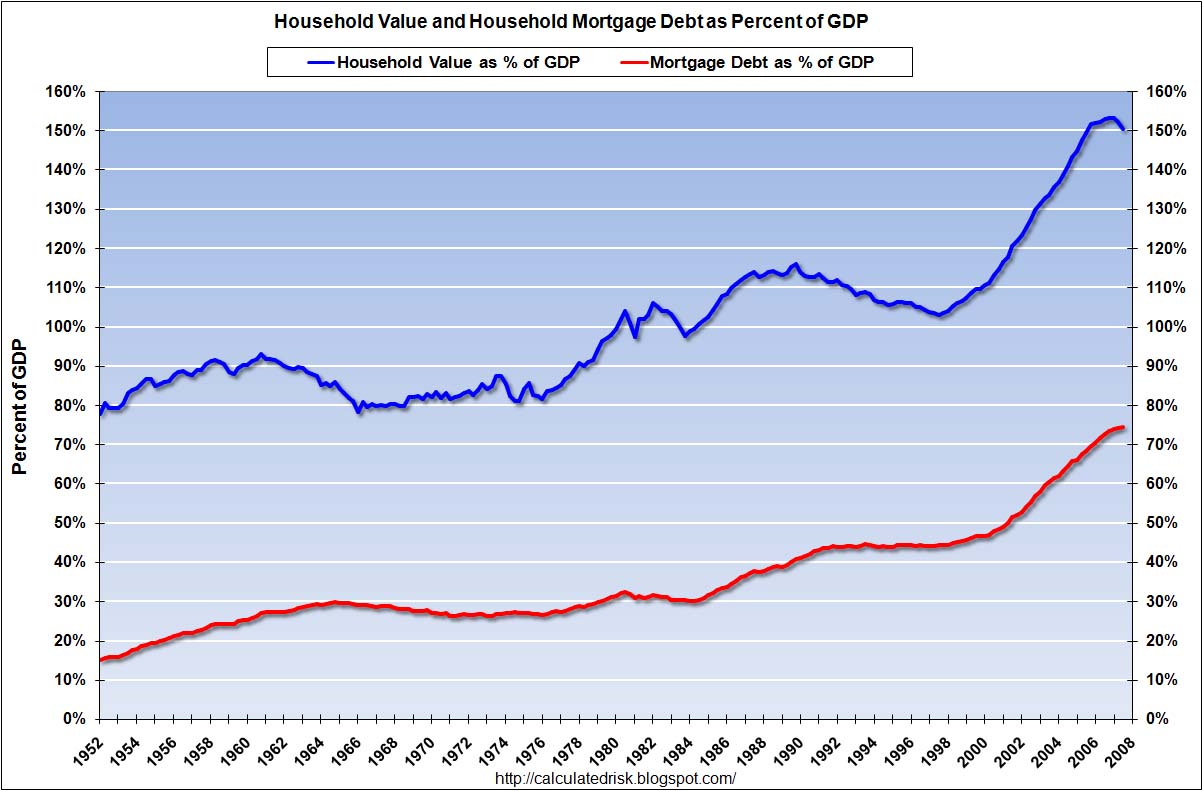
If Goldman Sachs and Moody's are correct and house prices fall 15% nationally (30% in some areas), the value of existing household real estate assets will fall by $3 Trillion over the next few years.
Fed: Homeowner Percent Equity Falls to Record Low
by Calculated Risk on 12/06/2007 12:14:00 PM
The Fed released the Q3 Flow of Funds report today.
Homeowner equity declined by $128 Billion in Q3 as appreciation slowed (why didn't assets decline?) and equity withdrawal was still strong.
Homeowner percent equity fell to a record low of 50.4% (this includes the almost 1/3 of homeowners with no mortgage). I'll have more this afternoon.
Monday, September 17, 2007
Fed Flow of Funds for Q2
by Calculated Risk on 9/17/2007 01:27:00 PM
The Federal Reserve released the Q2 Flow of Funds report today.
Household mortgage borrowing increased to $195.4 Billion in Q2 (up from $176.3B in Q1, and $178.6B in Q4 2006). The mortgage equity withdrawal numbers will probably show an increase in Q2, before plummeting in the current quarter.
The amount withdrawn from homes was more than total home values increased (including the addition of new homes), so the total homeowner equity fell for the first time since 1994. This was not due to falling prices, rather homeowner equity declined because of the large amount of equity extracted from homes in Q2.
Household percent equity was at an all time low of 51.7%. Click on graph for larger image.
This graph shows homeowner percent equity since 1954. Even though prices have risen dramatically in recent years, the percent homeowner equity has fallen significantly (because of mortgage equity extraction 'MEW'). With prices now falling - and expected to continue to fall - the percent homeowner equity will probably decline rapidly in the coming quarters.
For more, see Rex Nutting's article at MarketWatch: Homeowners' equity falls for 1st time in 13 years


