 RSS Feed
 by Calculated Risk on 4/20/2011 11:30:00 AM
Showing posts with label Existing Home Inventory. Show all posts
Showing posts with label Existing Home Inventory. Show all posts
Wednesday, April 20, 2011
Existing Home Inventory decreases 2.1% Year over Year
Earlier the NAR released the existing home sales data for March; here are a couple more graphs ...
The first graph shows the year-over-year (YoY) change in reported existing home inventory and months-of-supply. Inventory is not seasonally adjusted, so it really helps to look at the YoY change.
 Click on graph for larger image in graph gallery.
Although inventory increased from February to March (as usual), inventory decreased 2.1% year-over-year in March (from March 2010). This is the second consecutive month with a small YoY decrease in inventory.
Inventory should increase over the next few months (the normal seasonal pattern), and the YoY change is something to watch closely this year. Inventory is already very high, and any YoY increase in inventory would put more downward pressure on house prices.
 The second graph shows existing home sales Not Seasonally Adjusted (NSA).
The red columns in January, February and March are for 2011.
Sales NSA are below the tax credit boosted level of sales in March 2010, but above the level of March sales in 2008 and 2009.
The bottom line: March is the beginning of the selling season, and sales activity (so far) is above the 2008 and 2009 levels. Much of this activity is from all cash-sales (both investors and homebuyers). The NAR reported "All-cash sales were at a record market share of 35 percent in March, up from 33 percent in February; they were 27 percent in March 2010."
The NAR also mentioned: "Distressed homes – typically sold at discounts in the vicinity of 20 percent – accounted for a 40 percent market share in March, up from 39 percent in February and 35 percent in March 2010." A higher percentage of distressed sales probably means lower prices - and we should expect the repeat sales indexes to show further price declines in March.
The year-over-year decline in inventory will put less downward pressure on house prices, although the level is still very high (and this is just the visible inventory).
Note: The Case-Shiller price index will be released next Tuesday (April 26th), and is released with a significant lag. The Case-Shiller report will be for February (average of three months) - and the NAR report, with the high level of distressed sales and cash buyers, suggests further price declines in March.
Monday, March 21, 2011
Existing Home Inventory decreases 1.2% Year over Year
by Calculated Risk on 3/21/2011 11:30:00 AM
Earlier the NAR released the existing home sales data for February; here are a couple more graphs ...
The first graph shows the year-over-year (YoY) change in reported existing home inventory and months-of-supply. Inventory is not seasonally adjusted, so it really helps to look at the YoY change.
 Click on graph for larger image in graph gallery.
Although inventory increased from January to February (as usual), inventory decreased 1.2% YoY in February. This is a small YoY decrease and follows six consecutive month of year-over-year increases in inventory.
Inventory should increase over the next few months (the normal seasonal pattern), and the YoY change is something to watch closely this year. Inventory is already very high, and further YoY increases in inventory would put more downward pressure on house prices.
 The second graph shows existing home sales Not Seasonally Adjusted (NSA).
The red columns in January and February are for 2011.
Sales NSA were about the same level as the last three years. February is usually the second weakest month of the year for existing home sales (close to January). The real key is what happens in the spring and summer - and March sales and inventory will give a clearer picture of existing home sales activity.
The bottom line: Sales decreased in February (using the old method to estimate sales), possibly due to a decrease in investor purchases of distressed properties at the low end and possibly some weather factors. The NAR noted "Investors accounted for 19 percent of sales activity in February, down from 23 percent in January; they were 19 percent in February 2010."
The NAR also mentioned: "Distressed homes – sold at discount – accounted for a 39 percent market share in February, up from 37 percent in January and 35 percent in February 2010." A higher percentage of distressed sales probably means lower prices - and we should expect the repeat sales indexes to show further price declines in February.
Note: The Case-Shiller prices index will be released next Tuesday (March 29th), and will be for January (average of three months) - and the NAR report suggests further price declines in February.
March is the beginning of the selling season for existing homes, so the next report will be much more important.
Wednesday, February 23, 2011
January Existing Home Sales: 5.36 million SAAR, 7.6 months of supply
by Calculated Risk on 2/23/2011 10:00:00 AM
The NAR reports: January Existing-Home Sales
Existing-home sales, which are completed transactions that include single-family, townhomes, condominiums and co-ops, increased 2.7 percent to a seasonally adjusted annual rate of 5.36 million in January from a downwardly revised 5.22 million in December, and are 5.3 percent above the 5.09 million level in January 2010.
...
Total housing inventory at the end of January fell 5.1 percent to 3.38 million existing homes available for sale, which represents a 7.6-month supply at the current sales pace, down from an 8.2-month supply in December. The inventory supply is at the lowest level since December 2009 when there was a 7.3-month supply.
 Click on graph for larger image in new window.
This graph shows existing home sales, on a Seasonally Adjusted Annual Rate (SAAR) basis since 1993.
Sales in January 2010 (5.36 million SAAR) were 2.7% higher than last month, and were 5.3% higher than January 2010.
 The second graph shows nationwide inventory for existing homes.
According to the NAR, inventory decreased to 3.38 million in January from 3.56 million in December.
Inventory is not seasonally adjusted and there is a clear seasonal pattern with inventory peaking in the summer and declining in the fall - and then really declining during the holidays. So this decline was expected. Inventory should start to increase again in February.
 The last graph shows the 'months of supply' metric.
Months of supply decreased to 7.6 months in January from 8.2 months in December. The months of supply will probably increase over the next few months as sales slow a little, and inventory increases. This is still higher than normal.
These sales numbers were above the consensus of 5.2 million SAAR, and are above what I expected (Lawler's forecast was 5.17 million). I'll have more later.
Special Note: Back in January, I noted that it appeared the NAR had overestimated sales by 5% or so in 2007, and that the errors had increased since then (perhaps 10% or 15% or more in 2009 and 2010). I reported in January that the NAR was working on benchmarking existing home sales for earlier years with other industry data, and I expected "this effort will lead to significant downward revisions to previously reported sales". The numbers reported today were estimated using the old method and will probably be revised down significantly, but they are still useful on a month-to-month basis.
Thursday, January 20, 2011
Existing Home Inventory increases 8.4% Year-over-Year in December
by Calculated Risk on 1/20/2011 11:29:00 AM
Earlier the NAR released the existing home sales data for December; here are a couple more graphs ...
The first graph shows the year-over-year (YoY) change in reported existing home inventory and months-of-supply. Inventory is not seasonally adjusted, so it really helps to look at the YoY change.
IMPORTANT: On a seasonal basis, inventory usually bottoms in December and January, and then will start increasing again in February and March. Since the NAR "months-of-supply" metric uses Seasonally Adjusted (SA) sales, but Not Seasonally Adjusted (NSA) inventory, this seasonal decline in inventory leads to a lower "months-of-supply" in December and January.
The key is to recognize the seasonal pattern, and watch the YoY change in inventory.
 Click on graph for larger image in graph gallery.
Although inventory decreased from November to December, inventory increased 8.4% YoY in December.
This was one of the key metrics I used in 2005 to call the top of the housing bubble in activity. This is the largest year-over-year increase in inventory since January 2008 and this is something to watch closely over the next few months.
 By request - the second graph shows existing home sales Not Seasonally Adjusted (NSA).
The red columns are for 2010.
Sales NSA were above the level in 2007 and 2008, but below the level in 2009.
The bottom line: Sales rebounded in December to just above Tom Lawler's forecast. This was probably due to a combination of low mortgage rates, falling house prices - expecially for distressed properties, and investor buying at the low end.
Inventory remains very high, and the year-over-year increase in inventory is very concerning.
Wednesday, December 22, 2010
November Existing Home Sales: 4.68 million SAAR, 9.5 months of supply
by Calculated Risk on 12/22/2010 10:00:00 AM
The NAR reports: Existing-Home Sales Resume Uptrend with Stable Prices
Existing-home sales, which are completed transactions that include single-family, townhomes, condominiums and co-ops, rose 5.6 percent to a seasonally adjusted annual rate of 4.68 million in November from 4.43 million in October, but are 27.9 percent below the cyclical peak of 6.49 million in November 2009, which was the initial deadline for the first-time buyer tax credit.
...
Total housing inventory at the end of November fell 4.0 percent to 3.71 million existing homes available for sale, which represents a 9.5-month supply at the current sales pace, down from a 10.5-month supply in October.
 Click on graph for larger image in new window.
This graph shows existing home sales, on a Seasonally Adjusted Annual Rate (SAAR) basis since 1993.
Sales in November 2010 (4.68 million SAAR) were 5.6% higher than last month, and were 27.9% lower than November 2009.
 The second graph shows nationwide inventory for existing homes.
According to the NAR, inventory decreased to 3.71 million in November from 3.86 million in October. The all time record high was 4.58 million homes for sale in July 2008.
Inventory is not seasonally adjusted and there is a clear seasonal pattern with inventory peaking in the summer and declining in the fall. I'll have more on inventory later ...
 The last graph shows the 'months of supply' metric.
Months of supply decreased to 9.5 months in November from 10.5 months in October. This is very high and suggests prices, as measured by the repeat sales indexes like Case-Shiller and CoreLogic, will continue to decline.
These weak numbers are below the consensus of 4.85 million SAAR, are are close to what I expected (Lawler's forecast was 4.61 million). I'll have more later.
Tuesday, November 23, 2010
Existing Home Inventory increases 8.4% Year-over-Year
by Calculated Risk on 11/23/2010 11:13:00 AM
Earlier the NAR released the existing home sales data for October; here are a couple more graphs ...
The first graph shows the year-over-year (YoY) change in reported existing home inventory and months-of-supply. Inventory is not seasonally adjusted, so it really helps to look at the YoY change.
 Click on graph for larger image in new window.
Although inventory decreased from September 2010 to October 2010, inventory increased 8.4% YoY in October. This is the largest YoY increase in inventory since early 2008.
The year-over-year increase in inventory is especially bad news because the reported inventory very high (3.864 million), and the 10.5 months of supply in October is far above normal.
 By request - the second graph shows existing home sales Not Seasonally Adjusted (NSA).
The red columns are for 2010. Sales for the last four months are significantly below the previous years, and sales will probably be well weak for the remainder of 2010.
The bottom line: Sales were weak in October - almost exactly at the levels I expected - and will continue to be weak for some time. Inventory is very high - and the significant year-over-year increase in inventory is very concerning. The high level of inventory and months-of-supply will put downward pressure on house prices.
Monday, October 25, 2010
September Existing Home Sales: 4.53 million SAAR, 10.7 months of supply
by Calculated Risk on 10/25/2010 10:00:00 AM
The NAR reports: September Existing-Home Sales Show Another Strong Gain
Existing-home sales, which are completed transactions that include single-family, townhomes, condominiums and co-ops, jumped 10.0 percent to a seasonally adjusted annual rate of 4.53 million in September from a downwardly revised 4.12 million in August, but remain 19.1 percent below the 5.60 million-unit pace in September 2009 when first-time buyers were ramping up in advance of the initial deadline for the tax credit last November.
...
Total housing inventory at the end of September fell 1.9 percent to 4.04 million existing homes available for sale, which represents a 10.7-month supply at the current sales pace, down from a 12.0-month supply in August.
 Click on graph for larger image in new window.
This graph shows existing home sales, on a Seasonally Adjusted Annual Rate (SAAR) basis since 1993.
Sales in September 2010 (4.53 million SAAR) were 10% higher than last month, and were 19.1% lower than September 2009 (5.6 million SAAR).
 The second graph shows nationwide inventory for existing homes.
According to the NAR, inventory decreased slightly to 4.04 million in September from August from 4.12 million in August. The all time record high was 4.58 million homes for sale in July 2008.
Inventory is not seasonally adjusted and there is a clear seasonal pattern with inventory increasing in the spring and into the summer. I'll have more on inventory later ...
 The last graph shows the 'months of supply' metric.
Months of supply decreased to 10.7 months in September from 12.0 months in August. This is extremely high and suggests prices, as measured by the repeat sales indexes like Case-Shiller and CoreLogic, will continue to decline.
Ignore the NAR spin and the median price! These fairly weak numbers are exactly what I expected.
The ongoing high level of supply - and double digit months-of-supply are the key stories. I'll have more ...
Tuesday, October 12, 2010
Lawler: "Early read" on September Existing Home Sales
by Calculated Risk on 10/12/2010 03:55:00 PM
CR Note: This is from housing economist Tom Lawler:
While as always results vary by area, on balance most local realtors/MLS are reporting significant YOY home sales declines for September sales. However, it’s important to remember that last September home sales were “goosed” a bit by the federal home buyer tax credit, which was set to expire at the end of November. Existing home sales ran at an estimated seasonally adjusted annual rate of 5.6 million last September, compared to 5.1 million in August 2009.
While I only have data on a relatively small part of the country, right now I estimate that existing home sales ran at a seasonally adjusted annual rate of about 4.50 million, up almost 9% from the August [2010] pace [of 4.13 million SAAR].
CR Note: This would put the months of supply around 10.3 months in September based on an estimate of 3.85 million for inventory.
Note: It is too soon for any impact on sales from "Foreclosure-Gate".
Existing home sales for September will be released on Monday October 25th at 10 AM ET.
Thursday, September 30, 2010
Existing Home Inventory declines slightly in September, Up year-over-year
by Calculated Risk on 9/30/2010 06:00:00 PM
Tom Lawler reports that at the end of September, listings on Realtor.com totaled 3,960,417, down 1.2% from 4,007,860 at the end of August. This is 1.7% higher than in September 2009.
The NAR reported inventory at 3.98 million at the end of August, and at 3.71 million in September 2009. So they will probably report inventory at around 3.85 million for September 2010. (NAR does not seasonally adjust inventory and this appears to be a normal seasonal decline. The months-of-supply metric uses seasonally adjusted sales, but NSA inventory.).
Since sales probably only increased slightly in September, the months-of-supply metric will probably still be well into double digits again.
Note: there is a seasonal pattern for existing home inventory. Usually inventory peaks in July and declines slightly through October - and then declines sharply at the end of the year as sellers take their homes off the market for the holidays.
Thursday, September 23, 2010
Existing Home Inventory increases 1.5% Year-over-Year
by Calculated Risk on 9/23/2010 11:28:00 AM
Earlier the NAR released the existing home sales data for August; here are a couple more graphs ...
The first graph shows the year-over-year (YoY) change in reported existing home inventory and months-of-supply. Inventory is not seasonally adjusted, so it really helps to look at the YoY change.  Click on graph for larger image in new window.
Although inventory decreased slightly from July 2010 to August 2010, inventory increased 1.5% YoY in August.
Note: Usually July is the peak month for inventory.
The year-over-year increase in inventory is especially bad news because the reported inventory is already historically very high (around 4 million), and the 11.6 months of supply in August is far above normal.
Based on the MBA mortgage purchase applications index, it appears there will be little increase in sales over the next couple of months (sales will probably remain in the low-to-mid 4 million SAAR range). That means we will see double digit months-of-supply for some time - and that suggests house prices will continue to fall.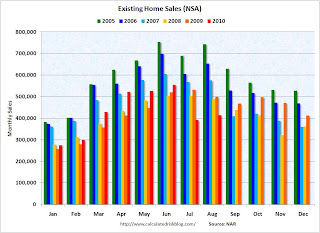 By request - the second graph shows existing home sales Not Seasonally Adjusted (NSA).
The red columns are for 2010. Sales for the last two months are significantly below the previous years, and sales will probably be well below the previous years for the remainder of 2010.
The bottom line: Sales were very weak in August - almost exactly at the levels I expected - and will continue to be weak for some time. Inventory is very high, and that will put downward pressure on house prices.
Existing Home Sales at 4.1 million SAAR, 11.6 months of supply
by Calculated Risk on 9/23/2010 10:00:00 AM
The NAR reports: Existing-Home Sales Move Up in August
Existing-home sales, which are completed transactions that include single-family, townhomes, condominiums and co-ops, increased 7.6 percent to a seasonally adjusted annual rate of 4.13 million in August from an upwardly revised 3.84 million in July, but remain 19.0 percent below the 5.10 million-unit pace in August 2009.
...
Total housing inventory at the end of August slipped 0.6 percent to 3.98 million existing homes available for sale, which represents an 11.6-month supply at the current sales pace, down from a 12.5-month supply in July.
 Click on graph for larger image in new window.
This graph shows existing home sales, on a Seasonally Adjusted Annual Rate (SAAR) basis since 1993.
Sales in August 2010 (4.13 million SAAR) were 7.6% higher than last month, and were 19.0% lower than August 2009 (5.1 million SAAR).
 The second graph shows nationwide inventory for existing homes.
According to the NAR, inventory decreased slightly to 3.98 million in August from 4.01 million in July. The all time record high was 4.58 million homes for sale in July 2008.
Inventory is not seasonally adjusted and there is a clear seasonal pattern with inventory increasing in the spring and into the summer. I'll have more on inventory later ...
 The last graph shows the 'months of supply' metric.
Months of supply decreased to 11.6 months in August from 12.5 months in July. This is extremely high and suggests prices, as measured by the repeat sales indexes like Case-Shiller and CoreLogic, will continue to decline.
These weak numbers are exactly what I expected. Ignore the median price! Double digit supply and the low sales rate are the key stories. I'll have more ...
Wednesday, September 08, 2010
Lawler: Again on Existing Home Months’ Supply: What’s “Normal?”
by Calculated Risk on 9/08/2010 04:49:00 PM
CR Note: This is from economist Tom Lawler.
It has become “common practice” when talking about the “months’ supply” of existing homes for sale for folks to say that the “normal” months’ supply, or the months’ supply that means it is neither a “buyers” or a “sellers” market, is around 6 to 7 months. Yet here is the history of months’ supply for existing SF homes from the National Association of Realtors.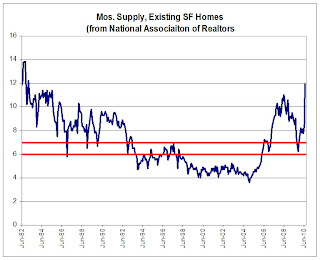 Click on graph for larger image in new window.
As one can see, this “metric” actually has not been in the six-to-seven month range very often. From mid-1982 through 1992, the months’ supply measure was above seven months in all but a handful of months, while from 1998 to the spring of 2006 it was always below six months.
The measure, of course, is quite volatile, and sorta weird in that the inventory number (the numerator) is not seasonally adjusted while the sales data (the denominator) is seasonally adjusted. The measure also can be extremely volatile as sales tend to be impacted more by “special factors” (weather, tax credits, etc.) than listings.
But the measure is only one of many measures that may be “indicative” of “excess” supply, and it probably isn’t even close to the best measure. However, it is the most timely, so folks watch it closely – but sometimes place WAY to much meaning in month-to-month swings.
CR Note: The above was from economist Tom Lawler.
From CR: I'm one of the people who has called 6 to 7 months a "normal" months-of-supply. As the graph above shows, it is hard to define a normal based on the last 30 years.
I've heard the 6 to 7 months metric for years - and it fits the data I have. Perhaps the idea that 6 to 7 months is "normal" comes from new home inventory. This graph shows new home inventory back to 1963 (unfortunately Tom Lawler's graph only goes back to 1982).
For new homes, it does look like around 6 months supply is normal. I suspect if the existing home graph went back to the '60s, something like 6 months would be normal.
Lawler's caution is something to keep in mind. But double digit months-of-supply is clearly very high.
Tuesday, August 31, 2010
Existing Home Inventory declines slightly in August
by Calculated Risk on 8/31/2010 07:10:00 PM
Tom Lawler reports that at the end of August, listings on Realtor.com totaled 4,007,860, down 0.7% from 4,038,133 at the end of July. This is 2.5% above August 2009.
The NAR reported inventory at 3.98 million at the end of July, and at 3.924 million in August 2009. So they will probably report inventory at close to 4 million for August.
Since sales probably only increased slightly in August, the months-of-supply metric will be in double digits again in August and probably still over 12 months.
Note: there is a seasonal pattern for existing home inventory. Usually inventory peaks in July and declines slightly through October - and then declines sharply at the end of the year as sellers take their homes off the market for the holidays.
Tuesday, August 24, 2010
Existing Home Inventory decreases 1.9% Year-over-Year
by Calculated Risk on 8/24/2010 11:30:00 AM
Earlier the NAR released the existing home sales data for July; here are a couple more graphs ...
The first graph shows the year-over-year (YoY) change in reported existing home inventory and months-of-supply. Inventory is not seasonally adjusted, so it really helps to look at the YoY change.  Click on graph for larger image in new window.
Although inventory increased from June 2010 to July 2010, inventory decreased 1.9% YoY in July. The slight year-over-year decline is probably because some sellers put their homes on the market in the Spring hoping to take advantage of the home buyer tax credit.
Note: Usually July is the peak month for inventory.
This level of inventory is especially bad news because the reported inventory is already historically very high, and the 12.5 months of supply in July is far above normal.
The months-of-supply will probably decline in August as sales rebound slightly and some sellers take their homes off the market, but I expect double digit months-of-supply for some time - and that will be a really bad sign for house prices ...
A normal housing market usually has under 6 months of supply. The following graph shows the relationship between supply and house prices (using Case-Shiller). This graph show months of supply (through July 2010) and the annualized change in the Case-Shiller Composite 20 house price index (through May 2010).
Below 6 months of supply (blue line) house prices are typically rising (black line).
Above 6 or 7 months of supply, house prices are usually falling. This isn't perfect - it is just a guideline. Over the last year, there have been many programs aimed at supporting house prices, and house prices increased slightly even with higher than normal supply. However those programs have mostly ended.
This is a key reason why I expect house prices to fall further later this year as measured by the Case-Shiller and CoreLogic repeat sales house price indexes, although I don't expect huge declines like in 2008. My expectation is further price declines of 5% to 10% on the repeat sales indexes.
Notes: The Case-Shiller house price index for June will be reported next week (really a 3 month average of April, May and June). We really want to see prices for July - and those will not be reported until the end of September. And once again the July numbers will be a 3 month average. So it might take until the end of October to see the price declines that are already happening in the housing market.
Existing Home Sales lowest since 1996, 12.5 months of supply
by Calculated Risk on 8/24/2010 10:00:00 AM
The NAR reports: July Existing-Home Sales Fall as Expected but Prices Rise
Existing-home sales, which are completed transactions that include single-family, townhomes, condominiums and co-ops, dropped 27.2 percent to a seasonally adjusted annual rate of 3.83 million units in July from a downwardly revised 5.26 million in June, and are 25.5 percent below the 5.14 million-unit level in July 2009.
Sales are at the lowest level since the total existing-home sales series launched in 1999, and single family sales – accounting for the bulk of transactions – are at the lowest level since May of 1995.
...
Total housing inventory at the end of July increased 2.5 percent to 3.98 million existing homes available for sale, which represents a 12.5-month supply at the current sales pace, up from an 8.9-month supply in June.
 Click on graph for larger image in new window.
This graph shows existing home sales, on a Seasonally Adjusted Annual Rate (SAAR) basis since 1993.
Sales in July 2010 (3.83 million SAAR) were 27.2% lower than last month, and were 25.5% lower than July 2009 (5.14 million SAAR).
 The second graph shows nationwide inventory for existing homes.
According to the NAR, inventory increased to 3.98 million in July from 3.89 million in June. The all time record high was 4.58 million homes for sale in July 2008.
Inventory is not seasonally adjusted and there is a clear seasonal pattern with inventory increasing in the spring and into the summer. I'll have more on inventory later ...
 The last graph shows the 'months of supply' metric.
Months of supply increased to 12.5 months in July from 8.9 months in June. A normal market has under 6 months of supply, so this is extremely high and suggests prices, as measured by the repeat sales indexes like Case-Shiller and CoreLogic, will start declining.
Ignore the median price! Double digit supply and lowest sales rate since 1996 are the key stories.
I'll have more soon.
Tuesday, August 17, 2010
Regional Reports: Home Sales fell sharply in July
by Calculated Risk on 8/17/2010 03:30:00 PM
From DataQuick:
A total of 18,946 new and resale homes were sold in Los Angeles, Riverside, San Diego, Ventura, San Bernardino and Orange counties in July. That was down 20.6 percent from 23,871 in June, and down 21.4 percent from 24,104 for July 2009, according to MDA DataQuick of San Diego.Other reports show similar declines as home sales fell sharply all across the country in July. We are now seeing double-digit months of supply nationwide - and we might even see the months of supply metric reach 1 year. The previous months-of-supply high for this downturn was 11.2 months in 2008.
This was the slowest July since 2007, when 17,867 homes were sold, and the second-slowest since July 1995, when 16,225 sold.
Housing economist Thomas Lawler's preliminary estimate for existing home sales in July is 3.95 million SAAR. If so, this would be fewest sales since 1996. Lawler's estimate for inventory in July was 4.04 million (although it is a bit of a mystery how the NAR calculates inventory). That would mean 12.3 months of supply!
A normal housing market usually has under 6 months of supply. The following graph shows the relationship between supply and house prices (using Case-Shiller).
 Click on graph for larger image in new window.
This graph show months of supply and the annualized change in the Case-Shiller Composite 20 house price index.
Below 6 months of supply (blue line) house prices are typically rising (black line).
Above 6 or 7 months of supply, house prices are usually falling. This isn't perfect - it is just a guideline. Over the last year, there have been many programs aimed at supporting house prices, and house prices increased slightly even with higher than normal supply. However those programs have mostly ended.
The dashed red line is the estimate for months of supply in July. Through the roof! And I expect we will see double-digit months-of-supply for a number of months.
This is a key reason why I expect house prices to fall further later this year as measured by the Case-Shiller and CoreLogic repeat sales house price indexes, although I don't expect huge declines like in 2008.
Friday, July 30, 2010
Existing Homes: Double Digit Months-of-Supply Watch
by Calculated Risk on 7/30/2010 03:44:00 PM
How the NAR calculates existing home inventory is a bit of a mystery. However housing economist Tom Lawler has been tracking inventory several different ways. For July, Lawler reports listings totaled 4,038,133, up about 1.6% from June (using Realtor.com). And this brings us to the double digit months-of-supply watch ...
For June, the NAR reported sales were at a 5.37 million seasonally adjusted annual rate (SAAR), and inventory was at 3.992 million.
To calculated the months of supply, divide 3.992 by 5.37 and multiply by 12 months.
This gives 8.92 months-of-supply (note: there is a seasonal pattern for inventory, but the NAR uses the NSA data). Click on graph for larger image in new window.
This graph shows the 'months-of-supply' metric.
The NAR reported that the months-of-supply increased to 8.9 months in June.
Since we know sales collapsed in July (based on pending home sales and other reports), and using Lawler's estimate for the level of inventory, we can calculate how far sales would have had to fall in July to hit double digits months-of-supply:
| For: Months of Supply | Then: July Sales (millions, SAAR) |
|---|---|
| 10 | 4.85 |
| 11 | 4.40 |
| 12 | 4.04 |
For 12 months of supply, the sales rate (SAAR) would equal inventory.
My initial guess is we will see double digit months-of-supply in July, and for a number of the months thereafter. We might even break the cycle high of 11.2 months set in 2008. If months-of-supply increases sharply as I expect, then there will be additional downward pressure on house prices.
Saturday, July 24, 2010
More new condo inventory
by Calculated Risk on 7/24/2010 04:30:00 PM
Another update on condos as shadow inventory ...
From Roger Vincent at the LA Times: Luxury condo tower in Century City is completed
The prices, exceeding $2,700 per square foot, were a record high for Los Angeles-area condos. ... In recognition that times have changed, developer Related Cos. reduced prices as much as 25% on the building's 140 units. ... About 25% of the building's residential space has been sold or is in escrow ...So 75% are still for sale.
A handful of other deluxe condominium projects have opened in recent months
There are some areas - like Las Vegas and Miami - that have a huge number of vacant high rise condos. But there are also many smaller buildings that are mostly vacant in a number of cities (like in New York, Chicago, San Diego, Raliegh, N.C. and Irvine, Ca).
Unless the high rise condos are listed for sale, they are not included in either the new home inventory report (from the Census Bureau) or the existing home inventory report (from NAR). They are part of the shadow inventory ...
Friday, July 23, 2010
Existing Home Sales: Still above historical median
by Calculated Risk on 7/23/2010 05:11:00 PM
It might be a little surprising, but existing home sales are still above the historical median level of the last 40 years as a percent of owner occupied units ...
Click on graph for larger image in new window.
The first graph shows existing home sales on an annual basis, and end of year inventory. For 2010, sales are estimated at 5.0 million units and year end inventory at 3.4 million units (currently 4.0 million in June, but inventory will decline seasonally).
The second graph shows the same information normalized by the number of owner occupied units. Because of the high number of low end foreclosures (investor buying), and various government programs (tax credit, etc.) the number of existing home sales have stayed fairly high.
The median for sales is about 6.1% of owner occupied units or currently about 4.6 million sales per year.
The median for inventory is about 3.1% of owner occupied units or just over 2.3 million units (about 6 months of inventory).
As distressed sales move into the mid-to-high priced areas and investor activity declines, I expect turnover will slow, and overall sales will probably decline to the median level over the next year or two. This is below most forecasts ...
The NAR forecast for 2011 is 5.6 million existing home sales. So I'll take the under.
Thursday, July 22, 2010
Existing Home Inventory increases 4.7% Year-over-Year
by Calculated Risk on 7/22/2010 11:19:00 AM
Earlier the NAR released the existing home sales data for June; here are a couple more graphs ...
The first graph shows the year-over-year (YoY) change in reported existing home inventory and months-of-supply. Inventory is not seasonally adjusted, so it really helps to look at the YoY change.  Click on graph for larger image in new window.
Inventory increased 4.7% YoY in June. This is the third consecutive month of a year-over-year increases in inventory, and this is the largest YoY increase since early 2008.
This increase in inventory is especially bad news because the reported inventory is already historically very high, and the 8.9 months of supply in June is well above normal.
The months-of-supply will jump in July as sales collapse - probably to double digits - and a double digit months-of-supply would be a really bad sign for house prices ... The second graph shows NSA monthly existing home sales for 2005 through 2010 (see Red columns for 2010).
Sales (NSA) in June 2010 were 8.3% higher than in June 2009, and also higher than in June 2008.
With the expiration of the tax credit, I expect to see existing home sales below last year starting in July. In fact I expect sales in July to be well below last year, and probably the lowest since 1997 (or so).
This was another a weak report. Sales were slightly above expectations (5.37 million at a seasonally adjusted annual rate vs. expectations of 5.3 million), but the YoY increase in inventory and the increase in months-of-supply are the real stories.
If months-of-supply increases sharply as I expect, then there will be additional downward pressure on house prices.


