 RSS Feed
 by Calculated Risk on 8/27/2010 04:03:00 PM
Showing posts with label Demographics. Show all posts
Showing posts with label Demographics. Show all posts
Friday, August 27, 2010
U.S. Births decline in 2009
From the National Center for Health Statistics: Births, Marriages, Divorces, and Deaths: Provisional Data for 2009
The NCHS reports that U.S. births declined to 4.136 million in 2009, from 4.247 million in 2008. The birth rate declined to 13.5 from 13.9 in 2008 (births per 1000 total population).
Here is a long term graph of annual U.S. births through 2009 ... Click on graph for larger image in new window.
Births have declined for two consecutive years, and are now 4.2% below the peak in 2007. I suspect certain segments of the population were under stress before the recession started - like construction workers - and even more families were in distress in 2008 and 2009. Of course it takes 9 months to have a baby, so families in distress in 2009 probably put off having babies in 2010 too.
Notice that the number of births started declining a number of years before the Great Depression started. Many families in the 1920s were under severe stress long before the economy collapsed. By 1933 births were down by almost 23% from the early '20s levels.
Of course economic distress isn't the only reason births decline - look at the huge decline following the baby boom that was driven by demographics. But it is common for births to slow or decline during tough economic times in the U.S. - and that appears to be happening now.
Last year I guessed that we'd see further declines in births in 2009 (now confirmed) and probably in 2010. But I don't think the declines in births will be anything like what happened during the 1920s.
Monday, August 17, 2009
U.S. Population Distribution by Age, 1950 through 2050
by Calculated Risk on 8/17/2009 10:45:00 PM
As I follow up to my post Sunday, Health Care Spending and PCE, here is an animation of the U.S population distribution, by age, from 1950 through 2050. The population data and estimates are from the Census Bureau.
Note: the third graph (link) is a Dynamic Population Pyramid of the same data from the Census Bureau.
Watch for the original baby bust preceding the baby boom. Those are the people currently in retirement. With the original baby bust now at the age of peak health care expenses, these are the best of times (from a demographics perspective) for health care.
Animation updates every 2 seconds.

 Click on graph for larger image in new window.
The second graph is from the Department of Health & Human Services.
Although it would be interesting to break down health care expense by more age groups - this graph does shows that health care expenses are almost three times higher for those over 65 than those under 65. So - in the first graph - as the baby boomers move into the last 4 columns, the health care expenses will rise sharply.
And from the Census Bureau: Dynamic Population Pyramid (1950 - 2050) (note: Iframe version removed - Census Bureau site was slowing down)
Super cool graph. The first graph is in percentages, the one from the Census Bureau is in actual numbers. For you Harold and Maude fans, there will be a lot of older women in 2050.
Monday, April 27, 2009
U.S. Homeownership by Age Group
by Calculated Risk on 4/27/2009 02:57:00 PM
The previous post on the homeownership rate prompted several questions about what happens when the boomers retire? Click on graph for larger image in new window.
This graph shows the homeownership by age group for three different time periods: 1985, 2000, and 2007. Back in 1985, the homeownership rate declined significantly after people turned 70. However, more recently, the homeownership rate has stayed above 80% for those in the 70 to 75 cohort, and close to 80% for people over 75.
I expect the homeownership rate to remain high for the boomer generation too. Although there will probably be a geographic shift as the boomer generation retires (towards the sun states) and some downsizing, I don't think the aging of the boomer generation will negatively impact the homeownership rate for 15 years or more.
And that reminds me of an animation I made several years ago showing the U.S. population distribution by age from 1920 to 2000 (plus 2005).
Animation updates every 2 seconds.

The graphs for 1900 and 1910 have a similar shape as 1920. With the medical advances of the 20th Century, we would expect the shape of the distribution to become flatter as fewer people die of illnesses in the prime of their lives.
There are a couple of things to watch for:
Wednesday, March 18, 2009
2007 Data: Record Number of Babies Born in U.S.
by Calculated Risk on 3/18/2009 09:36:00 PM
Something a little different ... Click on graph for larger image in new window.
From the CDC: Births: Preliminary Data for 2007
The preliminary estimate of births in 2007 rose 1 percent to 4,317,119, the highest number of births ever registered for the United States. The general fertility rate increased by 1 percent in 2007, to 69.5 births per 1,000 women aged 15–44 years, the highest level since 1990. Increases occurred within all race and Hispanic origin groups and for nearly all age groups.Although the chart only goes back to 1930, both the number of births, and the birth rate, declined precipitously in the late '20s as more and more families put off having children because of hard economic times (Times were tough for many families even before the stock market crash of 1929).
...
This number surpasses the peak of the postwar ‘‘baby boom,’’ in 1957 ...
The preliminary estimate of the total fertility rate (TFR) in 2007 was 2,122.5 births per 1,000 women, a 1 percent increase compared with the rate in 2006 (2,100.5, see Table 1). The TFR summarizes the potential impact of current fertility patterns on completed family size by estimating the average number of births that a hypothetical group of 1,000 women would have over their lifetimes, based on age-specific birth rates observed in the given year.
The U.S. TFR in 2007 marks the second consecutive year in which the rate has been above replacement. A replacement rate is the rate at which a given generation can exactly replace itself, generally considered to be 2,100 births per 1,000 women. The TFR had been below replacement from 1972 through 2005.
The original baby bust last throughout the '30s.
There is no evidence in this 2007 data of families putting off having children now. In fact the birth rate and total fertility rate were increasing in 2007.
Now we know who will pay off all that debt!
Thursday, September 13, 2007
Housing Starts and Demographics
by Calculated Risk on 9/13/2007 06:48:00 PM
Both the UCLA Anderson Forecast and Goldman Sachs have recently revised down their estimates for housing starts for the next couple of years. UCLA is now forecasting starts falling to 1 million units annually. Goldman Sachs' forecast is for starts to fall to 1.1 million units in Q4 '07 and Q1 '08 (see bottom of this post for Goldman's housing forecast by quarter).
My forecast is for starts to fall to about 1.1 million units.
Two Key Points:
1. If these forecasts are accurate, starts have fallen less than 60% from the recent peak annual rate in 2005 (2.07 million units) to the eventual bottom. We are barely more than half way, in terms of starts, from the peak to the trough!
2. Demographics are NOT currently favorable for housing as compared to the late '60 through early '80s.
Here is a graph of housing starts since 1959 at a Seasonally Adjusted Annual Rate (SAAR) (Source: Census Bureau). Note: Remember starts include homes built for sales, owner built homes, apartments and condominiums. These number can't be compared directly to New Home sales. Click on graph for larger image.
This graph shows that starts have fallen from just over 2 million units per year to an average of 1.45 million (SAAR) over the first 7 months of 2007. Based on the above forecasts there is a second significant decline in starts coming.
Look at those peaks in starts in the '70s and early '80s. This has led some analysts to argue that the recent peak in activity wasn't extraordinary, especially since the U.S. population is growing. This is an inaccurate view. The second graph shows the trend of people per household (and people per total housing units) in the United States since 1950. Before the period shown on this graph there was a long steady down trend in the number of people per household.
Note: the dashed lines indicates estimates based on the decennial Census for 1950 and 1960.
Starting in the late '60s there was a rapid decrease in the number of persons per household until about the late '80. This was primarily due to the "baby boom" generation forming new households en masse.
It was during this period - of rapid decline in persons per household - that the peaks in housing starts occurred. Many of those starts, especially in the '70s, were for apartments. Even if there had been no increase in the U.S. population, the U.S. would have needed approximately 27% more housing units at the end of this period just to accommodate the change in demographics (persons per household).
Now look at the period since 1988, the persons per household has remained flat. The increase in 2002 was due to revisions, and isn't an actual shift in demographics. If the population had remained steady since 1988, the U.S. wouldn't have needed any additional housing units!
Here is a simple formula for housing starts (assuming no excess inventory):
Housing Starts = f(population growth) + f(change in household size) + demolitions.
f(change in household size) was an important component of housing demand in the '70s and early '80s. In recent years, f(change in household size) = zero.
Now for a little good news for housing: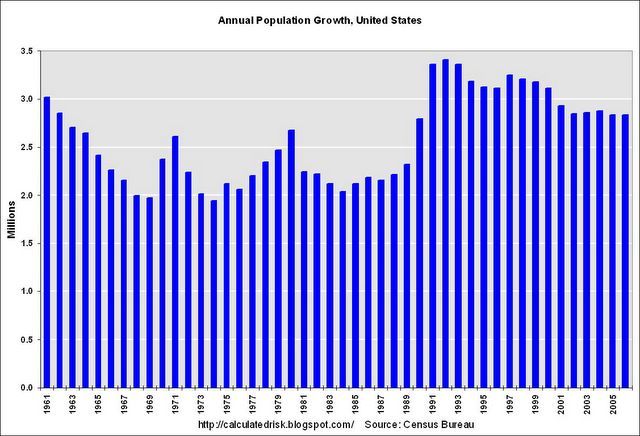
This chart show the annual U.S. population growth according to the Census Bureau. The surge in the early '90s was probably a combination of the Baby Boom echo and perhaps immigration. But the key is that population growth is currently running about 2.85 million people per year.
Back to the formula, this means f(population growth) is larger now than in the '70 and '80s. Unfortunately the improvement in this term is dwarfed by the decline in f(change in household size).
Another piece of good news for housing is that the housing inventory is aging, meaning that the need for demolitions is steadily increasing.
As I noted above, this analysis excludes excess inventory, and unfortunately the current excess is significant (I'll return to this point).
The two key points: there is a second significant decline in starts ahead of us, and demographics are not currently favorable for housing (compared to the '70 and early '80s).


