 RSS Feed
 by Calculated Risk on 9/30/2017 08:11:00 AM
Saturday, September 30, 2017
Schedule for Week of Oct 1, 2017
The key report this week is the September employment report on Friday.
Other key indicators include the September ISM manufacturing and non-manufacturing indexes, September auto sales and the August Trade deficit.
Early: Reis Q3 2017 Mall Survey of rents and vacancy rates.
 10:00 AM: ISM Manufacturing Index for September. The consensus is for the ISM to be at 58.0, down from 58.8 in August.
Here is a long term graph of the ISM manufacturing index.
The ISM manufacturing index indicated expansion in August. The PMI was at 58.8% in August, the employment index was at 59.9%, and the new orders index was at 60.3%.
10:00 AM: Construction Spending for August. The consensus is for a 0.3% increase in construction spending.
 All day: Light vehicle sales for September. The consensus is for light vehicle sales to be 16.7 million SAAR in September, up from 16.1 million in August (Seasonally Adjusted Annual Rate).
This graph shows light vehicle sales since the BEA started keeping data in 1967. The dashed line is the August sales rate.
10:00 AM ET: The CoreLogic House Price index for August.
7:00 AM ET: The Mortgage Bankers Association (MBA) will release the results for the mortgage purchase applications index.
8:15 AM: The ADP Employment Report for September. This report is for private payrolls only (no government). The consensus is for 150,000 payroll jobs added in September, down from 237,000 added in August.
10:00 AM: the ISM non-Manufacturing Index for September. The consensus is for index to increase to 55.4 from 55.3 in August.
3:15 PM: Speech by Fed Chair Janet Yellen, Brief welcoming remarks, At the Community Banking in the 21st Century Research and Policy Conference, hosted by the Federal Reserve System and the Conference of State Bank Supervisors, St. Louis, Missouri
8:30 AM ET: The initial weekly unemployment claims report will be released. The consensus is for 265 thousand initial claims, down from 272 thousand the previous week.
 8:30 AM: Trade Balance report for August from the Census Bureau.
 This graph shows the U.S. trade deficit, with and without petroleum, through July. The blue line is the total deficit, and the black line is the petroleum deficit, and the red line is the trade deficit ex-petroleum products.
The consensus is for the U.S. trade deficit to be at $42.5 billion in August from $43.7 billion in July.
8:30 AM: Employment Report for September. The consensus is for an increase of 95,000 non-farm payroll jobs added in September, down from the 156,000 non-farm payroll jobs added in August.
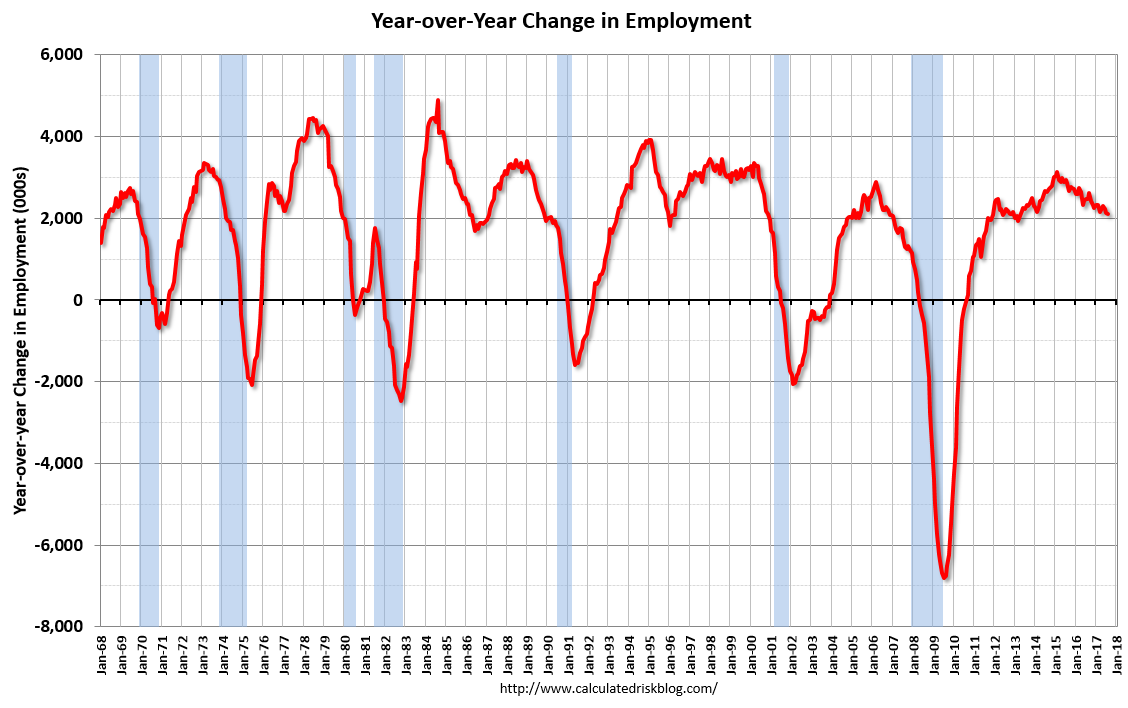 The consensus is for the unemployment rate to increase to 4.4%.
This graph shows the year-over-year change in total non-farm employment since 1968.
In August the year-over-year change was 2.10 million jobs.
A key will be the change in wages.
3:00 PM: Consumer Credit for August from the Federal Reserve.
Friday, September 29, 2017
Fannie Mae: Mortgage Serious Delinquency rate declined in August, Lowest since December 2007
by Calculated Risk on 9/29/2017 04:39:00 PM
Fannie Mae reported that the Single-Family Serious Delinquency rate declined to 0.99% in August, from 1.00% in July. The serious delinquency rate is down from 1.24% in August 2016.
This is the lowest serious delinquency rate since December 2007.
These are mortgage loans that are "three monthly payments or more past due or in foreclosure".
The Fannie Mae serious delinquency rate peaked in February 2010 at 5.59%.
 Click on graph for larger image
By vintage, for loans made in 2004 or earlier (4% of portfolio), 2.65% are seriously delinquent. For loans made in 2005 through 2008 (7% of portfolio), 5.71% are seriously delinquent, For recent loans, originated in 2009 through 2017 (89% of portfolio), only 0.32% are seriously delinquent. So Fannie is still working through poor performing loans from the bubble years.
In the short term - over the next several months - the delinquency rate will probably increase slightly due to the hurricanes. After the hurricane bump, maybe the rate will decline another 0.3 percentage points or so to a cycle bottom, but this is pretty close to normal.
Note: Freddie Mac reported earlier.
Oil Rigs "Signs of life in the rig count"
by Calculated Risk on 9/29/2017 02:33:00 PM
A few comments from Steven Kopits of Princeton Energy Advisors LLC on Sept 29, 2017:
• Rig counts were off modestly this week
• Total US oil rigs were up 6 to 750
• Horizontal oil rigs were up 6 to 640
...
• WTI suggests we have seen the rig bottom for the mini-cycle.
 Click on graph for larger image.
CR note: This graph shows the US horizontal rig count by basin.
Graph and comments Courtesy of Steven Kopits of Princeton Energy Advisors LLC.
Q3 GDP Forecasts: Close to 2%
by Calculated Risk on 9/29/2017 11:43:00 AM
From the Altanta Fed: GDPNow
The GDPNow model forecast for real GDP growth (seasonally adjusted annual rate) in the third quarter of 2017 is 2.3 percent on September 29, up from 2.1 percent on September 27. Since the previous GDPNow update on Wednesday, the forecasts of the contributions of net exports and inventory investment to third-quarter GDP growth increased from -0.16 percentage points and 0.90 percentage points, respectively, to -0.01 percentage points and 1.13 percentage points, respectively. The forecasts of real consumer spending growth and real nonresidential equipment investment growth declined from 2.0 percent and 5.7 percent, respectively, to 1.8 percent and 4.0 percent, respectively.From the NY Fed Nowcasting Report
emphasis added
The New York Fed Staff Nowcast stands at 1.5% for 2017:Q3 and 2.0% for 2017:Q4.CR Note: Based on the August report, PCE looks sluggish in Q3 (mid-month method at 1.7%).
Reis: Office Vacancy Rate "flat" in Q3 at 16.1%
by Calculated Risk on 9/29/2017 10:21:00 AM
Reis released their Q3 2017 Office Vacancy survey this morning. Reis reported that the office vacancy rate was unchanged at 16.1% in Q3, from 16.1% in Q2. This is also unchanged from 16.1% in Q3 2016, and down from the cycle peak of 17.6%.
From Reis Economist Barbara Denham:
Continuing its steady but sluggish pace, the office market recorded no change in vacancy rate in the third quarter. Currently at 16.1% for the second quarter in a row, the national office vacancy rate has moderated between 16.0% and 16.1% for the last seven quarters. Construction fell to 6.5 million square feet from 10.4 million last quarter and 8.1 million in the third quarter of 2016. Net absorption, or occupancy growth, was in line with construction at 5.4 million. Last quarter’s net absorption was 4.8 million square feet, and third quarter 2016 net absorption was 3.7 million square feet.
Although the office market seems to be stalling in this expansion with a persistently high vacancy rate relative to previous expansions — vacancy fell to 12.5% in 2007 from 17.0% in 2003 — one could argue that the market is in equilibrium as occupancy growth moves in line with inventory growth. Still, office employment growth in 2017 for the metro areas has averaged 2.0% (year-over-year through August), down from an average annual growth rate of 2.4% in 2016 and 2.8% in 2015. This means that office demand growth has been slightly weaker over the last eight months than in previous years. ...
Asking and effective rents have both increased 1.5% since the third quarter of 2016. This is the lowest year-over-year rent growth rate since 2011 and the third quarter in a row that year-over-year effective rent growth was below 2%.
 Click on graph for larger image.
This graph shows the office vacancy rate starting in 1980 (prior to 1999 the data is annual).
Reis reported the vacancy rate was at 16.1% in Q3. The office vacancy rate is moving sideways at an elevated level.
Office vacancy data courtesy of Reis.
Personal Income increased 0.2% in August, Spending increased 0.1%
by Calculated Risk on 9/29/2017 08:35:00 AM
The BEA released the Personal Income and Outlays report for August:
Personal income increased $28.6 billion (0.2 percent) in August according to estimates released today by the Bureau of Economic Analysis ... personal consumption expenditures (PCE) increased $18.0 billion (0.1 percent).The August PCE price index increased 1.4 percent year-over-year and the August PCE price index, excluding food and energy, increased 1.3 percent year-over-year.
...
Real PCE decreased 0.1 percent. The PCE price index increased 0.2 percent. Excluding food and energy, the PCE price index increased 0.1 percent.
The following graph shows real Personal Consumption Expenditures (PCE) through August 2017 (2009 dollars). Note that the y-axis doesn't start at zero to better show the change.
 Click on graph for larger image.
The dashed red lines are the quarterly levels for real PCE.
The increase in personal income was below expectations, and the increase in PCE was at expectations.
Using the two-month method to estimate Q3 PCE growth, PCE was increasing at a 1.7% annual rate in Q3 2017. (using the mid-month method, PCE was increasing 1.0%). This suggests sluggish PCE growth in Q3.
Thursday, September 28, 2017
Friday: Personal Income and Outlays, Chicago PMI and More
by Calculated Risk on 9/28/2017 06:50:00 PM
From Matthew Graham at Mortgage News Daily: Mortgage Rates Trying to Find a Ceiling
Mortgage rates were decidedly higher this morning, with most lenders back above last week's highs. At the time, those were the highest rates in more than a month, although the range has been relatively narrow. Underlying bond markets improved throughout the day, however, resulting in a fair amount of lenders revising rate sheets for the better. After those revisions, rates are pretty close to yesterday's levels. [30YR FIXED - 3.875-4.0%]Friday:
• At 8:30 AM ET, Personal Income and Outlays for August. The consensus is for a 0.3% increase in personal income, and for a 0.1% increase in personal spending. And for the Core PCE price index to increase 0.2%.
• Early, Reis Q3 2017 Office Survey of rents and vacancy rates.
• At 9:45 AM, Chicago Purchasing Managers Index for September. The consensus is for a reading of 58.6, down from 58.9 in August.
• At 10:00 AM: University of Michigan's Consumer sentiment index (final for September). The consensus is for a reading of 97.2, unchanged from the preliminary reading 97.6.
New Home Prices
by Calculated Risk on 9/28/2017 01:49:00 PM
As part of the new home sales report released on Tuesday, the Census Bureau reported the number of homes sold by price and the average and median prices.
From the Census Bureau: "The median sales price of new houses sold in August 2017 was $300,200. The average sales price was $368,100."
The following graph shows the median and average new home prices.
 Click on graph for larger image.
During the housing bust, the builders had to build smaller and less expensive homes to compete with all the distressed sales. When housing started to recovery - with limited finished lots in recovering areas - builders moved to higher price points to maximize profits.
The average price in August 2017 was $368,100, and the median price was $300,200. Both are above the bubble high (this is due to both a change in mix and rising prices).
The second graph shows the percent of new homes sold by price.
 About 4% of new homes sold were under $150K in August 2017. This is about the same as in August 2016, but down from 30% in 2002. In general, the under $150K bracket is going away.
The $400K+ bracket has increased significantly. I'll break that bracket up in the future.
A majority of new homes, in the U.S., are in the $200K to $400K range.
Kansas City Fed: Regional Manufacturing Activity "Continued to Expand Solidly" in September
by Calculated Risk on 9/28/2017 11:00:00 AM
From the Kansas City Fed: Tenth District Manufacturing Activity Continued to Expand Solidly
The Federal Reserve Bank of Kansas City released the September Manufacturing Survey today. According to Chad Wilkerson, vice president and economist at the Federal Reserve Bank of Kansas City, the survey revealed that Tenth District manufacturing activity continued to expand at a solid pace and that firms remained optimistic about the future.This was the last of the regional Fed surveys for September.
“Factories in the region reported another good month in September, with little impact overall from the Gulf Coast hurricanes,” said Wilkerson.
...
The month-over-month composite index was 17 in September, up from 16 in August and 10 in July. The composite index is an average of the production, new orders, employment, supplier delivery time, and raw materials inventory indexes. Factory activity increased solidly at both durable and non-durable goods plants, particularly for chemicals, plastics, and machinery products. Month-over-month indexes were somewhat mixed. The production index remained unchanged, while the shipments, employment, and new orders for exports indexes increased mildly. In contrast, the new orders index fell from 25 to 10, and the order backlog index also decreased. The finished goods inventory index fell from 2 to -6, while the raw materials inventory index was mostly unchanged.
emphasis added
Here is a graph comparing the regional Fed surveys and the ISM manufacturing index:
 Click on graph for larger image.
The New York and Philly Fed surveys are averaged together (yellow, through September), and five Fed surveys are averaged (blue, through September) including New York, Philly, Richmond, Dallas and Kansas City. The Institute for Supply Management (ISM) PMI (red) is through August (right axis).
Based on these regional surveys, it seems likely the ISM manufacturing index will be strong again in September (to be released Monday, Oct 2nd).
Weekly Initial Unemployment Claims increase to 272,000
by Calculated Risk on 9/28/2017 08:35:00 AM
The DOL reported:
In the week ending September 23, the advance figure for seasonally adjusted initial claims was 272,000, an increase of 12,000 from the previous week's revised level. The previous week's level was revised up by 1,000 from 259,000 to 260,000. The 4-week moving average was 277,750, an increase of 9,000 from the previous week's unrevised average of 268,750. This is the highest level for this average since February 6, 2016 when it was 277,750.The previous week was revised up.
Hurricanes Harvey and Irma impacted this week's claims.
emphasis added
The following graph shows the 4-week moving average of weekly claims since 1971.
 Click on graph for larger image.
The dashed line on the graph is the current 4-week average. The four-week average of weekly unemployment claims increased to 277,750.
This was slightly above the consensus forecast. The recent increase in claims is due to the hurricanes.
Wednesday, September 27, 2017
Thursday: Unemployment Claims, GDP
by Calculated Risk on 9/27/2017 08:29:00 PM
Thursday:
• At 8:30 AM ET, The initial weekly unemployment claims report will be released. The consensus is for 270 thousand initial claims, up from 259 thousand the previous week.
• Also at 8:30 AM, Gross Domestic Product, 2nd quarter 2017 (Third estimate). The consensus is that real GDP increased 3.1% annualized in Q2, up from second estimate of 3.0%.
• At 11:00 AM, the Kansas City Fed manufacturing survey for September This is the last of the regional Fed surveys for September.
A few comments on the Seasonal Pattern for House Prices
by Calculated Risk on 9/27/2017 05:03:00 PM
CR Note: This is a repeat of earlier posts with updated graphs.
A few key points:
1) There is a clear seasonal pattern for house prices.
2) The surge in distressed sales during the housing bust distorted the seasonal pattern.
3) Even though distressed sales are down significantly, the seasonal factor is based on several years of data - and the factor is now overstating the seasonal change (second graph below).
4) Still the seasonal index is probably a better indicator of actual price movements than the Not Seasonally Adjusted (NSA) index.
For in depth description of these issues, see Trulia chief economist Jed Kolko's article "Let’s Improve, Not Ignore, Seasonal Adjustment of Housing Data"
Note: I was one of several people to question the change in the seasonal factor (here is a post in 2009) - and this led to S&P Case-Shiller questioning the seasonal factor too (from April 2010). I still use the seasonal factor (I think it is better than using the NSA data).
 Click on graph for larger image.
This graph shows the month-to-month change in the NSA Case-Shiller National index since 1987 (through June 2017). The seasonal pattern was smaller back in the '90s and early '00s, and once the bubble burst.
The seasonal swings have declined since the bubble.
 The second graph shows the seasonal factors for the Case-Shiller National index since 1987. The factors started to change near the peak of the bubble, and really increased during the bust.
The swings in the seasonal factors has started to decrease, and I expect that over the next several years - as the percent of distressed sales declines further and recent history is included in the factors - the seasonal factors will move back towards more normal levels.
However, as Kolko noted, there will be a lag with the seasonal factor since it is based on several years of recent data.
Zillow Forecast: "August Case-Shiller Forecast: Annual Home-Price Gains Aiming Higher"
by Calculated Risk on 9/27/2017 03:10:00 PM
The Case-Shiller house price indexes for July were released yesterday. Zillow forecasts Case-Shiller a month early, and I like to check the Zillow forecasts since they have been pretty close.
From Svenja Gudell at Zillow: August Case-Shiller Forecast: Annual Home-Price Gains Aiming Higher
The Case-Shiller U.S. National Index is expected to continue its upward climb in August, gaining 6.0 percent year-over-year following a 5.9 percent increase in July. The monthly gain is forecast at 0.4 percent, slightly below the 0.5 percent uptick in July.The year-over-year change for the Case-Shiller National index will probably be slightly larger in August than in July.
The 10- and 20-city indices are expected to post annual gains of 5.3 percent and 5.9 percent, respectively — both climbing a hair faster than they did year-over-year in July. And both are forecast to post monthly gains of 0.3 percent in August.
Below is Zillow’s full forecast for August Case-Shiller data. These forecasts are based on today’s June Case-Shiller data release and the August 2017 Zillow Home Value Index. The August S&P CoreLogic Case-Shiller Indices will not be released officially until Tuesday, October 31.

Freddie Mac: Mortgage Serious Delinquency rate declined in August, Lowest since April 2008
by Calculated Risk on 9/27/2017 12:18:00 PM
Freddie Mac reported that the Single-Family serious delinquency rate in August was at 0.84%, down from 0.85% in July. Freddie's rate is down from 1.03% in August 2016.
Freddie's serious delinquency rate peaked in February 2010 at 4.20%.
This is the lowest serious delinquency rate since April 2008.
These are mortgage loans that are "three monthly payments or more past due or in foreclosure".
 Click on graph for larger image
Although the rate is still generally declining, the rate of decline has slowed.
In the short term - over the next several months - the rate will probably increase slightly due to the hurricanes.
After the hurricane bump, maybe the rate will decline another 0.2 to 0.3 percentage points or so to a cycle bottom, but this is pretty close to normal.
Note: Fannie Mae will report for August soon.
NAR: Pending Home Sales Index decreased 2.6% in August, down 2.6% year-over-year
by Calculated Risk on 9/27/2017 10:05:00 AM
From the NAR: Pending Home Sales Fall 2.6 Percent in August; 2017 Forecast Downgraded
Pending home sales sank in August for the fifth time in six months, and slower activity in the areas hit hard by Hurricanes Harvey and Irma will likely pull existing sales for the year below the pace set in 2016, according to the National Association of Realtors®.This was below expectations of a 0.1% decrease for this index. Note: Contract signings usually lead sales by about 45 to 60 days, so this would usually be for closed sales in September and October.
The Pending Home Sales Index, a forward-looking indicator based on contract signings, retreated 2.6 percent to 106.3 in August from 109.1 in July. The index is now at its lowest reading since January 2016 (106.1), is 2.6 percent below a year ago, and has fallen on an annual basis in four of the past five months.
...
The PHSI in the Northeast fell 4.4 percent to 93.4 in August, and is now 4.1 percent below a year ago. In the Midwest the index decreased 1.5 percent to 101.8 in August, and is now 3.2 percent lower than August 2016.
Pending home sales in the South retreated 3.5 percent to an index of 118.8 in August and are now 1.7 percent below last August. The index in the West declined 1.0 percent in August to 101.3, and is 2.4 percent below a year ago.
emphasis added
MBA: Mortgage Applications Decrease Slightly in Latest Weekly Survey
by Calculated Risk on 9/27/2017 07:00:00 AM
From the MBA: Mortgage Applications Slightly Decrease in Latest MBA Weekly Surve
Mortgage applications decreased 0.5 percent from one week earlier, according to data from the Mortgage Bankers Association’s (MBA) Weekly Mortgage Applications Survey for the week ending September 22, 2017.
... The Refinance Index decreased 4 percent from the previous week. The seasonally adjusted Purchase Index increased 3 percent from one week earlier. The unadjusted Purchase Index increased 2 percent compared with the previous week and was 4 percent higher than the same week one year ago. ...
The average contract interest rate for 30-year fixed-rate mortgages with conforming loan balances ($424,100 or less) increased to 4.04 percent from 4.03 percent, with points remaining unchanged at 0.40 (including the origination fee) for 80 percent loan-to-value ratio (LTV) loans.
emphasis added
 Click on graph for larger image.
The first graph shows the refinance index since 1990.
Refinance activity will not pick up significantly unless mortgage rates fall well below 4%.
 The second graph shows the MBA mortgage purchase index.
 According to the MBA, purchase activity is up 4% year-over-year.
Tuesday, September 26, 2017
Wednesday: Durable Goods, Pending Home Sales
by Calculated Risk on 9/26/2017 07:59:00 PM
Wednesday:
• At 7:00 AM ET, The Mortgage Bankers Association (MBA) will release the results for the mortgage purchase applications index.
• At 8:30 AM, Durable Goods Orders for August from the Census Bureau. The consensus is for a 1.5% increase in durable goods orders.
• At 10:00 AM, Pending Home Sales Index for August. The consensus is for a 0.1% decrease in the index.
Real House Prices and Price-to-Rent Ratio in July
by Calculated Risk on 9/26/2017 03:50:00 PM
Here is the earlier post on Case-Shiller: Case-Shiller: National House Price Index increased 5.9% year-over-year in July
It has been more than ten years since the bubble peak. In the Case-Shiller release this morning, the seasonally adjusted National Index (SA), was reported as being 3.8% above the previous bubble peak. However, in real terms, the National index (SA) is still about 13.3% below the bubble peak.
The year-over-year increase in prices is mostly moving sideways now in the 5% to 6% range. In July, the index was up 5.9% YoY.
Usually people graph nominal house prices, but it is also important to look at prices in real terms (inflation adjusted). Case-Shiller and others report nominal house prices. As an example, if a house price was $200,000 in January 2000, the price would be close to $278,000 today adjusted for inflation (39%). That is why the second graph below is important - this shows "real" prices (adjusted for inflation).
Nominal House Prices
 The first graph shows the monthly Case-Shiller National Index SA, and the monthly Case-Shiller Composite 20 SA (through July) in nominal terms as reported.
In nominal terms, the Case-Shiller National index (SA) is at a new peak, and the Case-Shiller Composite 20 Index (SA) is back to November 2005 levels.
Real House Prices
 The second graph shows the same two indexes in real terms (adjusted for inflation using CPI less Shelter). Note: some people use other inflation measures to adjust for real prices.
In real terms, the National index is back to August 2004 levels, and the Composite 20 index is back to March 2004.
In real terms, house prices are back to early-to-mid 2004 levels.
Price-to-Rent
In October 2004, Fed economist John Krainer and researcher Chishen Wei wrote a Fed letter on price to rent ratios: House Prices and Fundamental Value. Kainer and Wei presented a price-to-rent ratio using the OFHEO house price index and the Owners' Equivalent Rent (OER) from the BLS.
 Here is a similar graph using the Case-Shiller National and Composite 20 House Price Indexes.
This graph shows the price to rent ratio (January 1998 = 1.0).
On a price-to-rent basis, the Case-Shiller National index is back to November 2003 levels, and the Composite 20 index is back to August 2003 levels.
In real terms, prices are back to early-to-mid 2004 levels, and the price-to-rent ratio is back to 2003 - and the price-to-rent ratio maybe moving a little more sideways now.
Yellen: "Inflation, Uncertainty, and Monetary Policy"
by Calculated Risk on 9/26/2017 12:50:00 PM
From Fed Chair Janet Yellen: Inflation, Uncertainty, and Monetary Policy. Excerpts:
Today I will discuss uncertainty and monetary policy, particularly as it relates to recent inflation developments. Because changes in interest rates influence economic activity and inflation with a substantial lag, the Federal Open Market Committee (FOMC) sets monetary policy with an eye to its effects on the outlook for the economy. But the outlook is subject to considerable uncertainty from multiple sources, and dealing with these uncertainties is an important feature of policymaking. Key among current uncertainties are the forces driving inflation, which has remained low in recent years despite substantial improvement in labor market conditions. As I will discuss, this low inflation likely reflects factors whose influence should fade over time. But as I will also discuss, many uncertainties attend this assessment, and downward pressures on inflation could prove to be unexpectedly persistent. My colleagues and I may have misjudged the strength of the labor market, the degree to which longer-run inflation expectations are consistent with our inflation objective, or even the fundamental forces driving inflation. In interpreting incoming data, we will need to stay alert to these possibilities and, in light of incoming information, adjust our views about inflation, the overall economy, and the stance of monetary policy best suited to promoting maximum employment and price stability.Yellen still thinks inflation will pick up, and that the FOMC is on the correct course.
...
To conclude, standard empirical analyses support the FOMC's outlook that, with gradual adjustments in monetary policy, inflation will stabilize at around the FOMC's 2 percent objective over the next few years, accompanied by some further strengthening in labor market conditions. But the outlook is uncertain, reflecting, among other things, the inherent imprecision in our estimates of labor utilization, inflation expectations, and other factors. As a result, we will need to carefully monitor the incoming data and, as warranted, adjust our assessments of the outlook and the appropriate stance of monetary policy. But in making these adjustments, our longer-run objectives will remain unchanged--to promote maximum employment and 2 percent inflation.
emphasis added
A few Comments on August New Home Sales
by Calculated Risk on 9/26/2017 11:30:00 AM
New home sales for August were reported at 560,000 on a seasonally adjusted annual rate basis (SAAR). This was below the consensus forecast, and the three previous months combined were revised down. However there was probably some negative impact from hurricane Harvey (not clear the size of the impact).
Sales were down 1.2% year-over-year in August.
Earlier: New Home Sales decrease to 560,000 Annual Rate in August.
 Click on graph for larger image.
This graph shows new home sales for 2016 and 2017 by month (Seasonally Adjusted Annual Rate). Sales were down 1.2% year-over-year in August.
For the first eight months of 2017, new home sales are up 7.5% compared to the same period in 2016.
This was a solid year-over-year increase through August.
And here is another update to the "distressing gap" graph that I first started posting a number of years ago to show the emerging gap caused by distressed sales. Now I'm looking for the gap to close over the next several years.
 The "distressing gap" graph shows existing home sales (left axis) and new home sales (right axis) through August 2017. This graph starts in 1994, but the relationship had been fairly steady back to the '60s.
Following the housing bubble and bust, the "distressing gap" appeared mostly because of distressed sales. The gap has persisted even though distressed sales are down significantly, since new home builders focused on more expensive homes.
I expect existing home sales to move more sideways, and I expect this gap to slowly close, mostly from an increase in new home sales.
However, this assumes that the builders will offer some smaller, less expensive homes. If not, then the gap will persist.
 Another way to look at this is a ratio of existing to new home sales.
This ratio was fairly stable from 1994 through 2006, and then the flood of distressed sales kept the number of existing home sales elevated and depressed new home sales. (Note: This ratio was fairly stable back to the early '70s, but I only have annual data for the earlier years).
In general the ratio has been trending down since the housing bust, and this ratio will probably continue to trend down over the next several years.
Note: Existing home sales are counted when transactions are closed, and new home sales are counted when contracts are signed. So the timing of sales is different.
Reis: Apartment Vacancy Rate increased in Q3 to 4.5%
by Calculated Risk on 9/26/2017 10:37:00 AM
Reis reported that the apartment vacancy rate was at 4.5% in Q3 2017, up from 4.4% in Q2, and up from 4.1% in Q3 2016. This is the highest vacancy rate since Q4 2012 (although the increase has been small). The vacancy rate peaked at 8.0% at the end of 2009.
From Reis:
The apartment market continued to withstand the pressure from added supply in the third quarter as the national vacancy rate increased only 10 basis points to 4.5% in the quarter. With so much construction underway, vacancy rates were thought to grow higher. More importantly, asking rents increased 1.0% in the third quarter, while effective rents grew 0.9%.
...
Total inventory is still expected to increase significantly in 2017 and 2018; however, construction in the third quarter, 47,271 units, was again lower than expected. That said, this number should be revised once things get settled in Florida and Houston – two areas that have seen significant construction this year.
At 4.5%, the national vacancy rate increased 10 basis points from 4.4% in the second quarter. One year ago, the vacancy rate was 4.1%. Occupancy growth, or net absorption, was 31,352 units, lower than new supply. This pushed the vacancy rate up in the quarter.
emphasis added
 Click on graph for larger image.
This graph shows the apartment vacancy rate starting in 1980. (Annual rate before 1999, quarterly starting in 1999). Note: Reis is just for large cities.
The vacancy rate had been mostly moving sideways for the last few years. However it appears the vacancy rate has bottomed and is starting to increase. With more supply coming on line later this year and next - and less favorable demographics - the vacancy rate will probably continue to increase slowly.
Apartment vacancy data courtesy of Reis.
New Home Sales decrease to 560,000 Annual Rate in August
by Calculated Risk on 9/26/2017 10:15:00 AM
The Census Bureau reports New Home Sales in August were at a seasonally adjusted annual rate (SAAR) of 560 thousand.
The previous three months combined were revised down.
"Sales of new single-family houses in August 2017 were at a seasonally adjusted annual rate of 560,000, according to estimates released jointly today by the U.S. Census Bureau and the Department of Housing and Urban Development. This is 3.4 percent below the revised July rate of 580,000 and is 1.2 percent below the August 2016 estimate of 567,000. "
emphasis added
 Click on graph for larger image.
The first graph shows New Home Sales vs. recessions since 1963. The dashed line is the current sales rate.
Even with the increase in sales over the last several years, new home sales are still somewhat low historically.
The second graph shows New Home Months of Supply.
 The months of supply increased in August to 6.1 months from 5.7 month in July.
 The all time record was 12.1 months of supply in January 2009.
This is at the top of the normal range (less than 6 months supply is normal).
"The seasonally-adjusted estimate of new houses for sale at the end of August was 284,000. This represents a supply of 6.1 months at the current sales rate."
 On inventory, according to the Census Bureau:
 "A house is considered for sale when a permit to build has been issued in permit-issuing places or work has begun on the footings or foundation in nonpermit areas and a sales contract has not been signed nor a deposit accepted."Starting in 1973 the Census Bureau broke this down into three categories: Not Started, Under Construction, and Completed.
The third graph shows the three categories of inventory starting in 1973.
The inventory of completed homes for sale is still low, and the combined total of completed and under construction is also low.
 The last graph shows sales NSA (monthly sales, not seasonally adjusted annual rate).
In August 2017 (red column), 45 thousand new homes were sold (NSA). Last year, 46 thousand homes were sold in August.
The all time high for August was 110 thousand in 2005, and the all time low for August was 23 thousand in 2010.
This was below expectations of 583,000 sales SAAR, and the previous months were revised down. I'll have more later today.
Case-Shiller: National House Price Index increased 5.9% year-over-year in July
by Calculated Risk on 9/26/2017 09:13:00 AM
S&P/Case-Shiller released the monthly Home Price Indices for July ("July" is a 3 month average of May, June and July prices).
This release includes prices for 20 individual cities, two composite indices (for 10 cities and 20 cities) and the monthly National index.
Note: Case-Shiller reports Not Seasonally Adjusted (NSA), I use the SA data for the graphs.
From S&P: The S&P Corelogic Case-Shiller National Home Price Index Continues to Rise
The S&P CoreLogic Case-Shiller U.S. National Home Price NSA Index, covering all nine U.S. census divisions, reported a 5.9% annual gain in July, up from 5.8% the previous month. The 10-City Composite annual increase came in at 5.2%, up from 4.9% the previous month. The 20-City Composite posted a 5.8% year-over-year gain, up from 5.6% the previous month.
Seattle, Portland, and Las Vegas reported the highest year-over-year gains among the 20 cities. In July, Seattle led the way with a 13.5% year-over-year price increase, followed by Portland with a 7.6% increase, and Las Vegas with a 7.4% increase. Twelve cities reported greater price increases in the year ending July 2017 versus the year ending June 2017.
...
Before seasonal adjustment, the National Index posted a month-over-month gain of 0.7% in July. The 10-City and 20-City Composites reported increases of 0.8% and 0.7% respectively in July. After seasonal adjustment, the National Index recorded a 0.5% month-over-month increase. The 10-City Composite posted a 0.4% month-over-month increase. The 20-City Composite posted a 0.3% monthover-month increase. All 20 cities reported increases in July before seasonal adjustment; after seasonal adjustment, 17 cities saw prices rise.
“Home prices over the past year rose at a 5.9% annual rate,” says David M. Blitzer, Managing Director and Chairman of the Index Committee at S&P Dow Jones Indices. “Consumers, through home buying and other spending, are the driving force in the current economic expansion. While the gains in home prices in recent months have been in the Pacific Northwest, the leadership continues to shift among regions and cities across the country. Dallas and Denver are also experiencing rapid price growth. Las Vegas, one of the hardest hit cities in the housing collapse, saw the third fastest increase in the year through July 2017.
“While home prices continue to rise, other housing indicators may be leveling off. Sales of both new and existing homes have slipped since last March. The Builders Sentiment Index published by the National Association of Home Builders also leveled off after March. Automobiles are the second largest consumer purchase most people make after houses. Auto sales peaked last November and have been flat to slightly lower since. The housing market will face two contradicting challenges during the rest of 2017 and into 2018. First, rebuilding following hurricanes across Texas, Florida and other parts of the south will lead to further supply pressures. Second, the Fed’s recent move to shrink its balance sheet could push mortgage rates upward.”
emphasis added
 Click on graph for larger image.
 The first graph shows the nominal seasonally adjusted Composite 10, Composite 20 and National indices (the Composite 20 was started in January 2000).
The Composite 10 index is off 6.3% from the peak, and up 0.4% in July (SA).
The Composite 20 index is off 3.5% from the peak, and up 0.35% (SA) in July.
The National index is 3.8% above the bubble peak (SA), and up 0.5% (SA) in July. The National index is up 40.3% from the post-bubble low set in December 2011 (SA).
 The second graph shows the Year over year change in all three indices.
The Composite 10 SA is up 5.2% compared to June 2016. The Composite 20 SA is up 5.8% year-over-year.
The National index SA is up 5.9% year-over-year.
Note: According to the data, prices increased in 17 of 20 cities month-over-month seasonally adjusted.
I'll have more later.
Monday, September 25, 2017
Tuesday: New Home Sales, Case-Shiller House Prices, Yellen Speech and More
by Calculated Risk on 9/25/2017 06:17:00 PM
From Matthew Graham at Mortgage News Daily: Mortgage Rate Resilience Continues
Mortgage rates held their ground yet again, and are finally starting to look resilient after a relatively sharp move higher over the past 2 weeks. This was true even before mid-day headlines put additional downward pressure on rates. ... Some lenders responded to the bond market improvements by adjusting today's rate sheets. Other lenders maintained the same rates from the morning and thus will be more likely to offer better pricing tomorrow, assuming minimal bond market movement overnight. [30YR FIXED - 3.875-4.0%]Tuesday:
• At 9:00 AM ET: S&P/Case-Shiller House Price Index for July. The consensus is for a 5.9% year-over-year increase in the Comp 20 index for July.
• At Early: Reis Q3 2017 Apartment Survey of rents and vacancy rates.
• At 10:00 AM ET: New Home Sales for August from the Census Bureau. The consensus is for 583 thousand SAAR, unchanged from 571 thousand in July.
• At 10:00 AM: Richmond Fed Survey of Manufacturing Activity for September.
• At 12:45 PM: Speech by Fed Chair Janet Yellen, Inflation, Uncertainty, and Monetary Policy, 59th NABE Annual Meeting, Cleveland, Ohio
Duy: "Has The Fed Abandoned Its Reaction Function?"
by Calculated Risk on 9/25/2017 01:44:00 PM
From economist Tim Duy at FedWatch: Has The Fed Abandoned Its Reaction Function?
The immediate policy outcomes of the FOMC meeting were largely as expected. Central bankers left interest rates unchanged while announcing that the reduction of the balance sheet will begin in October as earlier outlined in June. The real action was in the Summary of Economic Projections. Policymakers continue to anticipate one more rate hike this year and three next. This policy stance looks inconsistent with the downward revisions to projections of inflation and the neutral rate; under the Fed’s earlier reaction function, the combination of the two would drive down rate projections. Arguably, policy is thus no longer as data dependent as the Fed would like us to believe. That or the reaction function has changed.
...
The economic forecasts were somewhat confounding. Policymakers edged up their growth forecasts, but still anticipate that unemployment will end the year at 4.3%.
The unemployment forecast for the next two years edged down 0.1 percentage point, but this relative stability is somewhat confusing given that growth is expected to exceed potential growth until 2020 (remember, the Fed believes that labor force participation is more likely to fall than rise, so strong growth should induce downward pressure on unemployment).
...
Bottom line: the Fed is strongly committed to rate hikes. The[y] don’t appear to be following their earlier reaction function; policy feels path dependent at the moment. Indeed, given the Fed’s expectation of low inflation and volatile and possibly weak data due to the hurricanes, it is difficult to see what stops the Fed from hiking in December.
Dallas Fed: "Growth in Texas Manufacturing Activity Holds Steady" in September
by Calculated Risk on 9/25/2017 10:44:00 AM
From the Dallas Fed: Growth in Texas Manufacturing Activity Holds Steady
Texas factory activity continued to increase in September, according to business executives responding to the Texas Manufacturing Outlook Survey. The production index, a key measure of state manufacturing conditions, edged down to 19.5 from 20.3 in August, indicating output grew at about the same pace as last month.The regional reports released so far for September have been solid.
Other measures of current manufacturing activity also indicated continued growth. The new orders index increased and the growth rate of orders index ticked down but stayed positive, coming in at 18.6 and 9.7, respectively. The capacity utilization index edged up four points to 15.8, while the shipments index jumped nine points to 27.4.
Perceptions of broader business conditions improved in September. The general business activity index increased to 21.3, its highest reading in seven months. The company outlook index posted its 13th consecutive positive reading, jumping nine points to 25.6.
Labor market measures suggested faster employment growth and longer workweeks this month. The employment index came in at 16.3, its highest level since April 2014. Twenty-eight percent of firms noted net hiring, compared with 11 percent noting net layoffs. The hours worked index rose four points to 18.4.
emphasis added
Black Knight: House Price Index up 0.5% in July, Up 6.2% year-over-year
by Calculated Risk on 9/25/2017 09:30:00 AM
Note: I follow several house price indexes (Case-Shiller, CoreLogic, Black Knight, Zillow, FHFA, FNC and more). Note: Black Knight uses the current month closings only (not a three month average like Case-Shiller or a weighted average like CoreLogic), excludes short sales and REOs, and is not seasonally adjusted.
From Black Knight: Black Knight Home Price Index Report: Monthly Rate of Appreciation Slows as U.S. Home Prices Gain 0.5 Percent in July, Year-Over-Year Growth Steady at 6.2 Percent
• The rate of growth in year-over-year price appreciation stabilized in July after accelerating throughout every month of 2017The year-over-year increase in this index has been about the same for the last year (in the 5% and 6% range).
• After hitting a high of 1.3 percent in March 2017, the rate of monthly appreciation has steadily slowed over subsequent months
• July marks 63 consecutive months of annual home price appreciation
• Of the 20 largest states, only Virginia saw home prices pull back, with a 0.2 percent month-over-month decline from June
Note that house prices are above the bubble peak in nominal terms, but not in real terms (adjusted for inflation). Case-Shiller for July will be released tomorrow.
Chicago Fed "Index points to slower economic growth in August"
by Calculated Risk on 9/25/2017 08:38:00 AM
From the Chicago Fed: Index points to slower economic growth in August
Led by declines in production-related indicators, the Chicago Fed National Activity Index (CFNAI) moved down to –0.31 in August from +0.03 in July. Two of the four broad categories of indicators that make up the index decreased from July, and two of the four categories made negative contributions to the index in August. The index’s three-month moving average, CFNAI-MA3, decreased to –0.04 in August from a neutral reading in July.This graph shows the Chicago Fed National Activity Index (three month moving average) since 1967.
emphasis added
 Click on graph for larger image.
This suggests economic activity was close to the historical trend in August (using the three-month average).
According to the Chicago Fed:
The index is a weighted average of 85 indicators of growth in national economic activity drawn from four broad categories of data: 1) production and income; 2) employment, unemployment, and hours; 3) personal consumption and housing; and 4) sales, orders, and inventories.
...
A zero value for the monthly index has been associated with the national economy expanding at its historical trend (average) rate of growth; negative values with below-average growth (in standard deviation units); and positive values with above-average growth.
Sunday, September 24, 2017
Sunday Night Futures
by Calculated Risk on 9/24/2017 08:50:00 PM
Weekend:
• Schedule for Week of Sept 24, 2017
Monday:
• At 8:30 AM ET, Chicago Fed National Activity Index for August. This is a composite index of other data.
• At 10:30 AM, Dallas Fed Survey of Manufacturing Activity for September.
From CNBC: Pre-Market Data and Bloomberg futures: S&P 500 are up 3, and DOW futures are up 35 (fair value).
Oil prices were up over the last week with WTI futures at $50.60 per barrel and Brent at $56.83 per barrel. A year ago, WTI was at $45, and Brent was at $47 - so oil prices are up 10% to 20% year-over-year.
Here is a graph from Gasbuddy.com for nationwide gasoline prices. Nationally prices are at $2.55 per gallon - up sharply due to Hurricane Harvey, but now declining - a year ago prices were at $2.20 per gallon - so gasoline prices are up 35 cents per gallon year-over-year.
Hotel Occupancy Rate just Behind Record Year
by Calculated Risk on 9/24/2017 11:00:00 AM
From HotelNewsNow.com: STR: US hotel results for week ending 16 September
The U.S. hotel industry reported positive year-over-year results in the three key performance metrics during the week of 10-16 September 2017, according to data from STR.The following graph shows the seasonal pattern for the hotel occupancy rate using the four week average.
In comparison with the week of 11-17 September 2016, the industry recorded the following:
• Occupancy: +0.5% to 72.2%
• Average daily rate (ADR): +1.4% to US$131.50
• Revenue per available room (RevPAR): +1.8% to US$94.97
Among the Top 25 Markets, Houston, Texas, reported the largest year-over-year increases in occupancy (+43.3% to 87.8%) and RevPAR (+58.6% to US$103.24). Amid recovery from Hurricane Harvey, Houston also posted an ADR increase of 10.7% to US$117.63.
Tampa/St. Petersburg, Florida, posted the second-highest lift in occupancy (+13.8% to 70.3%), that coupled with the highest increase in ADR (+14.1% to US$119.06), led the second-largest jump in RevPAR (+29.9% to US$83.75).
emphasis added
 The red line is for 2017, dash light blue is 2016, dashed orange is 2015 (best year on record), blue is the median, and black is for 2009 (the worst year since the Great Depression for hotels).
Currently the occupancy rate, to date, is ahead of last year, and just behind the record year in 2015. The hurricanes might push the annual occupancy rate to a new record.
Seasonally, the occupancy rate will increase into the Fall business travel season.
Data Source: STR, Courtesy of HotelNewsNow.com
Saturday, September 23, 2017
Schedule for Week of Sept 24, 2017
by Calculated Risk on 9/23/2017 08:09:00 AM
The key economic report this week is New Home sales for August on Tuesday.
Other key indicators include the third estimate of Q2 GDP, and July Case-Shiller house prices.
8:30 AM ET: Chicago Fed National Activity Index for August. This is a composite index of other data.
10:30 AM: Dallas Fed Survey of Manufacturing Activity for September.
 9:00 AM ET: S&P/Case-Shiller House Price Index for July.
This graph shows the nominal seasonally adjusted National Index, Composite 10 and Composite 20 indexes through the June 2017 report (the Composite 20 was started in January 2000).
The consensus is for a 5.9% year-over-year increase in the Comp 20 index for July.
Early: Reis Q3 2017 Apartment Survey of rents and vacancy rates.
 10:00 AM ET: New Home Sales for August from the Census Bureau.
 This graph shows New Home Sales since 1963. The dashed line is the July sales rate.
The consensus is for 583 thousand SAAR, unchanged from 571 thousand in July.
10:00 AM: Richmond Fed Survey of Manufacturing Activity for September.
12:45 PM: Speech by Fed Chair Janet Yellen, Inflation, Uncertainty, and Monetary Policy, 59th NABE Annual Meeting, Cleveland, Ohio
7:00 AM ET: The Mortgage Bankers Association (MBA) will release the results for the mortgage purchase applications index.
8:30 AM: Durable Goods Orders for August from the Census Bureau. The consensus is for a 1.5% increase in durable goods orders.
10:00 AM: Pending Home Sales Index for August. The consensus is for a 0.1% decrease in the index.
8:30 AM ET: The initial weekly unemployment claims report will be released. The consensus is for 270 thousand initial claims, up from 259 thousand the previous week.
8:30 AM: Gross Domestic Product, 2nd quarter 2017 (Third estimate). The consensus is that real GDP increased 3.1% annualized in Q2, up from second estimate of 3.0%.
11:00 AM: the Kansas City Fed manufacturing survey for September.
Early: Reis Q3 2017 Office Survey of rents and vacancy rates.
8:30 AM: Personal Income and Outlays for August. The consensus is for a 0.3% increase in personal income, and for a 0.1% increase in personal spending. And for the Core PCE price index to increase 0.2%.
9:45 AM: Chicago Purchasing Managers Index for September. The consensus is for a reading of 58.6, down from 58.9 in August.
10:00 AM: University of Michigan's Consumer sentiment index (final for September). The consensus is for a reading of 97.2, unchanged from the preliminary reading 97.6.
Friday, September 22, 2017
Vehicle Forecast: Sales Expected to Exceed 17 million SAAR in September
by Calculated Risk on 9/22/2017 02:56:00 PM
The automakers will report September vehicle sales on Tuesday, October 3rd.
Note: There were 26 selling days in September 2017, there were 25 in September 2016.
From WardsAuto: Forecast: SAAR Expected to Surpass 17 Million in September
A WardsAuto forecast calls for U.S. light-vehicle sales to reach a 17.5 million-unit seasonally adjusted annual rate in September, following August’s 16.0 million SAAR and ending a 6-month streak of sub-17 million figures. In same-month 2016, the SAAR reached 17.6 million.Sales have been below 17 million SAAR for six consecutive months.
...
Preliminary assumptions pointed to October, rather than September, as the turning point for the market, as consumers replace vehicles lost due to natural disasters and automakers push sales to clear out excess model-year ’17 stock. However, the winds have already begun to turn, and September sales will be significantly higher than originally expected.
emphasis added
Mortgage Equity Withdrawal slightly positive in Q2
by Calculated Risk on 9/22/2017 10:23:00 AM
Note: This is not Mortgage Equity Withdrawal (MEW) data from the Fed. The last MEW data from Fed economist Dr. Kennedy was for Q4 2008.
The following data is calculated from the Fed's Flow of Funds data (released yesterday) and the BEA supplement data on single family structure investment. This is an aggregate number, and is a combination of homeowners extracting equity - hence the name "MEW" - and normal principal payments and debt cancellation (modifications, short sales, and foreclosures).
For Q2 2017, the Net Equity Extraction was a positive $12 billion, or a positive 0.3% of Disposable Personal Income (DPI) .
 Click on graph for larger image.
This graph shows the net equity extraction, or mortgage equity withdrawal (MEW), results, using the Flow of Funds (and BEA data) compared to the Kennedy-Greenspan method.
Note: This data is impacted by debt cancellation and foreclosures, but much less than a few years ago.
The Fed's Flow of Funds report showed that the amount of mortgage debt outstanding increased by $64 billion in Q2.
The Flow of Funds report also showed that Mortgage debt has declined by $1.23 trillion since the peak. This decline is mostly because of debt cancellation per foreclosures and short sales, and some from modifications. There has also been some reduction in mortgage debt as homeowners paid down their mortgages so they could refinance.
With a slower rate of debt cancellation, MEW will likely be mostly positive going forward.
For reference:
Dr. James Kennedy also has a simple method for calculating equity extraction: "A Simple Method for Estimating Gross Equity Extracted from Housing Wealth". Here is a companion spread sheet (the above uses my simple method).
For those interested in the last Kennedy data included in the graph, the spreadsheet from the Fed is available here.
Update: For Fun, Stock Market as Barometer of Policy Success
by Calculated Risk on 9/22/2017 08:11:00 AM
Note: This is a repeat of a June post with updated statistics and graph.
There are a number of observers who think the stock market is the key barometer of policy success. My view is there are many measures of success - and that the economy needs to work well for a majority of the people - not just stock investors.
However, for example, Treasury Secretary Steven Mnuchin was on CNBC on Feb 22, 2017, and was asked if the stock market rally was a vote of confidence in the new administration, he replied: "Absolutely, this is a mark-to-market business, and you see what the market thinks."
And Larry Kudlow wrote in 2007: A Stock Market Vote of Confidence for Bush: "I have long believed that stock markets are the best barometer of the health, wealth and security of a nation. And today's stock market message is an unmistakable vote of confidence for the president."
Note: Kudlow's comments were made a few months before the market started selling off in the Great Recession. For more on Kudlow, see: Larry Kudlow is usually wrong
For fun, here is a graph comparing S&P500 returns (ex-dividends) under Presidents Trump and Obama:
 Click on graph for larger image.
Blue is for Mr. Obama, Orange is for Mr. Trump.
At this point, the S&P500 is up 10.1% under Mr. Trump compared to up 32.2% under Mr. Obama for the same number of market days.
Thursday, September 21, 2017
Earlier: Philly Fed Manufacturing Survey "Showed Improvement" in September
by Calculated Risk on 9/21/2017 03:00:00 PM
Earlier from the Philly Fed: September 2017 Manufacturing Business Outlook Survey
Manufacturing firms reported an improvement in regional manufacturing conditions in September. The survey’s current indicators for general activity, new orders, and shipments increased this month and suggest a broadening of growth. Price pressures also picked up, according to the reporting firms. The survey’s future indicators suggest that manufacturers have generally grown more optimistic over the past three months.Here is a graph comparing the regional Fed surveys and the ISM manufacturing index:
...
The indexes for general activity [increased to 23.8 from 18.9 in August], new orders, and shipments increased this month, and employment remained positive.
emphasis added
 Click on graph for larger image.
The New York and Philly Fed surveys are averaged together (yellow, through September), and five Fed surveys are averaged (blue, through August) including New York, Philly, Richmond, Dallas and Kansas City. The Institute for Supply Management (ISM) PMI (red) is through August (right axis).
This suggests the ISM manufacturing index will show solid expansion in September.
Fed's Flow of Funds: Household Net Worth increased in Q2
by Calculated Risk on 9/21/2017 01:10:00 PM
The Federal Reserve released the Q2 2017 Flow of Funds report today: Flow of Funds.
According to the Fed, household net worth increased in Q2 2017 compared to Q1 2017:
The net worth of households and nonprofits rose to $96.2 trillion during the second quarter of 2017. The value of directly and indirectly held corporate equities increased $1.1 trillion and the value of real estate increased $0.6 trillion.The Fed estimated that the value of household real estate increased to $23.8 trillion in Q2. The value of household real estate is now above the bubble peak in early 2006 - but not adjusted for inflation, and this also includes new construction.
 Click on graph for larger image.
The first graph shows Households and Nonprofit net worth as a percent of GDP. Household net worth, as a percent of GDP, is higher than the peak in 2006 (housing bubble), and above the stock bubble peak.
This includes real estate and financial assets (stocks, bonds, pension reserves, deposits, etc) net of liabilities (mostly mortgages). Note that this does NOT include public debt obligations.
 This graph shows homeowner percent equity since 1952.
 Household percent equity (as measured by the Fed) collapsed when house prices fell sharply in 2007 and 2008.
In Q2 2017, household percent equity (of household real estate) was at 58.4% - up from Q2, and the highest since Q1 2006. This was because of an increase in house prices in Q2 (the Fed uses CoreLogic).
Note: about 30.3% of owner occupied households had no mortgage debt as of April 2010. So the approximately 50+ million households with mortgages have far less than 58.4% equity - and about 2.8 million homeowners still have negative equity.
 The third graph shows household real estate assets and mortgage debt as a percent of GDP.
 Mortgage debt increased by $64 billion in Q2.
Mortgage debt has declined by $1.23 trillion from the peak. Studies suggest most of the decline in debt has been because of foreclosures (or short sales), but some of the decline is from homeowners paying down debt (sometimes so they can refinance at better rates).
The value of real estate, as a percent of GDP, was up in Q2, and is above the average of the last 30 years (excluding bubble). However, mortgage debt as a percent of GDP, continues to decline.
Black Knight: Mortgage Delinquencies increase in Hurricane Affected Areas
by Calculated Risk on 9/21/2017 09:58:00 AM
• Nationally, delinquencies remained relatively flat from July, while delinquencies in Hurricane Harvey- impacted areas rose by 16 percent month over monthAccording to Black Knight's First Look report for August, the percent of loans delinquent increased 0.7% in August compared to July, and declined 7.3% year-over-year.
• Despite most payments being due August 1, and the storm making landfall near the end of the month, its effect on mortgage delinquencies is already being felt
• Over 6,700 new 30-day delinquencies can be attributed to Harvey, while an additional 1,000 borrowers who were already 30-days past due missed an additional mortgage payment in August as a result of the storm
• Based on observations from previous hurricanes, the heaviest impact on mortgage delinquency rates will come in September
The percent of loans in the foreclosure process declined 3.3% in August and were down 27.2% over the last year.
Black Knight reported the U.S. mortgage delinquency rate (loans 30 or more days past due, but not in foreclosure) was 3.93% in August, up from 3.90% in July.
The percent of loans in the foreclosure process declined in August to 0.76%.
The number of delinquent properties, but not in foreclosure, is down 148,000 properties year-over-year, and the number of properties in the foreclosure process is down 142,000 properties year-over-year.
| Black Knight: Percent Loans Delinquent and in Foreclosure Process | ||||
|---|---|---|---|---|
| Aug 2017 | July 2017 | Aug 2016 | Aug 2015 | |
| Delinquent | 3.93% | 3.90% | 4.24% | 4.87% |
| In Foreclosure | 0.76% | 0.78% | 1.04% | 1.48% |
| Number of properties: | ||||
| Number of properties that are delinquent, but not in foreclosure: | 2,003,000 | 1,986,000 | 2,151,000 | 2,413,000 |
| Number of properties in foreclosure pre-sale inventory: | 385,000 | 398,000 | 527,000 | 748,000 |
| Total Properties | 2,388,000 | 2,384,000 | 2,678,000 | 3,161,000 |
CoreLogic: "2.8 million Homes still in negative equity" at end of Q2 2017
by Calculated Risk on 9/21/2017 08:46:00 AM
From CoreLogic: CoreLogic Reports 2.8 Million Residential Properties with a Mortgage Still in Negative Equity
CoreLogic® ... today released its Q2 2017 home equity analysis which shows U.S. homeowners with mortgages (roughly 63 percent of all homeowners) have seen their equity increase by a total of 10.6 percent year over year, representing a gain of $766 billion since Q2 2016.
Additionally, homeowners gained an average of $12,987 in equity between Q2 2016 and Q2 2017. Western states led the equity increase with Washington homeowners gaining an average of approximately $40,000 in home equity and California homeowners gaining an average of approximately $30,000 in home equity. Home price increases in these states drove the equity gains.
From Q1 2017 to Q2 2017, the total number of mortgaged residential properties with negative equity decreased 10 percent to 2.8 million homes, or 5.4 percent of all mortgaged properties. Year over year, negative equity decreased 21.9 percent from 3.6 million homes, or 7.1 percent of all mortgaged properties, from Q2 2016 to Q2 2017.
“Over the last 12 months, approximately 750,000 borrowers achieved positive equity,” said Dr. Frank Nothaft, chief economist for CoreLogic. “This means that mortgage risk continues to decline and, given the continued strength in home prices, CoreLogic expects home equity to rise steadily over the next year.”
emphasis added
 Click on graph for larger image.
This graph shows the distribution of home equity in Q2 2017 compared to Q1 2017.
For reference, about five years ago, in Q3 2012, almost 10% of residential properties had 25% or more negative equity.
A year ago, in Q2 2016, there were 3.6 million properties with negative equity - now there are 2.8 million. A significant change.
Weekly Initial Unemployment Claims decrease to 259,000
by Calculated Risk on 9/21/2017 08:34:00 AM
The DOL reported:
In the week ending September 16, the advance figure for seasonally adjusted initial claims was 259,000, a decrease of 23,000 from the previous week's revised level. The previous week's level was revised down by 2,000 from 284,000 to 282,000. The 4-week moving average was 268,750, an increase of 6,000 from the previous week's revised average. This is the highest level for this average since June 4, 2016 when it was 269,500. The previous week's average was revised down by 500 from 263,250 to 262,750.The previous week was revised down.
Hurricanes Harvey and Irma impacted this week's claims.
emphasis added
The following graph shows the 4-week moving average of weekly claims since 1971.
 Click on graph for larger image.
The dashed line on the graph is the current 4-week average. The four-week average of weekly unemployment claims increased to 268,750.
This was below the consensus forecast.
The report includes the reference period (includes the 12th of the month) for the September employment report - and suggests there was some impact of the hurricanes on employment in September.


