 RSS Feed
 by Calculated Risk on 9/20/2016 12:59:00 PM
Tuesday, September 20, 2016
Comments on August Housing Starts
Earlier: Housing Starts increased to 1.142 Million Annual Rate in August
The housing starts report this morning was below consensus, however there were upward revisions to the prior two months.
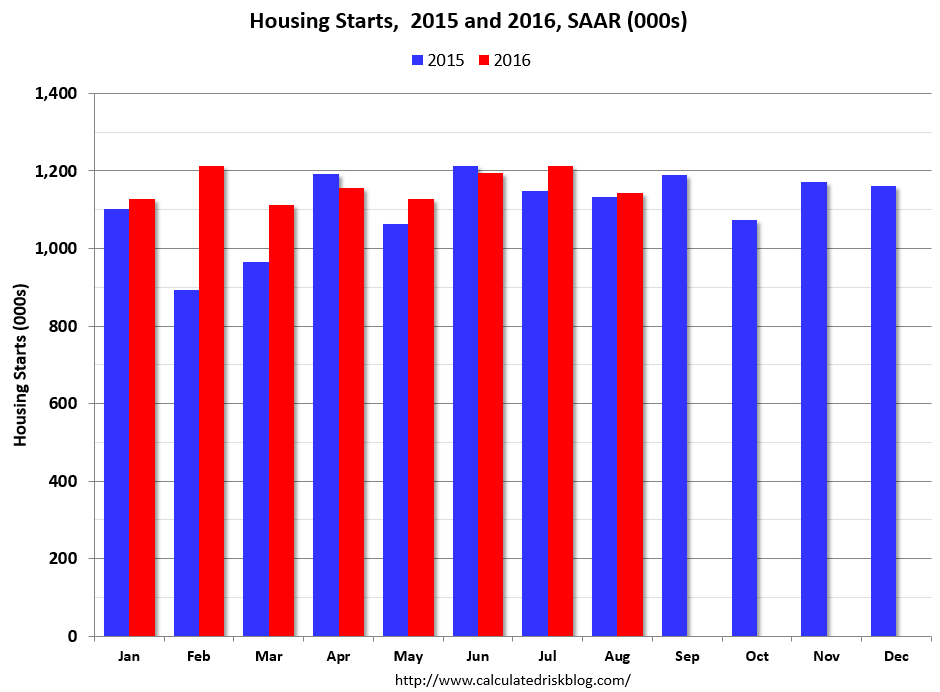
This first graph shows the month to month comparison between 2015 (blue) and 2016 (red).
 Click on graph for larger image.
Year-to-date starts are up 6.1% compared to the same period in 2015. My guess was starts would increase 4% to 8% in 2016, and that still looks about right.
Multi-family starts are up 0.3% year-to-date, and single-family starts are up 9.1% year-to-date.
Below is an update to the graph comparing multi-family starts and completions. Since it usually takes over a year on average to complete a multi-family project, there is a lag between multi-family starts and completions. Completions are important because that is new supply added to the market, and starts are important because that is future new supply (units under construction is also important for employment).
These graphs use a 12 month rolling total for NSA starts and completions.
 The blue line is for multifamily starts and the red line is for multifamily completions.
The rolling 12 month total for starts (blue line) increased steadily over the last few years, and completions (red line) have lagged behind - but completions have been catching up (more deliveries, although this has dipped lately). Completions lag starts by about 12 months.
I think most of the growth in multi-family starts is probably behind us - in fact multi-family starts probably peaked in June 2015 (at 510 thousand SAAR) - although I expect solid multi-family starts for a few more years (based on demographics).
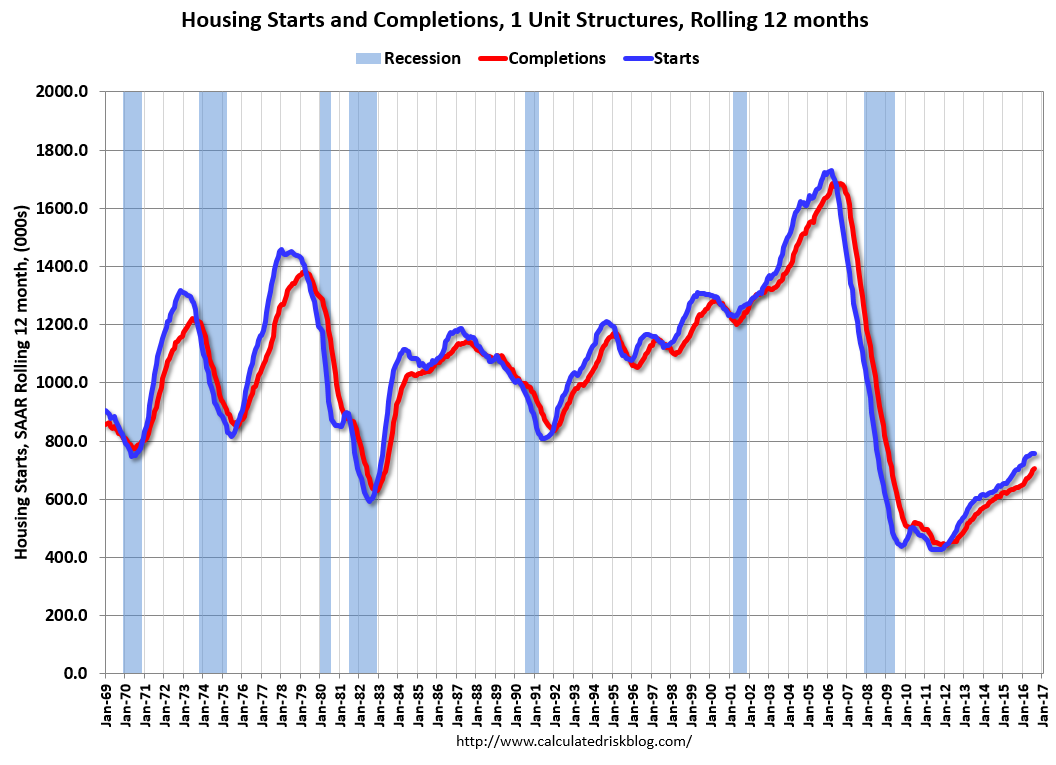 The second graph shows single family starts and completions. It usually only takes about 6 months between starting a single family home and completion - so the lines are much closer. The blue line is for single family starts and the red line is for single family completions.
Note the exceptionally low level of single family starts and completions. The "wide bottom" was what I was forecasting several years ago, and now I expect several years of increasing single family starts and completions.


