 RSS Feed
 by Calculated Risk on 4/30/2015 09:00:00 PM
Thursday, April 30, 2015
Friday: ISM Manufacturing, Auto Sales, Construction Spending
Fannie Mae reported today that the Single-Family Serious Delinquency rate declined in March to 1.78% from 1.83% in February. The serious delinquency rate is down from 2.19% in March 2014, and this is the lowest level since September 2008.
The Fannie Mae serious delinquency rate peaked in February 2010 at 5.59%.
Earlier Freddie Mac reported that the Single-Family serious delinquency rate was declined in March to 1.73%. Freddie's rate is down from 2.20% in March 2014, and is at the lowest level since December 2008. Freddie's serious delinquency rate peaked in February 2010 at 4.20%.
Note: These are mortgage loans that are "three monthly payments or more past due or in foreclosure".
 Click on graph for larger image
The Fannie Mae serious delinquency rate has fallen 0.41 percentage points over the last year - the pace of improvement has slowed - and at that pace the serious delinquency rate will be close to 1% in late 2016.
The "normal" serious delinquency rate is under 1%, so maybe serious delinquencies will be close to normal at the end of 2016. This elevated delinquency rate is mostly related to older loans - the lenders are still working through the backlog, especially in judicial foreclosure states like Florida.
Friday:
• At 10:00 AM ET, ISM Manufacturing Index for April. The consensus is for an increase to 52.0 from 51.5 in March. The ISM manufacturing index indicated expansion at 51.5% in March. The employment index was at 50.0%, and the new orders index was at 51.8%.
• Also at 10:00 AM, Construction Spending for March. The consensus is for a 0.5% increase in construction spending.
• Also at 10:00 AM, University of Michigan's Consumer sentiment index (final for April). The consensus is for a reading of 96.0, up from the preliminary reading of 95.9, and up from the March reading of 93.0.
• All day: Light vehicle sales for April. The consensus is for light vehicle sales to decrease to 16.9 million SAAR in April from 17.05 million in March (Seasonally Adjusted Annual Rate).
Q1 2015 GDP Details on Residential and Commercial Real Estate
by Calculated Risk on 4/30/2015 05:25:00 PM
The BEA released the underlying details for the Q1 advance GDP report today.
Yesterday, the BEA reported that investment in non-residential structures decreased at a 23.1% annual rate in Q1.
All of the decline could be attributed to less petroleum exploration and less investment in electrical. Both declined at a 50% annual rate in Q1.
There was some weakness in lodging investment, but that might be weather related. Excluding petroleum and electrical, non-residential investment in structures was unchanged in Q1.
 Click on graph for larger image.
The first graph shows investment in offices, malls and lodging as a percent of GDP. Office, mall and lodging investment has increased a little recently, but from a very low level.
Investment in offices increased slightly in Q1, is down about 43% from the recent peak (as a percent of GDP) and increasing from a very low level - and is still below the lows for previous recessions (as percent of GDP). With the high office vacancy rate, office investment will only increase slowly.
Investment in multimerchandise shopping structures (malls) peaked in 2007 and is down about 59% from the peak. The vacancy rate for malls is still very high, so investment will probably stay low for some time.
Lodging investment declined in Q1, but with the hotel occupancy rate near record levels, it is likely that hotel investment will increase in the near future. Lodging investment peaked at 0.31% of GDP in Q3 2008 and is down about 65%.
 The second graph is for Residential investment components as a percent of GDP. According to the Bureau of Economic Analysis, RI includes new single family structures, multifamily structures, home improvement, Brokers’ commissions and other ownership transfer costs, and a few minor categories (dormitories, manufactured homes).
Investment in single family structures is now back to being the top category for residential investment. Home improvement was the top category for twenty consecutive quarters following the housing bust ... but now investment in single family structures has been back on top for the last 6 quarters and will probably stay there for a long time.
However - even though investment in single family structures has increased from the bottom - single family investment is still very low, and still below the bottom for previous recessions as a percent of GDP. I expect further increases over the next few years.
Investment in single family structures was $204 billion (SAAR) (over 1.1% of GDP).
Investment in home improvement was at a $182 billion Seasonally Adjusted Annual Rate (SAAR) in Q1 (just over 1.0% of GDP).
These graphs show investment is generally increasing, but from a very low level.
Lawler: More Builder Results (updated table)
by Calculated Risk on 4/30/2015 03:13:00 PM
Housing economist Tom Lawler sent me this updated table of builder results for Q1.
For these seven builders, net orders were up 19.9% year-over-year. Although cancellations are handled differently, this is about the same year-over-year increase for Q1 as for New Home sales as reported by the Census Bureau.
The average closing price is only up slightly this year following a sharp increase in 2014.
From Tom Lawler:
Net orders per active community for the seven builders combined were up 13.5% YOY, while their combined order backlog at the end of March was up 13.8% YOY.
| Net Orders | Settlements | Average Closing Price | |||||||
|---|---|---|---|---|---|---|---|---|---|
| Qtr. Ended: | 3/15 | 3/14 | % Chg | 3/15 | 3/14 | % Chg | 3/15 | 3/14 | % Chg |
| D.R. Horton | 11,135 | 8,569 | 29.9% | 8,243 | 6,194 | 33.1% | $281,305 | 271,230 | 3.7% |
| PulteGroup | 5,139 | 4,863 | 5.7% | 3,365 | 3,436 | -2.1% | $323,000 | 317,000 | 1.9% |
| NVR | 3,926 | 3,325 | 18.1% | 2,534 | 2,211 | 14.6% | $371,000 | 361,400 | 2.7% |
| The Ryland Group | 2,389 | 2,186 | 9.3% | 1,463 | 1,470 | -0.5% | $343,000 | 327,000 | 4.9% |
| Beazer Homes | 1,698 | 1,390 | 22.2% | 936 | 977 | -4.2% | $305,800 | 272,400 | 12.3% |
| Meritage Homes | 1,979 | 1,525 | 29.8% | 1,335 | 1,109 | 20.4% | $387,000 | 366,000 | 5.7% |
| M/I Homes | 1,108 | 982 | 12.8% | 717 | 732 | -2.0% | $325,000 | 299,000 | 8.7% |
| Total | 27,374 | 22,840 | 19.9% | 18,593 | 16,129 | 15.3% | $316,437 | $306,271 | 3.3% |
Earlier from the BEA: Personal Income increased slightly in March, Core PCE prices up 1.3% year-over-year
by Calculated Risk on 4/30/2015 11:40:00 AM
Earlier the BEA released the Personal Income and Outlays report for March:
Personal income increased $6.2 billion, or less than 0.1 percent ... in March, according to the Bureau of Economic Analysis. Personal consumption expenditures (PCE) increased $53.4 billion, or 0.4 percent.The following graph shows real Personal Consumption Expenditures (PCE) through March 2015 (2009 dollars). Note that the y-axis doesn't start at zero to better show the change.
...
Real PCE -- PCE adjusted to remove price changes -- increased 0.3 percent in March, in contrast to a decrease of less than 0.1 percent in February. ... The price index for PCE increased 0.2 percent in March, the same increase as in February. The PCE price index, excluding food and energy, increased 0.1 percent in March, the same increase as in February.
The March price index for PCE increased 0.3 percent from March a year ago. The March PCE price index, excluding food and energy, increased 1.3 percent from March a year ago.
 Click on graph for larger image.
The dashed red lines are the quarterly levels for real PCE.
On inflation: the PCE price index as up 0.3% year-over-year (the decline in oil prices pushed down the headline price index). However core PCE is only up 1.3% year-over-year - still way below the Fed's target.
Employment Cost Index increases 0.7% in Q1, Up 2.6% YoY
by Calculated Risk on 4/30/2015 09:09:00 AM
Note: On a monthly basis, the focus is on “Average Hourly Earnings” from the Current Employment Statistics (CES) (aka "Establishment") employment report.
There are also two quarterly sources for earnings data: 1) “Hourly Compensation,” from the BLS’s Productivity and Costs; and 2) the Employment Cost Index which includes wage/salary and benefit compensation. All three data series are different.
Here is the Q1 ECI from the BLS: EMPLOYMENT COST INDEX - MARCH 2015
Compensation costs for civilian workers increased 0.7 percent, seasonally adjusted, for the 3-month period ending March 2015, the U.S. Bureau of Labor Statistics reported today. Wages and salaries (which make up about 70 percent of compensation costs) increased 0.7 percent, and benefits (which make up the remaining 30 percent of compensation) increased 0.6 percent.
Compensation costs for civilian workers increased 2.6 percent for the 12-month period ending March 2015, rising from the March 2014 increase in compensation costs of 1.8 percent. Wages and salaries increased 2.6 percent for the 12-month period ending March 2015, which was higher than the 1.6-percent increase in March 2014. Benefit costs increased 2.7 percent for the 12-month period ending March 2015, compared with a 2.1-percent increase for the 12-month period ending March 2014.
 Click on graph for larger image.
This graph shows the year-over-year change in Total Compensation and Wages and Salaries using the quarterly wage data from the Employment Cost Index. Both increased 2.6 year-over-year in Q1 and suggest compensation is increasing.
Weekly Initial Unemployment Claims decreased to 262,000, Lowest since April 2000
by Calculated Risk on 4/30/2015 08:30:00 AM
The DOL reported:
In the week ending April 25, the advance figure for seasonally adjusted initial claims was 262,000, a decrease of 34,000 from the previous week's revised level. This is the lowest level for initial claims since April 15, 2000 when it was 259,000. The previous week's level was revised up by 1,000 from 295,000 to 296,000. The 4-week moving average was 283,750, a decrease of 1,250 from the previous week's revised average. The previous week's average was revised up by 500 from 284,500 to 285,000.The previous week was revised up 1,000.
There were no special factors impacting this week's initial claims.
The following graph shows the 4-week moving average of weekly claims since January 2000.
 Click on graph for larger image.
The dashed line on the graph is the current 4-week average. The four-week average of weekly unemployment claims decreased to 283,750.
This was well below the consensus forecast of 290,000, and the low level of the 4-week average suggests few layoffs.
Wednesday, April 29, 2015
Brief comments on the FOMC Statement and ECI
by Calculated Risk on 4/29/2015 06:39:00 PM
For the first time in probably 10 years, I had a personal time conflict at the time of the FOMC statement release. Luckily I wasn't worried about a "surprise" ... but the next few meetings could be very interesting (I don't want to miss those releases)!
From Tim Duy: FOMC Snoozer
The FOMC concluded their meeting today, and the result left Fed watchers struggling to find something interesting to say. ...And on the Employment Cost Index tomorrow from Business Insider: DEUTSCHE BANK: 'Hold on to your chair...'
The FOMC statement provides little new information about the timing or pace of future rates hikes. Even if you believe, as I do, that the first quarter weakness will prove to be largely transitory, the Fed is not willing to take that chance. They will need better data to justify a rate hike, and that need is pushing the timing of a policy change ever-deeper into 2015. There just isn't that much data between now and June to move the needle on policy. You need the jobs and inflation data to turn sharply better to pull the Fed back to June. It could happen, but I am not confident it will happen.
Bottom Line: Wait and see - that's the message of this statement.
In an email blast with the subject line "Hold on to your chair," Deutsche Bank's Torsten Slok warns Thursday's report could once again be a catalyst for volatility as it could have implications for monetary policy, in particular the timing of the Federal Reserve's first interest rate hike.CR Note: I don't think this ranks as "hold on to your chair", but a consensus reading might be a sign that wages are picking up a little.
"Because of year-over-year base effects we could see a solid uptrend in wages," Slok wrote. "This kind of increase would have to make the Fed feel better about its inflation forecast, and recall that Chair Yellen has said that rising wage and price inflation is not a precondition for liftoff."
Thursday:
• At 8:30 AM ET, the initial weekly unemployment claims report will be released. The consensus is for claims to decrease to 290 thousand from 295 thousand.
• Also at 8:30 AM, Personal Income and Outlays for March. The consensus is for a 0.2% increase in personal income, and for a 0.5% increase in personal spending. And for the Core PCE price index to increase 0.2%.
• Also at 8:30 AM, the Q1 Employment Cost Index. The consensus is for a 0.6% increase in this index.
• At 9:45 AM, Chicago Purchasing Managers Index for April. The consensus is for a reading of 50.0, up from 46.3 in March.
FOMC Statement: Slowdown "in part reflecting transitory factors"
by Calculated Risk on 4/29/2015 03:17:00 PM
I was out, but no surprises.
FOMC Statement:
Information received since the Federal Open Market Committee met in March suggests that economic growth slowed during the winter months, in part reflecting transitory factors. The pace of job gains moderated, and the unemployment rate remained steady. A range of labor market indicators suggests that underutilization of labor resources was little changed. Growth in household spending declined; households' real incomes rose strongly, partly reflecting earlier declines in energy prices, and consumer sentiment remains high. Business fixed investment softened, the recovery in the housing sector remained slow, and exports declined. Inflation continued to run below the Committee's longer-run objective, partly reflecting earlier declines in energy prices and decreasing prices of non-energy imports. Market-based measures of inflation compensation remain low; survey-based measures of longer-term inflation expectations have remained stable.
Consistent with its statutory mandate, the Committee seeks to foster maximum employment and price stability. Although growth in output and employment slowed during the first quarter, the Committee continues to expect that, with appropriate policy accommodation, economic activity will expand at a moderate pace, with labor market indicators continuing to move toward levels the Committee judges consistent with its dual mandate. The Committee continues to see the risks to the outlook for economic activity and the labor market as nearly balanced. Inflation is anticipated to remain near its recent low level in the near term, but the Committee expects inflation to rise gradually toward 2 percent over the medium term as the labor market improves further and the transitory effects of declines in energy and import prices dissipate. The Committee continues to monitor inflation developments closely.
To support continued progress toward maximum employment and price stability, the Committee today reaffirmed its view that the current 0 to 1/4 percent target range for the federal funds rate remains appropriate. In determining how long to maintain this target range, the Committee will assess progress--both realized and expected--toward its objectives of maximum employment and 2 percent inflation. This assessment will take into account a wide range of information, including measures of labor market conditions, indicators of inflation pressures and inflation expectations, and readings on financial and international developments. The Committee anticipates that it will be appropriate to raise the target range for the federal funds rate when it has seen further improvement in the labor market and is reasonably confident that inflation will move back to its 2 percent objective over the medium term.
The Committee is maintaining its existing policy of reinvesting principal payments from its holdings of agency debt and agency mortgage-backed securities in agency mortgage-backed securities and of rolling over maturing Treasury securities at auction. This policy, by keeping the Committee's holdings of longer-term securities at sizable levels, should help maintain accommodative financial conditions.
When the Committee decides to begin to remove policy accommodation, it will take a balanced approach consistent with its longer-run goals of maximum employment and inflation of 2 percent. The Committee currently anticipates that, even after employment and inflation are near mandate-consistent levels, economic conditions may, for some time, warrant keeping the target federal funds rate below levels the Committee views as normal in the longer run.
Voting for the FOMC monetary policy action were: Janet L. Yellen, Chair; William C. Dudley, Vice Chairman; Lael Brainard; Charles L. Evans; Stanley Fischer; Jeffrey M. Lacker; Dennis P. Lockhart; Jerome H. Powell; Daniel K. Tarullo; and John C. Williams.
Q1 GDP: Investment
by Calculated Risk on 4/29/2015 11:59:00 AM
Note: I'll probably be late to the FOMC analysis party today. No change in policy is expected. Here is the link for the statement at 2:00 PM ET.
The graph below shows the contribution to GDP from residential investment, equipment and software, and nonresidential structures (3 quarter trailing average). This is important to follow because residential investment tends to lead the economy, equipment and software is generally coincident, and nonresidential structure investment trails the economy.
In the graph, red is residential, green is equipment and software, and blue is investment in non-residential structures. So the usual pattern - both into and out of recessions is - red, green, blue.
The dashed gray line is the contribution from the change in private inventories.
Note: This can't be used blindly. Residential investment is so low as a percent of the economy that the small decline early last year was not a concern.
 Click on graph for larger image.
Residential investment (RI) increased at a 1.3% annual rate in Q1. Equipment investment increased at a 0.1% annual rate, and investment in non-residential structures decreased at a 23.1% annual rate. On a 3 quarter trailing average basis, RI is slightly positive (red), equipment is a slower positive (green), and nonresidential structures are down (blue).
Note: Nonresidential investment in structures typically lags the recovery, however investment in energy and power provided a boost early in this recovery - and is now causing a decline.
I expect investment to be solid going forward (except for energy and power), and for the economy to grow at a decent pace for the remained of 2015.

The second graph shows residential investment as a percent of GDP.
Residential Investment as a percent of GDP has been increasing, but it still below the levels of previous recessions - and I expect RI to continue to increase for the next few years.
I'll break down Residential Investment into components after the GDP details are released.
Note: Residential investment (RI) includes new single family structures, multifamily structures, home improvement, broker's commissions, and a few minor categories.
 The third graph shows non-residential investment in structures, equipment and "intellectual property products". Investment is generally trending up as a percent of GDP, except for investment in energy and power.
I'll add details for investment in offices, malls and hotels after the supplemental data is released.
NAR: Pending Home Sales Index increased 1.1% in March, up 11% year-over-year
by Calculated Risk on 4/29/2015 10:00:00 AM
From the NAR: Pending Home Sales Increase in March for Third Consecutive Month
The Pending Home Sales Index, a forward-looking indicator based on contract signings, climbed 1.1 percent to 108.6 in March from an upward revision of 107.4 in February and is now 11.1 percent above March 2014 (97.7). The index has now increased year-over-year for seven consecutive months and is at its highest level since June 2013 (109.4).This was close to expectations of a 1.0% increase.
...
The PHSI in the Northeast fell (1.5 percent) for the fourth straight month to 80.2 in March, but is still 0.6 percent above a year ago. In the Midwest the index declined 2.5 percent to 107.5 in March, but is 11.3 percent above March 2014.
Pending home sales in the South increased 4.0 percent to an index of 126.5 in March and are 12.4 percent above last March. The index in the West rose 1.7 percent in March to 103.7, and is now 15.6 percent above a year ago.
Note: Contract signings usually lead sales by about 45 to 60 days, so this would usually be for closed sales in April and May.
BEA: Real GDP increased at 0.2% Annualized Rate in Q1
by Calculated Risk on 4/29/2015 08:30:00 AM
From the BEA: Gross Domestic Product: First Quarter 2015 (Advance Estimate)
Real gross domestic product -- the value of the production of goods and services in the United States, adjusted for price changes -- increased at an annual rate of 0.2 percent in the first quarter of 2015, according to the "advance" estimate released by the Bureau of Economic Analysis. In the fourth quarter, real GDP increased 2.2 percent.The advance Q1 GDP report, with 0.2% annualized growth, was below expectations of a 1.0% increase.
...
The increase in real GDP in the first quarter primarily reflected positive contributions from personal consumption expenditures (PCE) and private inventory investment that were partly offset by negative contributions from exports, nonresidential fixed investment, and state and local government spending. Imports, which are a subtraction in the calculation of GDP, increased.
The deceleration in real GDP growth in the first quarter reflected a deceleration in PCE, downturns in exports, in nonresidential fixed investment, and in state and local government spending, and a deceleration in residential fixed investment that were partly offset by a deceleration in imports and upturns in private inventory investment and in federal government spending.
The price index for gross domestic purchases, which measures prices paid by U.S. residents, decreased 1.5 percent in the first quarter, compared with a decrease of 0.1 percent in the fourth. Excluding food and energy prices, the price index for gross domestic purchases increased 0.3 percent, compared with an increase of 0.7 percent.
Real personal consumption expenditures increased 1.9 percent in the first quarter, compared with an increase of 4.4 percent in the fourth.
Personal consumption expenditures (PCE) increased at a 1.9% annualized rate.
The key negatives were trade (subtracted 1.25 percentage point) and investment in nonresidential structures (subtracted 0.75 percentage points). Trade was impacted by the West Coast port issues, and the decline in nonresidential structures was probably due to bad weather and less investment in oil and gas.
MBA: Mortgage Applications Decrease in Latest Weekly Survey, Purchase Apps up 21% YoY
by Calculated Risk on 4/29/2015 07:00:00 AM
From the MBA: Mortgage Applications Decrease in Latest MBA Weekly Survey
Mortgage applications decreased 2.3 percent from one week earlier, according to data from the Mortgage Bankers Association’s (MBA) Weekly Mortgage Applications Survey for the week ending April 24, 2015. ...
The Refinance Index decreased 4 percent from the previous week. The seasonally adjusted Purchase Index was unchanged from one week earlier. The unadjusted Purchase Index increased 1 percent compared with the previous week and was 21 percent higher than the same week one year ago.
...
The average contract interest rate for 30-year fixed-rate mortgages with conforming loan balances ($417,000 or less) increased to 3.85 percent from 3.83 percent, with points increasing to 0.35 from 0.32 (including the origination fee) for 80 percent loan-to-value ratio (LTV) loans.
emphasis added
 Click on graph for larger image.
The first graph shows the refinance index.
2014 was the lowest year for refinance activity since year 2000.
2015 will probably see a little more refinance activity than in 2014, but not a large refinance boom.
 The second graph shows the MBA mortgage purchase index.
 According to the MBA, the unadjusted purchase index is 21% higher than a year ago.
Tuesday, April 28, 2015
Wednesday: GDP, FOMC
by Calculated Risk on 4/28/2015 09:00:00 PM
From Bloomberg: Fed Decision Day Guide: From Cooling Economy to Forward Guidance
Investors will scrutinize changes to the description of the economy for hints on the likely timing of liftoff after policy makers all but ruled out an interest-rate increase at this meeting.Wednesday:
Expectations for the first increase since 2006 have shifted out to September from June as the economy weakened in the first quarter ...
Inflation: Signs that consumer prices are stabilizing following a rebound in oil costs could encourage policy makers to tweak their language on inflation. ...
• At 7:00 AM ET, the Mortgage Bankers Association (MBA) will release the results for the mortgage purchase applications index.
• At 8:30 AM, Gross Domestic Product, 1st quarter 2015 (advance estimate). The consensus is that real GDP increased 1.0% annualized in Q1.
• At 10:00 AM, Pending Home Sales Index for March. The consensus is for a 1.0% increase in the index.
• At 2:00 PM, FOMC Meeting Statement. No change to policy is expected.
A Comment on House Prices: Real Prices and Price-to-Rent Ratio in February
by Calculated Risk on 4/28/2015 04:37:00 PM
The expected slowdown in year-over-year price increases has occurred. In October 2013, the National index was up 10.9% year-over-year (YoY). In February 2015, the index was up 4.2% YoY. However the YoY change has only declined slightly over the last six months.
Looking forward, I expect the YoY increases for the indexes to move more sideways (as opposed to down). Two points: 1) I don't expect (as some) for the indexes to turn negative YoY (in 2015) , and 2) I think most of the slowdown on a YoY basis is now behind us. This slowdown in price increases was expected by several key analysts, and I think it was good news for housing and the economy.
In the earlier post, I graphed nominal house prices, but it is also important to look at prices in real terms (inflation adjusted). Case-Shiller, CoreLogic and others report nominal house prices. As an example, if a house price was $200,000 in January 2000, the price would be close to $276,000 today adjusted for inflation (36%). That is why the second graph below is important - this shows "real" prices (adjusted for inflation).
It has been almost ten years since the bubble peak. In the Case-Shiller release this morning, the National Index was reported as being 7.6% below the bubble peak. However, in real terms, the National index is still about 21% below the bubble peak.
Nominal House Prices
 The first graph shows the monthly Case-Shiller National Index SA, the monthly Case-Shiller Composite 20 SA, and the CoreLogic House Price Indexes (through January) in nominal terms as reported.
In nominal terms, the Case-Shiller National index (SA) is back to May 2005 levels, and the Case-Shiller Composite 20 Index (SA) is back to December 2004 levels, and the CoreLogic index (NSA) is back to February 2005.
Real House Prices
 The second graph shows the same three indexes in real terms (adjusted for inflation using CPI less Shelter). Note: some people use other inflation measures to adjust for real prices.
In real terms, the National index is back to June 2003 levels, the Composite 20 index is back to March 2003, and the CoreLogic index back to April 2003.
In real terms, house prices are back to 2003 levels.
Price-to-Rent
In October 2004, Fed economist John Krainer and researcher Chishen Wei wrote a Fed letter on price to rent ratios: House Prices and Fundamental Value. Kainer and Wei presented a price-to-rent ratio using the OFHEO house price index and the Owners' Equivalent Rent (OER) from the BLS.
 Here is a similar graph using the Case-Shiller National, Composite 20 and CoreLogic House Price Indexes.
This graph shows the price to rent ratio (January 1998 = 1.0).
On a price-to-rent basis, the Case-Shiller National index is back to May 2003 levels, the Composite 20 index is back to December 2002 levels, and the CoreLogic index is back to March 2003.
In real terms, and as a price-to-rent ratio, prices are mostly back to 2003 levels - and maybe moving a little sideways now.
HVS: Q1 2015 Homeownership and Vacancy Rates
by Calculated Risk on 4/28/2015 01:45:00 PM
The Census Bureau released the Residential Vacancies and Homeownership report for Q1 2015.
This report is frequently mentioned by analysts and the media to track household formation, the homeownership rate, and the homeowner and rental vacancy rates. However, there are serious questions about the accuracy of this survey.
This survey might show the trend, but I wouldn't rely on the absolute numbers. The Census Bureau is investigating the differences between the HVS, ACS and decennial Census, and analysts probably shouldn't use the HVS to estimate the excess vacant supply or household formation, or rely on the homeownership rate, except as a guide to the trend.
 Click on graph for larger image.
The Red dots are the decennial Census homeownership rates for April 1st 1990, 2000 and 2010. The HVS homeownership rate decreased to 63.7% in Q1, from 64.0% in Q4.
I'd put more weight on the decennial Census numbers - and given changing demographics, the homeownership rate is probably close to a bottom.
 The HVS homeowner vacancy was unchanged at 1.9% in Q1.
Are these homes becoming rentals?
Once again - this probably shows the general trend, but I wouldn't rely on the absolute numbers.
 The rental vacancy rate increased in Q1 to 7.1% from 7.0% in Q4.
I think the Reis quarterly survey (large apartment owners only in selected cities) is a much better measure of the rental vacancy rate.
The quarterly HVS is the most timely survey on households, but there are many questions about the accuracy of this survey.
Richmond Fed: "Manufacturing Sector Activity Remained Soft"
by Calculated Risk on 4/28/2015 10:22:00 AM
From the Richmond Fed: Manufacturing Sector Activity Remained Soft; Employment and Wages Grew Mildly
Overall, manufacturing conditions remained soft in April. The composite index for manufacturing moved to a reading of −3 following last month's reading of −8. The index for shipments and the index for new orders gained seven points in April, although both indicators finished at only −6.This is the last of the regional surveys for April. Here is a graph comparing the regional Fed surveys and the ISM manufacturing index:
Manufacturing employment edged up a point this month, with the index ending at 7. The average workweek lengthened, moving the index up eight points to end at 4. The average wage index added one point to end at 9.
emphasis added
 Click on graph for larger image.
The New York and Philly Fed surveys are averaged together (yellow, through April), and five Fed surveys are averaged (blue, through April) including New York, Philly, Richmond, Dallas and Kansas City. The Institute for Supply Management (ISM) PMI (red) is through March (right axis).
It seems likely the ISM index will be weak again, and could even show contraction for April. The ISM Manufacturing Index for April will be released on Friday, May 1st, and the consensus is for an increase to 52.0 from 51.5 in March.
Case-Shiller: National House Price Index increased 4.2% year-over-year in February
by Calculated Risk on 4/28/2015 09:17:00 AM
S&P/Case-Shiller released the monthly Home Price Indices for February ("February" is a 3 month average of December, January and February prices).
This release includes prices for 20 individual cities, two composite indices (for 10 cities and 20 cities) and the monthly National index.
Note: Case-Shiller reports Not Seasonally Adjusted (NSA), I use the SA data for the graphs.
From S&P: Widespread Gains in Home Prices for February According to the S&P/Case-Shiller Home Price Indices
Data released for February 2015 show that home prices continued their rise across the country over the last 12 months. ... Both the 10-City and 20-City Composites saw larger year-over-year increases in February compared to January. The 10-City Composite gained 4.8% year-over-year, up from 4.3% in January. The 20-City Composite gained 5.0% year-over-year, compared to a 4.5% increase in January. The S&P/Case-Shiller U.S. National Home Price Index, which covers all nine U.S. census divisions, recorded a 4.2% annual gain in February 2015, weaker than the 4.4% increase in January 2015.
...
The National Index rebounded in February, reporting a 0.1% change for the month. Both the 10- and 20-City Composites reported significant month-over-month increases of 0.5%, their largest increase since July 2014. Of the sixteen cities that reported increases, San Francisco and Denver led all cities in February with increases of 2.0%and 1.4%. Cleveland reported the largest drop as prices fell 1.0%. Las Vegas and Boston reported declines of -0.3% and -0.2% respectively.
...
“Home prices continue to rise and outpace both inflation and wage gains,” said David M. Blitzer, Managing Director and Chairman of the Index Committee at S&P Dow Jones Indices. “The S&P/Case-Shiller National Index has seen 34 consecutive months with positive year-over-year gains; all 20 cities have shown year-over-year gains every month since the end of 2012. While prices are certainly rebounding, only two cities – Denver and Dallas – have surpassed their housing boom peaks. Nationally, prices are almost 10% below the high set in July 2006. Las Vegas fell 61.7% peak to trough and has the farthest to go to set a new high; it is 41.5% below its high. If a complete recovery means new highs all around, we’re not there yet.
“A better sense of where home prices are can be seen by starting in January 2000, before the housing boom accelerated, and looking at real or inflation adjusted numbers. Based on the S&P/Case-Shiller National Home Price Index, prices rose 66.8% before adjusting for inflation from January 2000 to February 2015; adjusted for inflation, this is 27.9% or a 1.7% annual rate. The highest price gain over the last 15 years was in Los Angeles with a 4.3% real annual rate; the lowest was Detroit with a -3.6% real annual rate. While nationally, prices are recovering, new construction of single family homes remains very weak despite low vacancy rates among both renters and owner-occupied homes.”
emphasis added
 Click on graph for larger image.
 The first graph shows the nominal seasonally adjusted Composite 10, Composite 20 and National indices (the Composite 20 was started in January 2000).
The Composite 10 index is off 15.2% from the peak, and up 0.9% in February (SA).
The Composite 20 index is off 14.1% from the peak, and up 0.9% (SA) in February.
The National index is off 7.6% from the peak, and up 0.4% (SA) in February. The National index is up 24.3% from the post-bubble low set in December 2011 (SA).
 The second graph shows the Year over year change in all three indices.
The Composite 10 SA is up 4.8% compared to February 2014.
The Composite 20 SA is up 5.0% year-over-year..
The National index SA is up 4.2% year-over-year.
Prices increased (SA) in all 20 of the 20 Case-Shiller cities in February seasonally adjusted. (Prices increased in 16 of the 20 cities NSA) Prices in Las Vegas are off 41.1% from the peak, and prices in Denver and Dallas are at new highs (SA).
 The last graph shows the bubble peak, the post bubble minimum, and current nominal prices relative to January 2000 prices for all the Case-Shiller cities in nominal terms.
As an example, at the peak, prices in Phoenix were 127% above the January 2000 level. Then prices in Phoenix fell slightly below the January 2000 level, and are now up 50% above January 2000 (44% nominal gain in 14 years).
These are nominal prices, and real prices (adjusted for inflation) are up about 38% since January 2000 - so the increase in Phoenix from January 2000 until now is about 10% above the change in overall prices due to inflation.
Two cities - Denver (up 64% since Jan 2000) and Dallas (up 47% since Jan 2000) - are above the bubble highs (a few other Case-Shiller Comp 20 city are close - Boston and, Charlotte). Detroit prices are still below the January 2000 level.
This was below the consensus forecast for a 4.6% YoY increase for the National index. I'll have more on house prices later.
Monday, April 27, 2015
Tuesday: Case-Shiller House Prices
by Calculated Risk on 4/27/2015 09:34:00 PM
Tuesday:
• At 9:00 AM ET, S&P/Case-Shiller House Price Index for February. Although this is the February report, it is really a 3 month average of December, January and February prices. The consensus is for a 4.6% year-over-year increase in the National Index for February. The Zillow forecast is for the National Index to increase 4.5% year-over-year in February, and for prices to increase 0.5% month-to-month seasonally adjusted.
• At 10:00 AM, the Richmond Fed Survey of Manufacturing Activity for April.
• Also at 10:00 AM, Conference Board's consumer confidence index for April. The consensus is for the index to increase to 102.5 from 101.3.
• Also at 10:00 AM, the Q1 Housing Vacancies and Homeownership report from the Census Bureau. This report is frequently mentioned by analysts and the media to report on the homeownership rate, and the homeowner and rental vacancy rates. However, this report doesn't track with other measures (like the decennial Census and the ACS).
Freddie Mac: Mortgage Serious Delinquency rate declined in March
by Calculated Risk on 4/27/2015 06:21:00 PM
Freddie Mac reported that the Single-Family serious delinquency rate declined in March to 1.73%, down from 1.81% in February. Freddie's rate is down from 2.20% in March 2014, and the rate in March was the lowest level since December 2008.
Freddie's serious delinquency rate peaked in February 2010 at 4.20%.
These are mortgage loans that are "three monthly payments or more past due or in foreclosure".
Note: Fannie Mae will report their Single-Family Serious Delinquency rate for March in a few days.
 Click on graph for larger image
Although the rate is declining, the "normal" serious delinquency rate is under 1%.
The serious delinquency rate has fallen 0.47 percentage points over the last year - and the rate of improvement has slowed recently - but at that rate of improvement, the serious delinquency rate will not be below 1% until late 2016.
So even though distressed sales are declining, I expect an above normal level of Fannie and Freddie distressed sales through 2016 (mostly in judicial foreclosure states).
Merrill Lynch: FOMC Preview
by Calculated Risk on 4/27/2015 04:40:00 PM
The FOMC meeting starts tomorrow and the statement will be released Wednesday at 2:00 PM ET. No change in policy is expected.
Here is a preview from Merrill Lynch:
At the March FOMC meeting, the Fed took any policy changes in April off the table. We don’t expect similar language about June policy at the April meeting. We do expect a more somber description of recent activity. This dovish shift in the nearterm view should translate into significantly lower odds of a June rate hike in our view. But any market participants who seek an explicit signal that June also is off the table are likely to be disappointed: the FOMC will want to maintain as much policy flexibility as possible. Fed officials also should stay optimistic about reaching their dual mandate objectives over time. The minutes, released in three weeks’ time, are once again likely to be more informative about the state of the Fed debate.
Without a press conference or updated projections in April, the FOMC statement will be the focus. The main change is likely to be an acknowledgment of the broadly weaker data for consumption, manufacturing and the labor market in recent months. The Committee may suggest temporary factors (i.e., weather and the West Coast port shutdown) account for much of the 1Q slowdown and thus leave the mediumterm outlook unchanged. Meanwhile, the recent firming of core inflation measures may give the FOMC more confidence that downside inflation risks — which rose in the March SEP — have faded. As such, we look for no significant changes in the inflation outlook, although we continue to believe the Fed is under-estimating the persistence of global disinflationary forces.
The March statement dropped “patient,” which had been generally interpreted to mean no rate hikes for the current and subsequent meeting, in order to have more flexibility for setting policy at the June meeting and beyond. To make certain the markets didn’t misinterpret the change in guidance as a sign of imminent liftoff, the FOMC stated that an April rate hike remained “unlikely” and that dropping “patient” did not mean the FOMC had decided on the timing of liftoff. As these clarifications are no longer needed, we expect they will be dropped. The statement may add that the Fed anticipates a “gradual” normalization process, to complement existing language that economic conditions may warrant lower-than-normal policy rates for some time. We expect no changes to the reinvestment program.
Vehicle Sales Forecasts: Best April in "13 Years"
by Calculated Risk on 4/27/2015 01:11:00 PM
The automakers will report April vehicle sales on Friday, May 1st. Sales in March were at 17.05 million on a seasonally adjusted annual rate basis (SAAR), and it appears sales will be strong in April too. April sales (SA) will probably be the best since 2005.
Note: There were 26 selling days in April, the same as last year. Here are a couple of forecasts:
From WardsAuto: Forecast: April Daily Sales to Reach 13-Year High
A WardsAuto forecast calls for U.S. automakers to deliver 1.474 million light vehicles this month.From J.D. Power: New-Vehicle Sales in April Strongest for the Month in a Decade
The forecasted daily sales rate of 56,706 over 26 days represents a 6.7% improvement from like-2014 (also 26 days) and would mark the industry’s best April, on a daily basis, since 2002, as well as the highest April sales volume since 2000.
...
The report puts the seasonally adjusted annual rate of sales for the month at 16.8 million units, down from March’s 17.1 million SAAR, but some 800,000 units above year-ago and slightly ahead of the 16.8 million first-quarter SAAR.
Total light-vehicle sales are projected to reach 1,463,700, a 5 percent increase compared with April 2014 and the highest level for the month since April 2005 when 1,500,624 new vehicles were sold. [Total forecast 16.6 million SAAR]Another strong month for auto sales.
Dallas Fed: Texas Manufacturing Activity Weakens Again
by Calculated Risk on 4/27/2015 10:36:00 AM
From the Dallas Fed: Texas Manufacturing Activity Weakens Again
Texas factory activity declined in April, according to business executives responding to the Texas Manufacturing Outlook Survey. The production index, a key measure of state manufacturing conditions, posted a second negative reading in a row, coming in at -4.7.The last of the regional Fed surveys (Richmond Fed) will be released tomorrow. Three of the four surveys released so far have indicated contraction in April (especially Dallas due to lower oil prices).
Other measures of current manufacturing activity also reflected continued contraction in April. The new orders index edged up but remained negative at -14. The growth rate of orders index held steady at -15.5, posting its sixth consecutive negative reading.
...
Perceptions of broader business conditions remained quite pessimistic for a fourth month in a row. The general business activity index stayed negative but ticked up to -16 in April, while the company outlook index moved down to -7.8, reaching its lowest reading in nearly two and a half years.
Labor market indicators reflected slight employment gains but shorter workweeks. The April employment index rebounded to 1.8 after dipping below zero last month.
emphasis added
Black Knight: House Price Index up 0.7% in February, 4.6% year-over-year
by Calculated Risk on 4/27/2015 09:04:00 AM
Note: I follow several house price indexes (Case-Shiller, CoreLogic, Black Knight, Zillow, FHFA, FNC and more). Note: Black Knight uses the current month closings only (not a three month average like Case-Shiller or a weighted average like CoreLogic), excludes short sales and REOs, and is not seasonally adjusted.
From Black Knight: Black Knight Home Price Index Report: February Transactions – U.S. Home Prices Up 0.7 Percent for the Month; Up 4.6 Percent Year-Over-Year
Today, the Data and Analytics division of Black Knight Financial Services released its latest Home Price Index (HPI) report, based on February 2015 residential real estate transactions. The Black Knight HPI combines the company’s extensive property and loan-level databases to produce a repeat sales analysis of home prices as of their transaction dates every month for each of more than 18,500 U.S. ZIP codes. The Black Knight HPI represents the price of non-distressed sales by taking into account price discounts for REO and short sales.The Black Knight HPI increased 0.7% percent in February, and is off 9.5% from the peak in June 2006 (not adjusted for inflation).
For a more in-depth review of this month’s home price trends, including detailed looks at the 20 largest states and 40 largest metros, please download the full Black Knight HPI Report at http://www.bkfs.com/Data/DataReports/BKFS_HPI_Feb2015_Report.pdf
The year-over-year increase in the index has been about the same for the last six months.
The press release has data for the 20 largest states, and 40 MSAs.
Black Knight shows prices off 40.7% from the peak in Las Vegas, off 34.8% in Orlando, and 31.7% off from the peak in Riverside-San Bernardino, CA (Inland Empire). Prices are at new highs in Colorado, New York and Texas (Denver, Austin, Dallas, Houston) and several other cities around the country.
Note: Case-Shiller for February will be released tomorrow.
Sunday, April 26, 2015
Sunday Night Futures
by Calculated Risk on 4/26/2015 08:45:00 PM
From the Financial Times: Eurozone officials seek to bypass Varoufakis to spur Greek talks
A fraught eurozone meeting in Riga at the weekend has left Yanis Varoufakis, the Greek finance minister, increasingly isolated both in Brussels and in Athens as officials seek to bypass him in an effort to jump-start bailout talks.Time is getting short.
Excerpt with permission
Monday:
• 10:30 AM ET: Dallas Fed Manufacturing Survey for April.
Weekend:
• Schedule for Week of April 26, 2015
From CNBC: Pre-Market Data and Bloomberg futures: currently S&P futures and DOW futures are up slightly (fair value).
Oil prices were up over the last week with WTI futures at $57.36 per barrel and Brent at $65.28 per barrel. A year ago, WTI was at $102, and Brent was at $109 - so, even with the recent increases, prices are down over 40% year-over-year.
Below is a graph from Gasbuddy.com for nationwide gasoline prices. Nationally prices are up to $2.54 per gallon (down about $1.15 per gallon from a year ago).
If you click on "show crude oil prices", the graph displays oil prices for WTI, not Brent; gasoline prices in most of the U.S. are impacted more by Brent prices.
| Orange County Historical Gas Price Charts Provided by GasBuddy.com |
ATA Trucking Index increased in March
by Calculated Risk on 4/26/2015 09:20:00 AM
Here is an indicator that I follow on trucking, from the ATA: ATA Truck Tonnage Index Gained 1.1% in March
American Trucking Associations’ advanced seasonally adjusted For-Hire Truck Tonnage Index increased 1.1% in March, following a revised drop of 2.8% during the previous month. In March, the index equaled 133.5 (2000=100). The all-time high is 135.8, reached in January 2015.
Compared with March 2014, the SA index increased 5%, which was above the 3.3% gain in February but below January’s 6.7% year-over-year increase. During the first quarter, tonnage was unchanged from the previous quarter while increasing 5% from the same period in 2014. ...
“While tonnage did not fully recoup the loss from February, it increased nicely in March,” said ATA Chief Economist Bob Costello. “I’d say that tonnage was one of the better indicators for the month, which is a positive sign for the broader economy.”
Costello added that truck tonnage has increased in five of the last six months, but is off 1.7% from the high in January.
“The next couple of months will be telling for truck freight volumes as we enter the spring freight season,” he said.
Trucking serves as a barometer of the U.S. economy, representing 69.1% of tonnage carried by all modes of domestic freight transportation, including manufactured and retail goods. Trucks hauled 9.7 billion tons of freight in 2013. Motor carriers collected $681.7 billion, or 81.2% of total revenue earned by all transport modes.
emphasis added
 Click on graph for larger image.
Here is a long term graph that shows ATA's For-Hire Truck Tonnage index.
The dashed line is the current level of the index.
The index is now up 5.0% year-over-year.
Saturday, April 25, 2015
Schedule for Week of April 26, 2015
by Calculated Risk on 4/25/2015 01:15:00 PM
The key report this is week is Q1 GDP on Wednesday. Also the FOMC will meet on Tuesday and Wednesday, and release a statement on Wednesday.
Other key reports include the March Personal Income and Outlays report on Thursday, April ISM manufacturing index on Friday, April vehicle sales on Friday, and the Case-Shiller house prices on Tuesday.
10:30 AM: Dallas Fed Manufacturing Survey for April.
 9:00 AM: S&P/Case-Shiller House Price Index for February. Although this is the February report, it is really a 3 month average of December, January and February prices.
This graph shows the nominal seasonally adjusted National Index, Composite 10 and Composite 20 indexes through the January 2015 report (the Composite 20 was started in January 2000).
The consensus is for a 4.6% year-over-year increase in the National Index for February. The Zillow forecast is for the National Index to increase 4.5% year-over-year in February, and for prices to increase 0.5% month-to-month seasonally adjusted.
10:00 AM: Richmond Fed Survey of Manufacturing Activity for April.
10:00 AM: Conference Board's consumer confidence index for April. The consensus is for the index to increase to 102.5 from 101.3.
10:00 AM: Q1 Housing Vacancies and Homeownership report from the Census Bureau. This report is frequently mentioned by analysts and the media to report on the homeownership rate, and the homeowner and rental vacancy rates. However, this report doesn't track with other measures (like the decennial Census and the ACS).
7:00 AM: The Mortgage Bankers Association (MBA) will release the results for the mortgage purchase applications index.
8:30 AM: Gross Domestic Product, 1st quarter 2015 (advance estimate). The consensus is that real GDP increased 1.0% annualized in Q1.
10:00 AM: Pending Home Sales Index for March. The consensus is for a 1.0% increase in the index.
2:00 PM: FOMC Meeting Statement.
8:30 AM: The initial weekly unemployment claims report will be released. The consensus is for claims to decrease to 290 thousand from 295 thousand.
8:30 AM ET: Personal Income and Outlays for March. The consensus is for a 0.2% increase in personal income, and for a 0.5% increase in personal spending. And for the Core PCE price index to increase 0.2%.
9:45 AM: Chicago Purchasing Managers Index for April. The consensus is for a reading of 50.0, up from 46.3 in March.
 10:00 AM: ISM Manufacturing Index for April. The consensus is for an increase to 52.0 from 51.5 in March.
Here is a long term graph of the ISM manufacturing index.
The ISM manufacturing index indicated expansion at 51.5% in March. The employment index was at 50.0%, and the new orders index was at 51.8%.
10:00 AM: Construction Spending for March. The consensus is for a 0.5% increase in construction spending.
 All day: Light vehicle sales for April. The consensus is for light vehicle sales to decrease to 16.9 million SAAR in April from 17.05 million in March (Seasonally Adjusted Annual Rate).
This graph shows light vehicle sales since the BEA started keeping data in 1967. The dashed line is the March sales rate.
10:00 AM: University of Michigan's Consumer sentiment index (final for April). The consensus is for a reading of 96.0, up from the preliminary reading of 95.9, and up from the March reading of 93.0.
April 2015: Unofficial Problem Bank list declines to 342 Institutions
by Calculated Risk on 4/25/2015 08:15:00 AM
This is an unofficial list of Problem Banks compiled only from public sources.
Here is the unofficial problem bank list for April 2015.
Changes and comments from surferdude808:
Update on the Unofficial Problem Bank List for April 2015. During the month, the list fell from 349 institutions to 342 after nine removals and two additions. Assets dropped by $1.2 billion to an aggregate $105.1 billion. A year ago, the list held 513 institutions with assets of $167.3 billion.
Actions were terminated against Orrstown Bank, Shippensburg, PA ($1.2 billion Ticker: ORRF); Atlantic Coast Bank, Jacksonville, FL ($709 million Ticker: ACFC); The Leaders Bank, Oak Brook, IL ($353 million); PrimeSouth Bank, Blackshear, GA ($326 million); The Exchange Bank, Skiatook, OK ($87 million); and Community Savings, Caldwell, OH ($68 billion). Finding their way off the list through merger were Colonial Bank, FSB, Vineland, NJ ($542 million Ticker: COBK); Baytree National Bank & Trust Company, Lake Forest, IL ($77 million); and Bank Reale, Pasco, WA ($38 million Ticker: BKRL).
The two additions this month were Lone Star National Bank, Pharr, TX ($2.2 billion) and Covenant Bank, Leeds, AL ($76 million).
Friday, April 24, 2015
DOT: Vehicle Miles Driven increased 2.8% year-over-year in February, Rolling 12 Months at All Time High
by Calculated Risk on 4/24/2015 06:34:00 PM
Note: With lower gasoline prices, vehicle miles driven have reached a new high on a rolling 12 month basis.
The Department of Transportation (DOT) reported:
Travel on all roads and streets changed by 2.8% (6.1 billion vehicle miles) for February 2015 as compared with February 2014.The following graph shows the rolling 12 month total vehicle miles driven to remove the seasonal factors.
Travel for the month is estimated to be 221.1 billion vehicle miles
The seasonally adjusted vehicle miles traveled for February 2015 is 254.1 billion miles, a 2.6% (6.4 billion vehicle miles) increase over February 2014. It also represents a -1.2% change (-3.2 billion vehicle miles) compared with January 2015.
The rolling 12 month total is moving up, after moving sideways for several years.
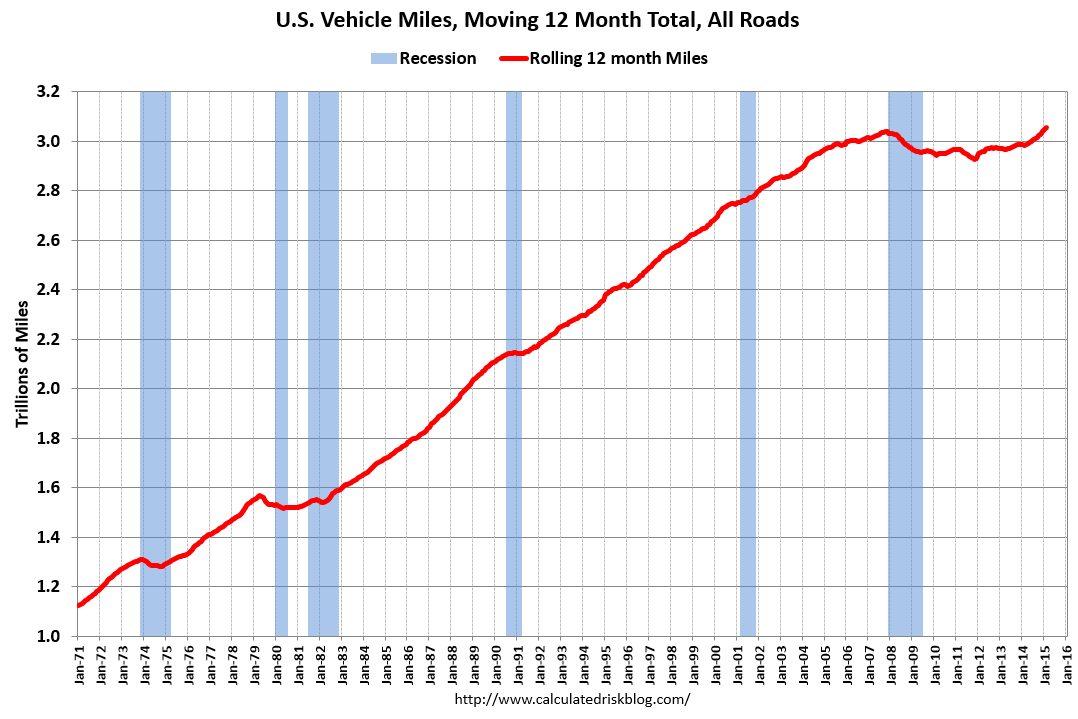 Click on graph for larger image.
In the early '80s, miles driven (rolling 12 months) stayed below the previous peak for 39 months.
Miles driven (rolling 12) had been below the previous peak for 85 months - an all time record - before reaching a new high for miles driven in January (and again in February).
The second graph shows the year-over-year change from the same month in the previous year.
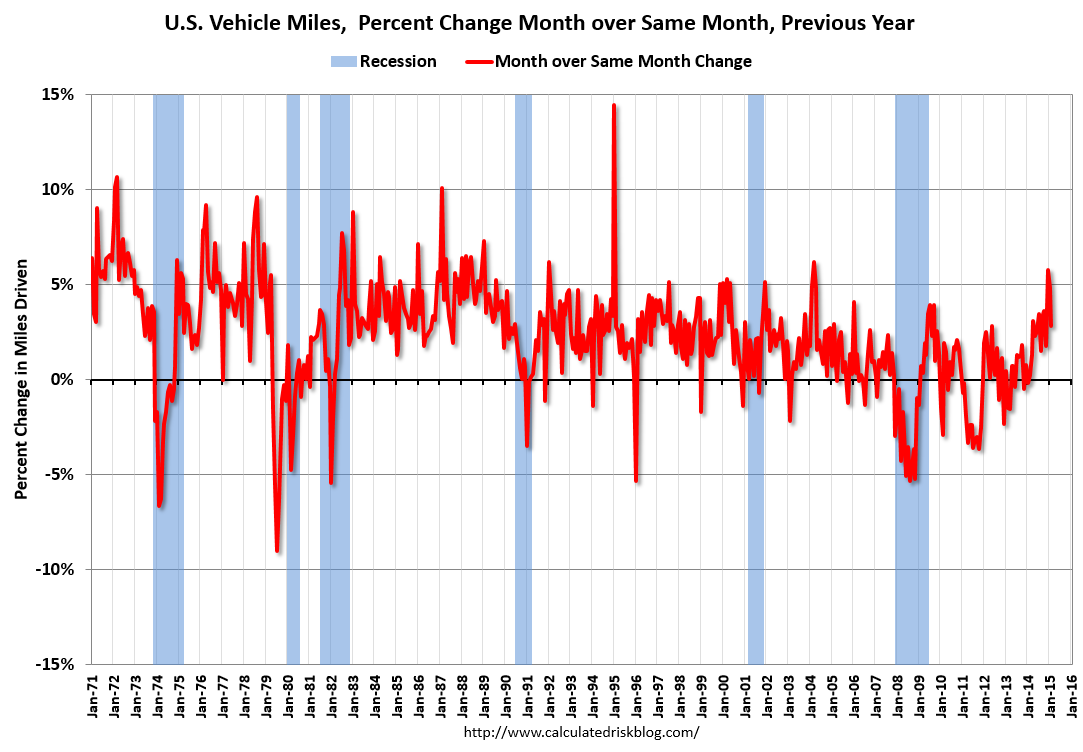 In February 2015, gasoline averaged of $2.30 per gallon according to the EIA. That was down significantly from January 2014 when prices averaged $3.43 per gallon.
 However gasoline prices are just part of the story. The lack of growth in miles driven over the last 7 years was probably also due to the lingering effects of the great recession (lack of wage growth), the aging of the overall population (over 55 drivers drive fewer miles) and changing driving habits of young drivers.
Now, miles driven - on a rolling 12 month basis - is at a new high.
Nomura Forecast: Q1 GDP at 1.0%
by Calculated Risk on 4/24/2015 01:37:00 PM
From economists at Nomura: US Q1 GDP: It will likely show that final sales barely grew, but April data should be better.
Adverse weather conditions, West Coast port disruptions, the stronger dollar and the decline in crude oil prices all likely hurt economic activity in Q1 2015. Business investment slowed considerably as oil and gas exploration projects halted abruptly and precipitously on lower crude oil prices while manufacturing activity was additionally hurt by the stronger dollar. Also, we believe that lower gasoline prices failed to spur consumer activity as it appears that households decided to save or pay down debt using the extra money saved from lower gasoline prices. Furthermore, adverse weather conditions likely hurt consumer and construction activity. Taken together, we expect headline Q1 GDP to grow by 1.0% q-o-q on an annualized rate with final sales increasing by only 0.1%.
However, there are two key sources of uncertainty worth noting. First, the Bureau of Economic Analysis (BEA) will only have the first two months of trade data on hand and will have to make some assumptions for March. This is in no way different from other years. However, due to West Coast port labor disputes, trade activity slowed considerably in the first two months of the year. BEA’s assumptions on how quickly trade activity rebounded will have a notable impact on topline GDP. Second, our work suggests that there is material residual seasonality in topline GDP in Q1 as it tends to be below trend due to strong seasonal patterns in defense spending. As such, we now expect government expenditures to be more of a drag than we had previously assumed. Nevertheless, this factor remains a key source of uncertainty.
Philly Fed: State Coincident Indexes increased in 41 states in March
by Calculated Risk on 4/24/2015 11:59:00 AM
From the Philly Fed:
The Federal Reserve Bank of Philadelphia has released the coincident indexes for the 50 states for March 2015. In the past month, the indexes increased in 41 states, decreased in four, and remained stable in five, for a one-month diffusion index of 74. Over the past three months, the indexes increased in 46 states, decreased in three, and remained stable in one, for a three-month diffusion index of 86.Note: These are coincident indexes constructed from state employment data. An explanation from the Philly Fed:
The coincident indexes combine four state-level indicators to summarize current economic conditions in a single statistic. The four state-level variables in each coincident index are nonfarm payroll employment, average hours worked in manufacturing, the unemployment rate, and wage and salary disbursements deflated by the consumer price index (U.S. city average). The trend for each state’s index is set to the trend of its gross domestic product (GDP), so long-term growth in the state’s index matches long-term growth in its GDP.
 Click on graph for larger image.
This is a graph is of the number of states with one month increasing activity according to the Philly Fed. This graph includes states with minor increases (the Philly Fed lists as unchanged).
In March, 44 states had increasing activity (including minor increases).
It appears we are seeing weakness in several oil producing states including Alaska and Oklahoma. It wouldn't be surprising if North Dakota, Texas and other oil producing states also turned red later this year.
 Here is a map of the three month change in the Philly Fed state coincident indicators. This map was all red during the worst of the recession, and is almost all green again.
 Note: Blue added for Red/Green issues.
Black Knight: Mortgage Delinquencies Declined in March, First time below 5% since August 2007
by Calculated Risk on 4/24/2015 09:15:00 AM
According to Black Knight's First Look report for March, the percent of loans delinquent decreased 12% in March compared to February, and declined 15% year-over-year.
The percent of loans in the foreclosure process declined 2% in March and were down about 27% over the last year.
Black Knight reported the U.S. mortgage delinquency rate (loans 30 or more days past due, but not in foreclosure) was 4.70% in March, down from 5.36% in February. This is the lowest level of delinquencies since August 2007.
The percent of loans in the foreclosure process declined in March to 1.55%. This was the lowest level of foreclosure inventory since December 2007.
The number of delinquent properties, but not in foreclosure, is down 390,000 properties year-over-year, and the number of properties in the foreclosure process is down 288,000 properties year-over-year.
Black Knight will release the complete mortgage monitor for March in early May.
| Black Knight: Percent Loans Delinquent and in Foreclosure Process | ||||
|---|---|---|---|---|
| Mar 2015 | Feb 2015 | Mar 2014 | Mar 2013 | |
| Delinquent | 4.70% | 5.36% | 5.52% | 6.59% |
| In Foreclosure | 1.55% | 1.58% | 2.13% | 3.38% |
| Number of properties: | ||||
| Number of properties that are 30 or more, and less than 90 days past due, but not in foreclosure: | 1,409,000 | 1,646,000 | 1,571,000 | 1,842,000 |
| Number of properties that are 90 or more days delinquent, but not in foreclosure: | 971,000 | 1,067,000 | 1,199,000 | 1,466,000 |
| Number of properties in foreclosure pre-sale inventory: | 782,000 | 800,000 | 1,070,000 | 1,689,000 |
| Total Properties | 3,162,000 | 3,512,000 | 3,840,000 | 4,997,000 |
Merrill Lynch forecasting 1.5% GDP in Q1
by Calculated Risk on 4/24/2015 07:59:00 AM
From Merrill Lynch:
We are forecasting GDP growth of 1.5% in 1Q, suggesting the economy hit a soft patch at the start of the year. Business investment looks particularly weak with a likely decline in nonresidential structures investment, as suggested by the monthly Census data, and sluggish growth in equipment investment. We also look for the trade deficit to widen, reflecting the stronger dollar and weaker growth abroad. There is room for surprise with both the investment and trade figures, however. Most importantly, the BEA does not have estimates yet from the Census Bureau on March trade and construction spending, creating room for interpretation from the BEA. Moreover, the port shutdown on the West Coast disrupted activity, adding additional uncertainty for both trade flows and business investment. Elsewhere, we look for consumer spending to increase 2.0% in 1Q. Both auto sales and core control retail sales improved through the quarter after the slow start. We also expect services spending to look stronger, owing in part to greater spending on utilities given the winter weather. Residential investment is likely to be little changed as a decline in housing starts offsets a pickup in existing home sales.The Atlanta Fed is forecasting:
It is important to remember that there is scope for error in forecasting the first release of GDP since the BEA does not have complete data for the month. Indeed, it is not unusual for the first release of GDP to miss the consensus forecast by a full percentage point in either direction. We would argue that there is additional uncertainty this quarter given the potential drag from the harsh winter weather and port shutdown in February.
The GDPNow model forecast for real GDP growth (seasonally adjusted annual rate) in the first quarter of 2015 was 0.1 percent on April 16, down from 0.2 percent on April 14.Ouch.
Thursday, April 23, 2015
Freddie Mac: 30 Year Mortgage Rates decrease to 3.65% in Latest Weekly Survey
by Calculated Risk on 4/23/2015 07:51:00 PM
From Freddie Mac today: Mortgage Rates Move Down Slightly
Freddie Mac today released the results of its Primary Mortgage Market Survey® (PMMS®), showing average fixed mortgage rates moving down slightly this week and remaining near their 2015 lows as the spring homebuying season continues. ...
30-year fixed-rate mortgage (FRM) averaged 3.65 percent with an average 0.6 point for the week ending April 23, 2015, down from last week when it averaged 3.67 percent. A year ago at this time, the 30-year FRM averaged 4.33 percent.
15-year FRM this week averaged 2.92 percent with an average 0.6 point, down from last week when it averaged 2.94 percent. A year ago at this time, the 15-year FRM averaged 3.39 percent.
 Click on graph for larger image.
This graph shows the 30 year and 15 year fixed rate mortgage interest rates from the Freddie Mac Primary Mortgage Market Survey®.
30 year mortgage rates are up a little (30 bps) from the all time low of 3.35% in late 2012, but down from 4.33% a year ago.
The Freddie Mac survey started in 1971. Mortgage rates were below 5% back in the 1950s.
The PMMS is a weekly survey. Here is an update on daily rates from Matthew Graham at Mortgage News Daily: Mortgage Rates Hold Ground at Recent Highs
Freddie collects data for the Survey from Monday through Wednesday, but most of the responses have been received by Tuesday. This week, that meant that most of the respondents had not yet seen the steep losses on Wednesday. Naturally then, Freddie's numbers suggest rates are lower than they actually are by the time people read about them on Thursday morning. Rates are, in fact, markedly higher than last week's. Whereas most top tier scenarios were being quoted 3.625% for conventional 30yr fixed loans last week, 3.75% is more prevalent today
Lawler: More Builder Results
by Calculated Risk on 4/23/2015 03:31:00 PM
From housing economist Tom Lawler:
PulteGroup reported that net home orders in the quarter ended March 31, 2015 totaled 5,139, up 5.7% from the comparable quarter of 2014. The average net order price last quarter was $332,400, up 0.5% from a year ago. Home deliveries last quarter totaled 3,365, down 2.1% from the comparable quarter of 2014, at an average sales price of $323,000, up 1.9% from a year ago. The company’s order backlog at the end of March was 7,624, up 5.9% from last March. Pulte’s net home building margin was 22.7%, compared to 23.8% a year ago.
Meritage Homes reported that net home orders in the quarter ended March 31, 2015 totaled 1,979, up 29.8% from the comparable quarter of 2014. The average net order price last quarter was $396,000, up 8.8% from a year ago. Home deliveries totaled 1,335, up 20.4% from the comparable quarter of 2014, at an average sales price of $387,000, up 5.7% from a year ago. The company’s order backlog at the end of March was 2,758k up 22.0% from last quarter. The company’s gross home building margin last quarter was 18.5%, down from 22.5% a year ago.
M/I Homes reported that net home orders in the quarter ended March 31, 2015 totaled 1,108, up 12.8% from the comparable quarter of 2014. Home deliveries last quarter totaled 717, down 2.0% from the comparable quarter of 2014, at an average sales price of $325,000, up 8.7% from a year ago. The company’s order backlog at the end of March was 1,613, up 5.8% from last March, at an average order price of $358,000, up 9.8% from a year ago. The company’s gross home building margin last quarter was 21.7%, unchanged from a year ago.
The general theme of builder reports so far compared to a year ago are (1) significantly stronger growth in net orders; (2) substantially lower increases in sales prices (with the exception of M/I Homes); and (3) lower gross margins (with the exception of M/I Homes).
Here are some summary stats.
| Net Orders | Settlements | Average Closing Price | |||||||
|---|---|---|---|---|---|---|---|---|---|
| Qtr. Ended: | 3/15 | 3/14 | % Chg | 3/15 | 3/14 | % Chg | 3/15 | 3/14 | % Chg |
| D.R. Horton | 11,135 | 8,569 | 29.9% | 8,243 | 6,194 | 33.1% | $281,305 | 271,230 | 3.7% |
| PulteGroup | 5,139 | 4,863 | 5.7% | 3,365 | 3,436 | -2.1% | $323,000 | 317,000 | 1.9% |
| NVR | 3,926 | 3,325 | 18.1% | 2,534 | 2,211 | 14.6% | $371,000 | 361,400 | 2.7% |
| Meritage Homes | 1,979 | 1,525 | 29.8% | 1,335 | 1,109 | 20.4% | $387,000 | 366,000 | 5.7% |
| M/I Homes | 1,108 | 982 | 12.8% | 717 | 732 | -2.0% | $325,000 | 299,000 | 8.7% |
| Total | 23,287 | 19,264 | 20.9% | 16,194 | 13,682 | 18.4% | $314,652 | $306,463 | 2.7% |
Sales per active community for the above five builders combined last quarter were up 17.3% from the comparable quarter of 2014.
By way of comparison, the YOY increase in net orders for these five builders combined for the quarter ended March 31, 2014 was 0.4%, net orders per community were down 6.2% YOY; and the average sales price was up 10.4% YOY.


