 RSS Feed
 by Calculated Risk on 5/04/2015 08:06:00 AM
Monday, May 04, 2015
Black Knight March Mortgage Monitor: "Negative Equity Population Shrinks to Just Over 4 Million"
Black Knight Financial Services (BKFS) released their Mortgage Monitor report for March today. According to BKFS, 4.70% of mortgages were delinquent in March, down from 5.36% in February. BKFS reported that 1.55% of mortgages were in the foreclosure process, down from 2.13% in March 2014.
This gives a total of 6.25% delinquent or in foreclosure. It breaks down as:
• 1,409,000 properties that are 30 or more days, and less than 90 days past due, but not in foreclosure.
• 971,000 properties that are 90 or more days delinquent, but not in foreclosure.
• 782,000 loans in foreclosure process.
For a total of 3,162,000 loans delinquent or in foreclosure in March. This is down from 3,840,000 in March 2014.
Typically there is a large decline in the March delinquency rate, but the decline this year was especially large.
 Click on graph for larger image.
From Black Knight:
March’s 12.2 percent drop in delinquency rates was the largest monthly decline in 9 yearsAlso from Black Knight on negative equity:
Delinquencies were down approximately 15 percent year-over-year
While seasonal decreases in March are typical (they’ve been seen in each of the past 10 years), this year’s drop was the largest since the 16.2 percent decline seen in March of 2006
Black Knight analyzed the latest available data on the nation’s negative equity situation. As explained by Ben Graboske, senior vice president, Black Knight Data and Analytics, the trend remains one of overall improvement – though negative equity distribution varies considerably depending upon geographical location and home values within a given market.
...
“Our most recent data shows that just over 8 percent of borrowers are currently underwater on their mortgages, representing a nearly 30 percent reduction in the negative equity rate since last year. We also observed that 29 percent of underwater borrowers are seriously delinquent on their mortgages and that borrowers in negative equity positions make up 77 percent of all active foreclosures. In fact, one of every three borrowers in active foreclosure has a current loan-to-value ratio of 150 or more, meaning they owe 50 percent more than their homes are worth." [said Graboske.]

Just over 4 million borrowers (8.08 percent of active mortgage universe) are in a negative equity position as of January 2015There is much more in the mortgage monitor.
Last year this population stood at 5.7 million borrowers (11.4 percent), marking a reduction of nearly 29 percent, or 1.6 million fewer underwater borrowers in 2015
The current population of underwater borrowers is just a quarter of the negative equity population at its peak in early 2011 (when 30 percent of borrowers were in negative equity positions)
Sunday, May 03, 2015
Sunday Night Futures
by Calculated Risk on 5/03/2015 08:53:00 PM
Looking for wages ... from Greg Ip at the WSJ: In Labor vs. Capital, Workers Gain a Slight Edge
Hopefully there will be some small sign of a pickup in wages in the April employment report (to be released Friday).
Monday:
• Early, the Black Knight March Mortgage Monitor report. This is a monthly report of mortgage delinquencies and other mortgage data.
• At 10:00 AM ET, Manufacturers' Shipments, Inventories and Orders (Factory Orders) for March. The consensus is a 2.1% increase in orders.
• At 2:00 PM: the April 2015 Senior Loan Officer Opinion Survey on Bank Lending Practices from the Federal Reserve.
Weekend:
• Schedule for Week of May 3, 2015
From CNBC: Pre-Market Data and Bloomberg futures: currently S&P futures and DOW futures are down slightly (fair value).
Oil prices were up over the last week with WTI futures at $59.09 per barrel and Brent at $66.48 per barrel. A year ago, WTI was at $100, and Brent was at $109 - so, even with the recent increases, prices are down 40%+ year-over-year.
Below is a graph from Gasbuddy.com for nationwide gasoline prices. Nationally prices are up to $2.63 per gallon (down just over $1.00 per gallon from a year ago).
If you click on "show crude oil prices", the graph displays oil prices for WTI, not Brent; gasoline prices in most of the U.S. are impacted more by Brent prices.
| Orange County Historical Gas Price Charts Provided by GasBuddy.com |
Hotels at Record Occupancy Pace in 2015
by Calculated Risk on 5/03/2015 10:15:00 AM
From HotelNewsNow.com: STR: US hotel results for week ending 25 April
The U.S. hotel industry recorded positive results in the three key performance measurements during the week of 19-25 April 2015, according to data from STR, Inc.Note: ADR: Average Daily Rate, RevPAR: Revenue per Available Room.
In year-over-year measurements, the industry’s occupancy increased 4.3 percent to 69.8 percent. Average daily rate increased 6.5 percent to finish the week at US$120.07. Revenue per available room for the week was up 11.0 percent to finish at US$83.86.
emphasis added
The following graph shows the seasonal pattern for the hotel occupancy rate using the four week average.
Hotels are now in the Spring travel period and business travel is solid.
 Click on graph for larger image.
The red line is for 2015, dashed orange is 2014, blue is the median, and black is for 2009 - the worst year since the Great Depression for hotels. Purple is for 2000.
The 4-week average of the occupancy rate is solidly above the median for 2000-2007, and solidly above last year.
Right now 2015 is even above 2000 (best year for hotels) - and 2015 will probably be the best year on record for hotels. Note the strong gains in RevPAR too.
Data Source: Smith Travel Research, Courtesy of HotelNewsNow.com
Saturday, May 02, 2015
Lawler on Housing Vacancy Survey: More “Stunning” Results, But Tough to Interpret
by Calculated Risk on 5/02/2015 03:06:00 PM
A technical note from housing economist Tom Lawler:
Earlier this week the Census Bureau released its “Residential Vacancies and Homeownership” Report (commonly referred to as the Housing Vacancy Survey, or HVS) for the first quarter of 2015, and while the results were not as “eye-popping” as those in the previous quarter, they were nevertheless – if reflective of actual housing trends – stunning.
The HVS estimate of the US homeownership rate continued its recent rapid descent last quarter, and the 1.2 percentage point decline over the last four quarters is the largest four-quarter decline since the HVS began. The YOY declines in the HVS HOR’s were especially steep for householders 44 years old or younger.
On the housing inventory front, the HVS estimate of the number of occupied homes (or households) declined by 407,000 in the first quarter following the all-time record 1.337 million jump in the fourth quarter of last year. After adjusting for normal seasonal patterns, the HVS household estimate fell by about 60,000 last quarter after jumping by a record 1.17 million in the previous quarter.
Here are some summary stats from the latest report.
| Selected Statisitcs, Census Housing Vacancy Survey | ||||||
|---|---|---|---|---|---|---|
| Q1/2014 | Q2/2014 | Q3/2014 | Q4/2014 | Q1/2015 | YOY Change | |
| Rental Vacancy Rate | 8.3% | 7.5% | 7.4% | 7.0% | 7.1% | -1.2% |
| Homeowner Vacancy Rate | 2.0% | 1.9% | 1.8% | 2.0% | 1.9% | -0.1% |
| Gross Vacancy Rate | 13.8% | 13.6% | 13.5% | 12.6% | 13.0% | -0.8% |
| Homeownership Rate | 64.8% | 64.7% | 64.4% | 64.0% | 63.7% | -1.1% |
| Homeownership Rate SA | 65.0% | 64.7% | 64.3% | 64.0% | 63.8% | -1.2% |
| Housing Stock (000') | 133,087 | 133,209 | 133,331 | 133,453 | 133,575 | 488 |
| Occupied Housing Stock | 114,762 | 115,127 | 115,310 | 116,647 | 116,240 | 1,478 |
| Owner | 74,404 | 74,458 | 74,240 | 74,606 | 74,018 | -386 |
| Renter | 40,357 | 40,669 | 41,070 | 42,041 | 42,222 | 1,865 |
| Homeownership Rate by Age of Householder | ||||||
| < 35 | 36.2% | 35.9% | 36.0% | 35.3% | 34.6% | -1.6% |
| 35-44 | 60.7% | 60.2% | 59.1% | 58.8% | 58.4% | -2.3% |
| 45-54 | 71.4% | 70.7% | 70.1% | 70.5% | 70.1% | -1.3% |
| 55-64 | 76.4% | 76.4% | 76.6% | 75.8% | 75.8% | -0.6% |
| 65+ | 79.9% | 80.1% | 80.0% | 79.5% | 79.0% | -0.9% |
The fourth quarter jump in the HVS estimate of total households was eye-popping, but there are several reasons to question the magnitude of the jump. First, in the fourth quarter of 2014 the HVS estimate of the number of “seasonal” housing units fell by a record 453,000 from the previous quarter, only to jump back up by 385,000 in the subsequent quarter. Since the HVS “controls” it housing units by category to independent estimates of the overall housing stock, this “strange” swing in the number of “seasonal” housing units may have artificially boosted the occupied unit category in the fourth quarter.
Second, beginning in April 2014 the HVS began “phasing in” in new sample which may have “artificially” increased household estimate gains since the early part of 2014. Here is an excerpt from the HVS “Sources and Accuracy” document.
“Beginning in April 2014, a new sample is being phased in over a 16-month period. The methods used to select the sample households for the survey are evaluated after each decennial census. Based on these evaluations, the design of the survey is modified and systems are put in place to provide the sample for the following decade. The previous decennial revision incorporated new information from Census 2000 and was complete as of July 2005. The design for the entire decade was selected from the 2000 based sample. The current revision incorporates new information from Census 2010 and will be complete in July 2015. The new sample is based on the Master Address File (MAF) compiled during the 2010 Census and will use annual selections from the MAF instead of the once a decade sample selection used previously.”
Comparisons between Decennial Census results and the HVS clearly indicate that the HVS estimates have not reliably reflected overall US housing trends in a number of important respects, including (but not limited to) overall vacancy rates (overstated), homeownership rates (overstated), and the distributed of households by age (overstated share of younger householders). These HVS errors widened from 2000 to 2010. It is not clear how much of the HVS estimation problem has been related to its “sampling frame” and how much is related to “non-sampling” errors. To the extent that the new sample better reflects the actual characteristics of the US housing stock, however, then one would expect that the phasing-in of the new sample would, among other things, result in (1) faster than “actual” household growth; (2) faster than “actual” growth in renter households relative to owner households; and (3) larger than “actual” declines in the homeownership rate.
My understanding is that Census “phases in” the new sample over such a long period of time so that there is not a “really big” discontinuous” shift it the CPS/HVS time series. If there are huge differences between the old and new samples, however, then even with such a “phasing in” there can be discontinuities in time series estimates. It would be nice, however, if Census would show a comparison of HVS results using the old sample and HVS results using the new sample so that analysts could assess the “sampling” vs. “non-sampling” errors of HVS results themselves.
While recognizing that the overall change in owner-occupied vs. renter-occupied housing units as estimated by the HVS over the last year may not reflect “actual” changes, I thought some folks might be interested in HVS-based estimates of owner- vs. renter-occupied housing units by units in structure. The HVS does not actually publish such estimates, but in detailed tables HVS shows estimates of (1) the distribution of rental and owner housing units (renter occupied plus for rent or owner occupied plus for sale only) by units in structure, and (2) vacancy rates by units in structure for renter and owner housing units. As such, one can produce the implied HVS occupied renter and owner housing units by units in structure. The HVS includes one-unit manufactured/mobile housing units in its one-unit structure category, so this category is not the same as what analysts generally consider “single-family” housing units. Here is a comparison of the first quarter of 2015 with the first quarter of 2014.
| HVS-Based Estimates of Owner and Renter Occupied Housing Units by Units in Structure (000's) | |||
|---|---|---|---|
| Q1/2014 | Q1/2015 | Change | |
| Renter-Occupied Total | 40,357 | 42,222 | 1,865 |
| One-Unit | 15,831 | 16,572 | 741 |
| 2-4 Units | 7,753 | 8,090 | 337 |
| 5-9 Units | 5,051 | 5,300 | 249 |
| 10+ Units | 11,722 | 12,260 | 538 |
| Owner-Occupied Total | 74,404 | 74,018 | -386 |
| One-Unit | 70,920 | 70,518 | -402 |
| 2-4 Units | 1,335 | 1,347 | 12 |
| 5-9 Units | 574 | 563 | -11 |
| 10+ Units | 1,575 | 1,590 | 15 |
HVS estimates suggest that the trend toward more single-family units being rented rather than owned continued over the last year. Compared to the fourth quarter of 2005, HVS estimates suggest that the number of owner-occupied one-unit homes fell by about 1.969 million units, while the number of renter-occupied one-unit housing units increased by about 4.345 million units.
Schedule for Week of May 3, 2015
by Calculated Risk on 5/02/2015 09:55:00 AM
The key report this week is the April employment report on Friday.
Other key indicators include the March Trade Deficit on Tuesday, and the April ISM non-manufacturing index also on Tuesday.
Early: the Black Knight March Mortgage Monitor report. This is a monthly report of mortgage delinquencies and other mortgage data.
10:00 AM: Manufacturers' Shipments, Inventories and Orders (Factory Orders) for March. The consensus is a 2.1% increase in orders.
2:00 PM ET: the April 2015 Senior Loan Officer Opinion Survey on Bank Lending Practices from the Federal Reserve.
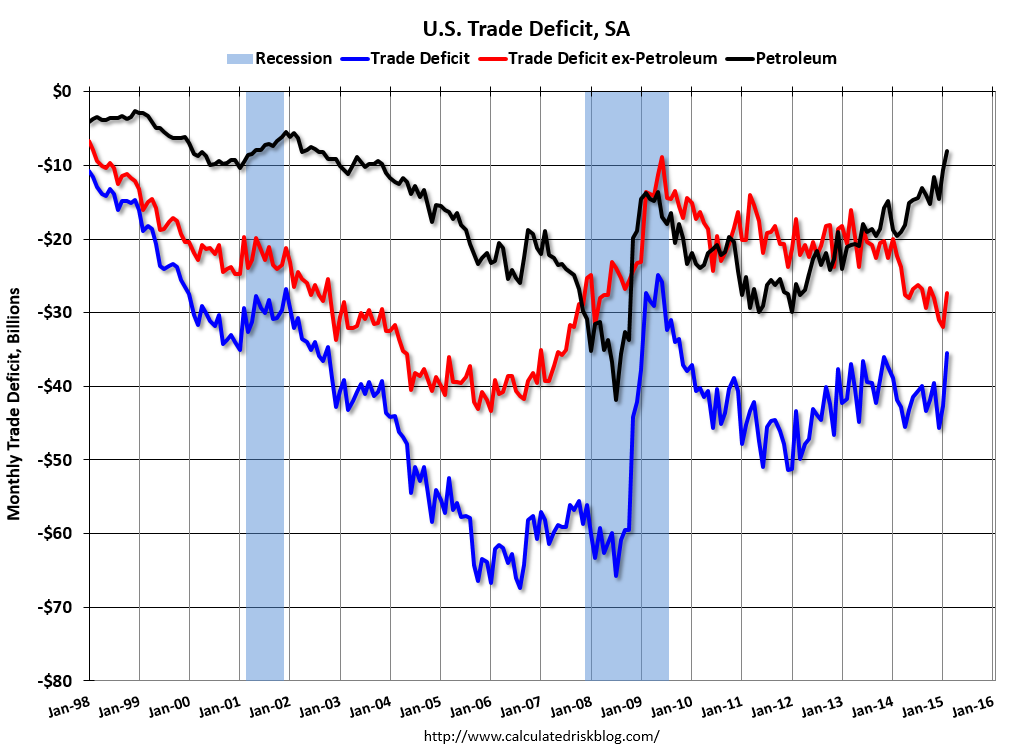 8:30 AM: Trade Balance report for March from the Census Bureau.
 This graph shows the U.S. trade deficit, with and without petroleum, through February. The blue line is the total deficit, and the black line is the petroleum deficit, and the red line is the trade deficit ex-petroleum products.
The consensus is for the U.S. trade deficit to be at $42.0 billion in March from $35.4 billion in February. Note: The trade deficit probably increased sharply in March after the West Coast port slowdown was resolved in February. It seems likely the deficit will be larger than the "consensus" forecast.
10:00 AM: the ISM non-Manufacturing Index for April. The consensus is for index to decrease to 56.2 from 56.5 in March.
7:00 AM: The Mortgage Bankers Association (MBA) will release the results for the mortgage purchase applications index.
8:15 AM: The ADP Employment Report for April. This report is for private payrolls only (no government). The consensus is for 205,000 payroll jobs added in April, up from 189,000 in March.
9:15 AM: Speech by Fed Chair Janet Yellen, Finance and Society, At the Institute for New Economic Thinking Conference on Finance and Society, Washington, D.C.
8:30 AM: The initial weekly unemployment claims report will be released. The consensus is for claims to increase to 285 thousand from 262 thousand.
3:00 PM: Consumer Credit for March from the Federal Reserve. The consensus is for an increase of $16.0 billion in credit.
8:30 AM: Employment Report for April. The consensus is for an increase of 220,000 non-farm payroll jobs added in April, up from the 126,000 non-farm payroll jobs added in March.
The consensus is for the unemployment rate to decline to 5.4%.
 This graph shows the year-over-year change in total non-farm employment since 1968.
In March, the year-over-year change was 3.1 million jobs.
As always, a key will be the change in real wages - and as the unemployment rate falls, wage growth should pickup.
Friday, May 01, 2015
Restaurant Performance Index shows Expansion in March
by Calculated Risk on 5/01/2015 07:02:00 PM
Here is a minor indicator I follow from the National Restaurant Association: Restaurant Performance Index Remained Positive in March
As a result of higher same-store sales and a continued optimistic outlook for future business conditions, the National Restaurant Association’s Restaurant Performance Index (RPI) remained in positive territory in March. The RPI – a monthly composite index that tracks the health of and outlook for the U.S. restaurant industry – stood at 102.2 in March, down 0.4 percent from February’s level of 102.6. Despite the decline, March marked the 25th consecutive month in which the RPI stood above 100, which signifies expansion in the index of key industry indicators.
“Although a majority of restaurant operators reported higher same-store sales in March, customer traffic levels were somewhat dampened,” said Hudson Riehle, senior vice president of the Research and Knowledge Group for the Association. “Looking forward, restaurant operators remain solidly optimistic about future business conditions, with six in 10 expecting to have higher sales in six months.”
emphasis added
 Click on graph for larger image.
The index decreased to 102.2 in March, down from 102.6 in February. (above 100 indicates expansion).
Restaurant spending is discretionary, so even though this is "D-list" data, I like to check it every month. This is another solid reading - and it is likely restaurants are benefiting from lower gasoline prices and are having to raise wages - a little - to attract and retain workers.
U.S. Light Vehicle Sales declined to 16.5 million annual rate in April
by Calculated Risk on 5/01/2015 02:38:00 PM
Based on a WardsAuto estimate, light vehicle sales were at a 16.5 million SAAR in April. That is up 3.3% from April 2014, and down 3.2% from the 17.05 million annual sales rate last month.

Click on graph for larger image.
This graph shows the historical light vehicle sales from the BEA (blue) and an estimate for April (red, light vehicle sales of 16.5 million SAAR from WardsAuto).
This was below the consensus forecast of 16.9 million SAAR (seasonally adjusted annual rate).
The second graph shows light vehicle sales since the BEA started keeping data in 1967.
 Note: dashed line is current estimated sales rate.
Although below the consensus forecast, this was still a solid month for vehicle sales.
Construction Spending decreased 0.6% in March
by Calculated Risk on 5/01/2015 12:12:00 PM
Earlier today, the Census Bureau reported that overall construction spending decreased in March:
The U.S. Census Bureau of the Department of Commerce announced today that construction spending during March 2015 was estimated at a seasonally adjusted annual rate of $966.6 billion, 0.6 percent below the revised February estimate of $972.9 billion. The March figure is 2.0 percent above the March 2014 estimate of $947.3 billion.Both Private and public spending decreased:
Spending on private construction was at a seasonally adjusted annual rate of $702.4 billion, 0.3 percent below the revised February estimate of $704.7 billion. ...Note: Non-residential for offices and hotels is generally increasing, but spending for oil and gas is declining. Early in the recovery, there was a surge in non-residential spending for oil and gas (because oil prices increased), but now, with falling prices, oil and gas is a drag on overall construction spending.
In March, the estimated seasonally adjusted annual rate of public construction spending was $264.2 billion, 1.5 percent below the revised February estimate of $268.2 billion.
emphasis added
As an example, construction spending for lodging is up 22% year-over-year, whereas spending for power (includes oil and gas) construction peaked in mid-2014 and is down 16% year-over-year.
 Click on graph for larger image.
This graph shows private residential and nonresidential construction spending, and public spending, since 1993. Note: nominal dollars, not inflation adjusted.
Private residential spending has been moving sideways, and is 48% below the bubble peak.
Non-residential spending is 15% below the peak in January 2008.
Public construction spending is now 19% below the peak in March 2009 and about 1% above the post-recession low.
 The second graph shows the year-over-year change in construction spending.
On a year-over-year basis, private residential construction spending is down 2.5%. Non-residential spending is up 9% year-over-year. Public spending is unchanged year-over-year.
Looking forward, all categories of construction spending should increase in 2015. Residential spending is still very low, non-residential is starting to pickup (except oil and gas), and public spending has probably hit bottom after several years of austerity.
This was below the consensus forecast of a 0.5% increase, however spending for January and February was revised up.
ISM Manufacturing index unchanged at 51.5 in April
by Calculated Risk on 5/01/2015 10:01:00 AM
The ISM manufacturing index suggested sluggish expansion in April. The PMI was at 51.5% in April, unchanged from 51.5% in March. The employment index was at 48.3%, down from 50.0% in March, and the new orders index was at 53.5%, up from 51.8%.
From the Institute for Supply Management: April 2015 Manufacturing ISM® Report On Business®
Economic activity in the manufacturing sector expanded in April for the 28th consecutive month, and the overall economy grew for the 71st consecutive month, say the nation’s supply executives in the latest Manufacturing ISM® Report On Business®.
The report was issued today by Bradley J. Holcomb, CPSM, CPSD, chair of the Institute for Supply Management® (ISM®) Manufacturing Business Survey Committee. "The April PMI® registered 51.5 percent, the same reading as in March. The New Orders Index registered 53.5 percent, an increase of 1.7 percentage points from the reading of 51.8 percent in March. The Production Index registered 56 percent, 2.2 percentage points above the March reading of 53.8 percent. The Employment Index registered 48.3 percent, 1.7 percentage points below the March reading of 50 percent, reflecting contracting employment levels from March. Inventories of raw materials registered 49.5 percent, a decrease of 2 percentage points from the March reading of 51.5 percent. The Prices Index registered 40.5 percent, 1.5 percentage points above the March reading of 39 percent, indicating lower raw materials prices for the sixth consecutive month. While the March and April PMI® were equal, both registering 51.5 percent, 15 of the 18 manufacturing industries reported growth in April while only 10 industries reported growth in March, indicating a broader distribution of growth in April among the 18 industries."
emphasis added
 Click on graph for larger image.
Here is a long term graph of the ISM manufacturing index.
This was below expectations of 52.0%, but still indicates expansion in April.
Zillow Forecast: Expect Case-Shiller National House Price Index up 4.2% year-over-year change in March
by Calculated Risk on 5/01/2015 07:11:00 AM
The Case-Shiller house price indexes for February were released this week. Zillow forecasts Case-Shiller a month early - now including the National Index - and I like to check the Zillow forecasts since they have been pretty close.
From Zillow: March Case-Shiller Forecast: 20-City Index to Show Annual Growth Above 5% Once Again
The February S&P/Case-Shiller (SPCS) data published today showed a slight uptick in home value appreciation for the 10- and 20-City indices, compared to the prior month. However, appreciation in the national index fell slightly in February, to an annual pace of 4.2 percent, from 4.4 percent in January 2015. Annual appreciation in the national series hit a post-bubble peak of 10.9 percent in October 2013 and has declined in every month since December 2013.So the year-over-year change in for March Case-Shiller National index will be about the same as in the February report.
The 10- and 20-City Composite Indices both experienced modest bumps in annual growth rates in February; the 10-City index rose 4.8 percent and the 20-City Index rose to 5 percent, up from rates of 4.3 percent and 4.5 percent, respectively, in January. The non-seasonally adjusted (NSA) 10- and 20-City indices were each up 0.5 percent in February from January, and we expect both to show further gains in March.
All forecasts are shown in the table below. These forecasts are based on the February SPCS data release and the March 2015 Zillow Home Value Index (ZHVI), published April 22. Officially, the SPCS Composite Home Price Indices for March will not be released until Tuesday, May 26.
| Zillow Case-Shiller Forecast | ||||||
|---|---|---|---|---|---|---|
| Case-Shiller Composite 10 | Case-Shiller Composite 20 | Case-Shiller National | ||||
| NSA | SA | NSA | SA | NSA | SA | |
| February Actual YoY | 4.8% | 4.8% | 5.0% | 5.0% | 4.2% | 4.2% |
| March Forecast YoY | 4.9% | 4.9% | 5.2% | 5.2% | 4.2% | 4.2% |
| March Forecast MoM | 0.9% | 1.0% | 1.0% | 0.9% | 0.5% | 0.2% |
From Zillow:
Annual appreciation in the Zillow Home Value Index (ZHVI) peaked in April 2014 and has declined since then. In March, the U.S. ZHVI rose 3.9 percent year-over-year, the first month in two years that home values grew at less than 4 percent annually. The annual appreciation rate in home values has fallen for the past 11 months. The February Zillow Home Value Forecast calls for a 2.6 percent rise in home values through February 2016. Further details on our forecast of home values can be found here.


