by Calculated Risk on 4/07/2012 07:43:00 AM
Saturday, April 07, 2012
Summary for Week ending April 6th
The March employment report was below expectations with only 120,000 payroll jobs added. The unemployment rate declined slightly to 8.2%. U-6, an alternate measure of labor underutilization that includes part time workers and marginally attached workers, declined to 14.5% from 14.9% in February.
Is this the beginning of even slower employment growth, or was this just noise? That is a key question and will put additional pressure on the April report.
In 2011, the economy added 1.84 million payroll jobs (2.1 million private sector), and, even after the weak March report, the economy is on pace to add over 2.5 million payroll jobs this year. That is still sluggish growth given the slack in the system, but better than 2011.
Other reports below expectations included March auto sales, February construction spending, and the March ISM service survey. The ISM manufacturing survey was slightly above expectations.
A couple of other positives: initial weekly unemployment claims continued to decline, and, for commercial real estate, the office and mall vacancy rates are now declining.
Overall it was a disappointing week and suggests sluggish growth.
Here is a summary in graphs:
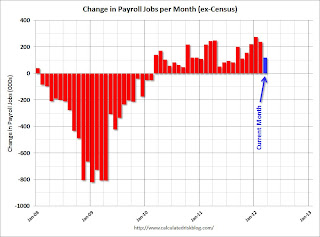
• March Employment Report: 120,000 Jobs, 8.2% Unemployment Rate
 Click on graph for larger image.
This graph shows the jobs added or lost per month (excluding temporary Census jobs) since the beginning of 2008.
From the BLS: "Nonfarm payroll employment rose by 120,000 in March, and the unemployment rate was little changed at 8.2 percent, the U.S. Bureau of Labor Statistics reported today."
The second graph shows the employment population ratio, the participation rate, and the unemployment rate. The unemployment rate was declined to 8.2% (red line).
 The Labor Force Participation Rate decreased to 63.8% in March (blue line). This is the percentage of the working age population in the labor force. The participation rate is well below the 66% to 67% rate that was normal over the last 20 years, although most of the decline is due to demographics.
The Employment-Population ratio decreased slightly to 58.5% in March (black line).
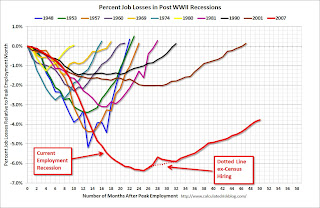 The third graph shows the job losses from the start of the employment recession, in percentage terms. The dotted line is ex-Census hiring.
This shows the depth of the recent employment recession - much worst than any other post-war recession - and the relatively slow recovery due to the lingering effects of the housing bust and financial crisis.
This was weaker payroll growth than expected (expected was 201,000).
• ISM Manufacturing index indicates slightly faster expansion in March
 PMI was at 53.4% in March, up from 52.4% in February. The employment index was at 56.1%, up from 53.2%, and new orders index was at 54.5%, down from 54.9%.
 Here is a long term graph of the ISM manufacturing index.
This was slightly above expectations of 53.0%. This suggests manufacturing expanded at a faster rate in March than in February. It appears manufacturing employment expanded in March with the employment index at 56.1%.
• ISM Non-Manufacturing Index indicates slower expansion in March
 The March ISM Non-manufacturing index was at 56.0%, down from 57.3% in February. The employment index increased in March to 56.7%, up from 55.7% in February. Note: Above 50 indicates expansion, below 50 contraction.
 This graph shows the ISM non-manufacturing index (started in January 2008) and the ISM non-manufacturing employment diffusion index.
This was below the consensus forecast of 56.7% and indicates slightly slower expansion in March than in February.
• U.S. Light Vehicle Sales at 14.4 million annual rate in March
 Based on an estimate from Autodata Corp, light vehicle sales were at a 14.37 million SAAR in March. That is up 10.4% from March 2011, but down 4.4% from the sales rate last month (15.03 million SAAR in Feb 2012).
This graph shows light vehicle sales since the BEA started keeping data in 1967.
March was above the August 2009 rate with the spike in sales from "cash-for-clunkers". Only February had a higher sales rates since early 2008. This was below the consensus forecast of 14.7 million SAAR.
Even though this was below expectations, growth in auto sales will make another strong positive contribution to GDP in Q1 2012.
• Construction Spending declined in February
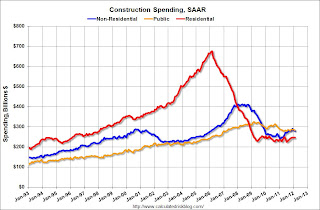 This graph shows private residential and nonresidential construction spending, and public spending, since 1993. Note: nominal dollars, not inflation adjusted.
Private residential spending is 63.5% below the peak in early 2006, and up 10% from the recent low. Non-residential spending is 32% below the peak in January 2008, and up about 15% from the recent low.
Public construction spending is now 13% below the peak in March 2009.
The year-over-year improvement in private residential investment is an important change (the positive in 2010 was related to the tax credit), and this suggest the bottom is in for residential investment.
• Reis: Office, Mall and Apartment Vacancy Rates
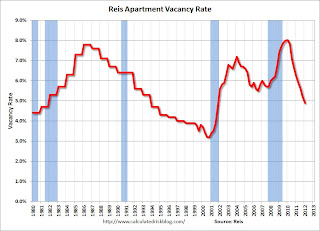 Reis reported the apartment vacancy rate (82 markets) fell to 4.9% in Q1 from 5.2% in Q4 2011. The vacancy rate was at 6.1% in Q1 2010 and peaked at 8.0% at the end of 2009.
This graph shows the apartment vacancy rate starting in 1980 (prior to 1999 the data is annual). Back in the early '80s, there was overbuilding in the apartment sector (just like for offices) with the very loose lending that led to the S&L crisis. Once the lending stopped, starts of built-for-rent units slowed, and the vacancy rate started to decline.
Following the financial crisis, starts and completions of multi-family units fell to record lows (there were a record low number of completions last year). Builders have increased construction, but it usually takes over a year to complete a multi-family building, so this new supply hasn't reached the market yet. As Reis noted, the number of completions will increase this year, but the vacancy rate will probably decline further.
This will also impact on house prices. The upward pressure on rents will make the price-to-rent ratio a little more favorable for buying.
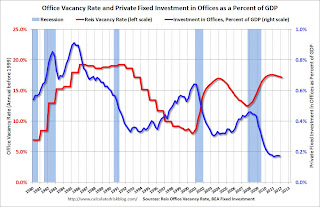 Reis reported the office vacancy rate declined slightly to 17.2% in Q1 from 17.3% in Q4 2011. The vacancy rate was at 17.6% in Q1 2011.
This graph shows the office vacancy rate starting in 1980 (prior to 1999 the data is annual). Back in the early '80s, there was overbuilding in the office sector even as the vacancy rate was rising. This was due to the very loose lending that led to the S&L crisis.
In the '90s, office investment picked up as the vacancy rate fell. Following the bursting of the stock bubble, the vacancy rate increased sharply and office investment declined.
During the housing bubble, office investment started to increase even before the vacancy rate had fallen below 14%. This was due to loose lending - again. Investment essentially stopped following the financial crisis.
The good news is there is very little new office construction right now and the vacancy rate will probably continue to decline.
 Ries reported the regional mall vacancy rate declined to 9.0% in Q1, and the strip mall vacancy rate declined to 10.9% from 11.0%.
This graph shows the vacancy rate for regional and strip malls since Q1 2000.
It appears the vacancy rate is starting to decline, but very slowly. Just like for office space, there is almost no new supply of malls being built.
• Weekly Initial Unemployment Claims decline to 357,000
 The DOL reports:
In the week ending March 31, the advance figure for seasonally adjusted initial claims was 357,000, a decrease of 6,000 from the previous week's revised figure of 363,000. The 4-week moving average was 361,750, a decrease of 4,250 from the previous week's revised average of 366,000.The previous week was revised up to 363,000 from 359,000.
The dashed line on the graph is the current 4-week average. The four-week average of weekly unemployment claims declined to 361,750.
The 4-week moving average is at the lowest level since early 2008.
• Other Economic Stories ...
• FOMC Minutes: No Push for QE3
• Federal Reserve Issues Statement on Rental of REOs
• Trulia announces new "mix adjusted" House Asking Price Monitor, Prices up 1.4% from Q4
• Ceridian-UCLA: Diesel Fuel index increased 0.3% in March
• ADP: Private Employment increased 209,000 in March
• LPS: February Foreclosure Starts and Sales Reversed Prior Month’s Increases


