by Calculated Risk on 2/07/2011 11:48:00 AM
Monday, February 07, 2011
LPS: Overall mortgage delinquencies declined in 2010
LPS Applied Analytics released their December Mortgage Performance data. According to LPS:
• The average loan in foreclosure has been delinquent a record 507 days. This is up from 406 days at the end of 2009, and up from 499 days at the end of November.
• Overall, mortgage delinquencies dropped nearly 18% in 2010.
• On the other hand, foreclosure inventories were up almost 10% in 2010, and are now at nearly 8x historical averages
• “First-time” foreclosures are on the decline, with over 30% of new foreclosure starts having been in foreclosure before
 Click on graph for larger image in graph gallery.
This graph provided by LPS Applied Analytics shows the percent delinquent, percent in foreclosure, and total non-current mortgages.
The percent in the foreclosure process is trending up because of the foreclosure moratoriums.
According to LPS, 8.83% of mortgages are delinquent (down from 9.02% in November), and another 4.15% are in the foreclosure process (up from 4.08% in November) for a total of 12.98%. It breaks down as:
• 2.56 million loans less than 90 days delinquent.
• 2.12 million loans 90+ days delinquent.
• 2.2 million loans in foreclosure process.
For a total of 6.87 million loans delinquent or in foreclosure.
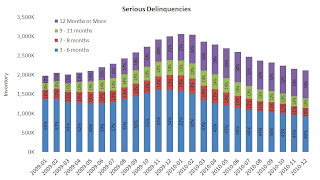
 The second graph shows the break down of serious deliquencies.
LPS reported "the share of seriously delinquent loans that have not made payments in over a year continues to increase.".
Note: I've seen some people include these 7 million delinquent loans as "shadow inventory". This is not correct because 1) some of these loans will cure, and 2) some of these homes are already listed for sale (so they are included in the visible inventory).


