 RSS Feed
 by Calculated Risk on 9/05/2010 11:45:00 AM
Sunday, September 05, 2010
Summary for Week ending Sept 4th
It was a busy week ...
The BLS reported:
1) Nonfarm payroll employment declined 54,000 in August.
2) however Decennial census employment declined 114,000.
3) so ex-Census, payrolls increased 60,000.
4) Private payrolls increased 67,000.
5) The unemployment rate increased to 9.6% from 9.5% in July.
6) Payrolls for June and July were revised up by 46,000 and 77,000 respectively.
A few graphs ...
 Click on graph for larger image.
This graph shows the job losses from the start of the employment recession, in percentage terms aligned at the bottom of the recession (Both the 1991 and 2001 recessions were flat at the bottom, so the choice was a little arbitrary).
The dotted line shows the impact of Census hiring. In August, there were only 82,000 temporary 2010 Census workers still on the payroll. The number of Census workers will continue to decline - and the remaining gap between the solid and dashed red lines will be gone soon.
Here is the graph showing the same data but aligned at the beginning of the recession.
The Employment-Population ratio increased to 58.5% in August from 58.4% in July.
 This graph shows the employment-population ratio; this is the ratio of employed Americans to the adult population.
Note: the graph doesn't start at zero to better show the change.
The Labor Force Participation Rate increased to 64.7% from 64.6% in July. This is the percentage of the working age population in the labor force. The Participation Rate is very low, and as the employment picture improves, people will return to the labor force, and that will put upward pressure on the unemployment rate.
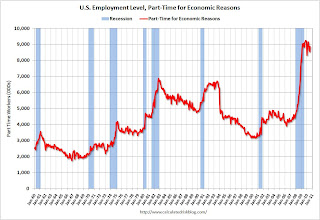
The BLS reported that "The number of persons employed part time for economic reasons ... increased by 331,000 over the month to 8.9 million."
These workers are included in the alternate measure of labor underutilization (U-6) that increased to 16.7% in August from 16.5% in July.
 This graph shows the duration of unemployment as a percent of the civilian labor force. The graph shows the number of unemployed in four categories: less than 5 week, 6 to 14 weeks, 15 to 26 weeks, and 27 weeks or more.
In August 2010, the number of unemployed for 27 weeks or more declined significantly to 6.249 million (seasonally adjusted) from 6.752 million in July. It appears the number of long term unemployed has peaked, but it is still very difficult for these people to find a job - and this is a very serious employment issue.
The 5 to 14 week category increased sharply in August and is now at the highest level since October 2009.
The underlying details of the employment report were mixed. The positives: the upward revisions to the June and July reports, a slight increase in hours worked for manufacturing employees (flat for all employees), an increase in hourly wages, and the decrease in the long term unemployed. Other positives include the slight increase in the employment-population ratio and the participation rate.
The negatives include the hiring of only 60,000 ex-Census, the increase in the unemployment rate (including U-6), and the increase in part time workers for economic reasons.
Overall this was a weak report and is consistent with a sluggish recovery.
 Based on an estimate from Autodata Corp, light vehicle sales were at a 11.47 million SAAR in August. That is down 18.9% from August 2009 (cash-for-clunkers), and down 0.5% from the July sales rate.
This graph shows the historical light vehicle sales (seasonally adjusted annual rate) from the BEA (blue) and an estimate for August (red, light vehicle sales of 11.47 million SAAR from Autodata Corp).
The high for the year was in March, and sales have moved mostly sideways since then.
S&P/Case-Shiller released the monthly Home Price Indices for June (actually a 3 month average of April, May and June).
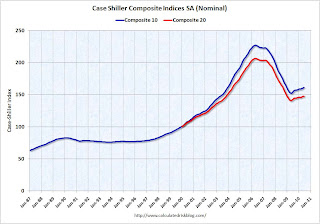 This graph shows the nominal seasonally adjusted Composite 10 and Composite 20 indices (the Composite 20 was started in January 2000).
The Composite 10 index is off 29.0% from the peak, and up 0.3% in June (SA).
The Composite 20 index is off 28.4% from the peak, and up 0.3% in June (SA).
The next graph shows the price declines from the peak for each city included in S&P/Case-Shiller indices.
 Prices increased (SA) in 9 of the 20 Case-Shiller cities in June seasonally adjusted.
Prices in Las Vegas are off 56.5% from the peak, and prices in Dallas only off 4.8% from the peak.
Prices are probably falling right now (starting in July), but this will not show up in the Case-Shiller index for a few months since this an average of three months and reported with a significant lag (this was the June report).
Overall construction spending decreased in July.
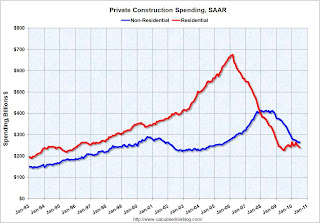 This graph shows private residential and nonresidential construction spending since 1993. Note: nominal dollars, not inflation adjusted.
From the Census Bureau: July 2010 Construction at $805.2 Billion Annual Rate
Private residential construction spending has turned down again - after the tax credit expired - and residential investment (RI) will be a drag on Q3 GDP. The "good" news is the overall drag from RI will be much smaller than during 2006, 2007 and 2008.
The Institute for Supply Management reported that the PMI increased to 56.3 in August from 55.5 in July.
 This graph shows the regional Fed manufacturing surveys and the ISM index through August.
The Fed surveys suggested that the ISM index would probably decline, but the relationship is noisy. Based on this graph I'd expect either the Fed surveys to bounce back in September - or the ISM to decline. The internals of the ISM report were soft - the new orders index declined in August to 53.1 from 53.5 in July (still expanding, but at a slower pace). And the inventory index was up for the 2nd month in a row to 51.4 - and I expect the PMI to decline in September.
 The August ISM Non-manufacturing index was at 51.5%, down from 54.3% in July. The employment index showed contraction in August at 48.2%. Note: Above 50 indicates expansion, below 50 contraction.
This graph shows the ISM non-manufacturing index (started in January 2008) and the ISM non-manufacturing employment diffusion index.
The overall ISM index, and the employment index, are both at the lowest level since January.
Best wishes to all.


