 RSS Feed
 by Calculated Risk on 8/01/2010 11:55:00 AM
Sunday, August 01, 2010
Weekly Summary and Schedule, August 1st
The key economic report this week will be the July Employment Report to be released on Friday. It will be a busy week ...
On Monday, the Census Bureau will release Construction Spending for June at 10 AM. The consensus is for a 0.5% decline in spending (although the tax credit related decline will show up in the July report). Also on Monday, the ISM manufacturing survey for July will be released at 10 AM ET. Most of the regional surveys suggest growth in the manufacturing sector slowed in July, and the consensus is for a decline in the ISM index to 54 from 56.2 in June.
Also on Monday, Fed Chairman Ben Bernanke will address the Southern Legislative Conference 64th Annual Meeting at 10:30 AM ET in Charleston, South Carolina. The title of his speech is: "Challenges for the Economy and State Governments"
On Tuesday, the BEA will release the June Personal Income and Outlays report. The consensus is for a 0.1% increase in income, and a 0.1% increase in spending. With the strong downwards revision in the GDP report for personal consumption expenditures, this report will be interesting (the savings rate increased too).
Also on Tuesday, the June Manufacturers' Shipments, Inventories and Order will be released at 10 AM, and the NAR will release Pending Home Sales for June. The collapse for pending home sales happened in May, and this report might show another slight decline.
Also on Tuesday, the automakers will report vehicle sales for July. Expectations are for about a 11.6 million SAAR for light vehicles in July – up from the 11.1 million sales rate in June. Some forecasts are even higher, from Edmunds:
Edmunds.com analysts predict that July's Seasonally Adjusted Annualized Rate (SAAR) will be 11.8 million, up from 11.1 in June 2010.Also on Tuesday, the American Bankruptcy Institute will probably report personal bankruptcy filings for July. This will probably show another "surge" in filings.
"July sales numbers should be the highest we've seen since last August's 'Cash for Clunkers' frenzy," reported Edmunds.com Senior Analyst Ray Zhou, PhD. "Retail demand for new cars this month has been the strongest of the year, even more than in March when Toyota launched an aggressive incentive campaign and other automakers followed suit."
On Wednesday, the ADP employment report will be released (consensus is for an increase of 35K private sector jobs, up from 13K in June). Also on Wednesday, the ISM non-manufacturing index for July will be released at 10 AM. The consensus is for a slight decline from the 53.8 June reading. Also on Wednesday, the MBA will release the mortgage Purchase Applications Index. This index collapsed following the tax credit, but has been bouncing around at a low level for the last couple of months.
Also on Wednesday, the quarterly NMHC Apartment Market Tightness index for July will probably be released. Last quarter this report showed a surprising tightening in the apartment market index, and some increases in effective rents.
On Thursday, the initial weekly unemployment claims report will be released. Consensus is for a slight decline to 455K from 457K last week.
And on Friday, the BLS will release the July Employment report at 8:30 AM. The consensus is for a loss of 70,000 payroll jobs in July, and for the unemployment rate to increase slightly to 9.6% (from 9.5%). Of course the minus 70,000 includes a substantial decline in the number of temporary hires for Census 2010 (May was the peak month). It will be important to remove the Census hiring to try to determine the underlying trend. Consensus is around a gain of 75,000 payroll jobs ex-Census. (see Estimate of July Decennial Census impact on payroll employment: minus 144,000 ).
As a reminder, the media stories on the employment report will be confusing because of the Census hiring. There are three numbers that will be reported:
All three numbers have meaning, but when trying to remove the impact of hiring for the decennial Census, the 2nd number is consistent with non-Census year reports.
Also on Friday the Fed will release Consumer Credit. The consensus is for another decline in credit of around $5 billion. And Friday afternoon will be another BFF (Bank Failure Friday) ...
And a summary of last week:
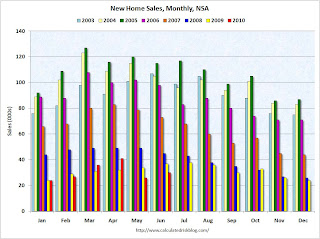
The Census Bureau reported New Home Sales in June were at a seasonally adjusted annual rate (SAAR) of 330 thousand. This is an increase from the record low of 267 thousand in May (revised from 300 thousand). Ignore all the month to previous month comparisons. May was revised down sharply and that makes the increase look significant. Here is the bottom line: this was the worst June for new home sales on record.
 Click on graph for larger image in new window.
This graph shows monthly new home sales (NSA - Not Seasonally Adjusted).
Note the Red columns for 2010. In June 2010, 30 thousand new homes were sold (NSA). This is a new record low for June.
The previous record low for the month of June was 34 thousand in 1982; the record high was 115 thousand in June 2005.
Here are more graphs based on the New Home sales report.
Special Note: I apologize for a couple of errors in my original GDP post. I make plenty of typos, but I usually get the math right. I corrected the error as soon as possible.
From the BEA:
Real gross domestic product ... increased at an annual rate of 2.4 percent in the second quarter of 2010 ... Real personal consumption expenditures increased 1.6 percent in the second quarter, compared with an increase of 1.9 percent in the first.Here is a summary of the revisions to prior years:
| Quarter | GDP before revisions | Current GDP estimate | Change |
|---|---|---|---|
| 2007-I | 1.2% | 0.9% | -0.3% |
| 2007-II | 3.2% | 3.2% | 0.0% |
| 2007-III | 3.6% | 2.3% | -1.3% |
| 2007-IV | 2.1% | 2.9% | 0.8% |
| 2008-I | -0.7% | -0.7% | 0.0% |
| 2008-II | 1.5% | 0.6% | -0.9% |
| 2008-III | -2.7% | -4.0% | -1.3% |
| 2008-IV | -5.4% | -6.8% | -1.4% |
| 2009-I | -6.4% | -4.9% | 1.5% |
| 2009-II | -0.7% | -0.7% | 0.0% |
| 2009-III | 2.2% | 1.6% | -0.6% |
| 2009-IV | 5.6% | 5.0% | -0.6% |
| 2010-I | 2.7% | 3.7% | 1.0% |
| 2010-II | 2.4% |
 The revisions indicate that the recession was worse than originally estimated, and the recovery slightly weaker.
Here is a graph of the real PCE revisions.
Annualized real PCE is now 0.85% below the pre-recession peak.
This was a substantial downward revision.
S&P/Case-Shiller released the monthly Home Price Indices for May (actually a 3 month average).
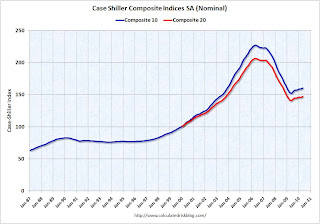 This graph shows the nominal seasonally adjusted Composite 10 and Composite 20 indices (the Composite 20 was started in January 2000).
The Composite 10 index is off 29.3% from the peak, and up 1.0% in May (SA).
The Composite 20 index is off 28.7% from the peak, and up 1.1% in May (SA).
The next graph shows the price declines from the peak for each city included in S&P/Case-Shiller indices.
 Prices increased (SA) in 15 of the 20 Case-Shiller cities in May seasonally adjusted.
Prices in Las Vegas are off 56.1% from the peak, and prices in Dallas only off 4.8% from the peak.
Note: Prices are probably starting to fall right now, but this will not show up in the Case-Shiller index for a few months.
The Census Bureau reported the homeownership and vacancy rates for Q2 2010 this week.
 The homeownership rate declined to 66.9%. This is the lowest level since 1999.
Note: graph starts at 60% to better show the change.
The homeownership rate increased in the '90s and early '00s because of changes in demographics and "innovations" in mortgage lending. The increase due to demographics (older population) will probably stick, so I've been expecting the rate to decline to the 66% to 67% range - and not all the way back to 64% to 65%.
For more on the homeownership rate, see: How far will the homeownership rate fall?
Here are graphs of the homeowner and rental vacancy rate.
Economic activity has continued to increase, on balance, since the previous survey, although the Cleveland and Kansas City Districts reported that the level of economic activity generally held steady.
Best wishes to all.


