 RSS Feed
 by Calculated Risk on 6/20/2010 11:59:00 AM
Sunday, June 20, 2010
Weekly Summary and a Look Ahead
Two key housing reports will be released this week: existing home sales on Tuesday, and new home sales on Wednesday.
On Tuesday at 10 AM, the National Association for Realtors (NAR) will release the May existing home sales report. The consensus is for an increase to 6.2 million sales in May, at a seasonally adjusted annual rate (SAAR), from 5.77 million in April (SAAR). I'll take the under because I think there will be a larger than normal fallout from pending home sales. A key number in the release will be existing home inventory. Inventory surged in April, to over 4 million homes for sale, as sellers tried to take advantage of the homebuyer tax credit. I expect inventory to decline in May.
Also on Tuesday, the FHFA house price index, and the Richmond Fed survey will be released.
On Wednesday at 10 AM, the Census Bureau will release the May New Home sales report. The consensus is for a sharp decrease in sales to around 400K (SAAR), down from 504K in April. Since new home sales are reported when a contract is signed, April was the last month that reported sales will be positively impacted by the tax credit. The May AIA's Architecture Billings Index will also be released on Wednesday (a leading indicator for commercial real estate).
Also on Wednesday, the FOMC statement will be released at 2:15 PM ET (conclusion of 2 day meeting).
On Thursday, the May Durable Goods Orders will be released at 8:30 AM. The consensus is for a 1.2% decrease. Also on Thursday, the closely watched initial weekly unemployment claims will be released. Consensus is for a decline to 465K from 472K last week.
On Friday, the third estimate of the Q1 GDP report will be released at 8:30 AM. The consensus is for no significant change (3.0% annualized growth rate). And of course the FDIC will probably have another busy Friday afternoon ...
Note: Other reports that will probably be released this week include the Moodys/REAL Commercial Property Price Index (for April) and the HAMP May report.
And a summary of last week:
 Click on graph for larger image in new window.
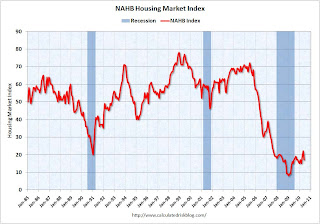
This graph shows the builder confidence index from the National Association of Home Builders (NAHB).
The housing market index (HMI) was at 17 in June. This was a sharp decline from 22 in May.
Note: any number under 50 indicates that more builders view sales conditions as poor than good.
 Total housing starts were at 593 thousand (SAAR) in May, down 10% from the revised April rate of 659,000 (revised down from 672 thousand), and up 24% from the all time record low in April 2009 of 477 thousand (the lowest level since the Census Bureau began tracking housing starts in 1959).
 Single-family starts collapsed 17.2% to 468,000 in May. This is 30% above the record low in January 2009 (360 thousand).
This was way below expectations (I took the under!), and is good news for the housing market longer term (there are too many housing units already), but bad news for the economy and employment short term.
From the Fed: Industrial production and Capacity Utilization
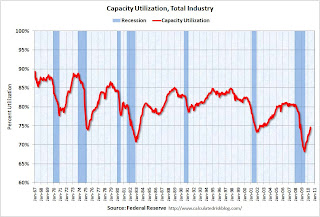 This graph shows Capacity Utilization. This series is up 9.4% from the record low set in June 2009 (the series starts in 1967).
 Capacity utilization at 73.7% is still far below normal - and 7.2% below the the pre-recession levels of 80.5% in November 2007.
Note: y-axis doesn't start at zero to better show the change.
Here is the Philadelphia Fed Index released this week: Business Outlook Survey.
 This graph shows the Philly index for the last 40 years.
The index has been positive for ten months now, but turned down "notably" in June.
This might suggest that growth in the manufacturing sector is slowing. Especially concerning is the slightly negative employment index.
 From the NAHB, framing lumber prices have collapsed since the end of April.
This graph shows two measures of lumber prices: 1) from Random Lengths (via NAHB), and 2) CME futures.
With so many mills shut down during the bust, the supply of lumber was way down - and prices surged early this year with a slight increase in construction activity. Now that construction has slowed - at the same time mills were coming back online (more supply) - prices have collapsed.
Note: the oil gusher continues ...
Best wishes to all.


