 RSS Feed
 by Calculated Risk on 6/20/2010 08:36:00 AM
Sunday, June 20, 2010
On Fannie and Freddie REO Inventory
Binyamin Appelbaum writes in the New York Times: Cost of Seizing Fannie and Freddie Surges for Taxpayers
Fannie Mae and Freddie Mac took over a foreclosed home roughly every 90 seconds during the first three months of the year. They owned 163,828 houses at the end of March, a virtual city with more houses than Seattle. The mortgage finance companies, created by Congress to help Americans buy homes, have become two of the nation’s largest landlords.The REO inventory of Fannie and Freddie (and the FHA) are increasing rapidly, but this is only a portion of the total REO inventory. The worst loans were made outside of Fannie and Freddie.
This graph shows the increase in Fannie, Freddie and FHA REOs through Q1 2010.
 Click on graph for larger image in new window.
Even with all the delays in foreclosure, the REO inventory has increased sharply over the last three quarters, from 135,868 at the end of Q2 2009, to 153,007 in Q3 2009, 172,357 at the end of Q4 2009 and now 209,500 at the end of Q4 2010.
These are new records for all three agencies.
However private label securities and banks and thrifts hold an even larger number of REOs. For more, see Tom Lawler's earlier post: REO: Agencies vs. Private Label and from James Hagerty at the WSJ in March writing about a Barclays Capital report: Supply of Foreclosed Homes on the Rise Again.
Here is the graph Tom Lawler constructed for REOs at the end of Q4 2009:
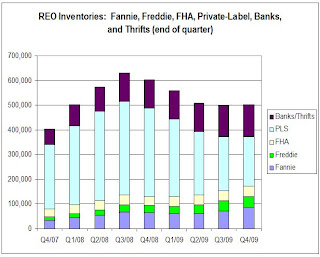 Tom wrote:
 Putting the Fannie, Freddie, FHA, and private-label data (with the latter “grossed up” assuming LP covers 85% of the market) together; making a crude assumption of units of REO at banks and thrifts (and grossing the total up to reflect non-FDIC institutions), here is a crude look at the path of REO inventories by quarter from the end of 2007 through the end of 2009. These estimates would NOT be the full market, of course, but the general pattern would probably reflect the overall market.Although this graph is only through Q4 2009, notice that the Fannie, Freddie and FHA REO are just a small part of the total!
The major problem were the loans outside of Fannie and Freddie. From Tanta in 2008:
I think we can give Fannie and Freddie their due share of responsibility for the mess we're in, while acknowledging that they were nowhere near the biggest culprits in the recent credit bubble. They may finance most of the home loans in America, but most of the home loans in America aren't the problem; the problem is that very substantial slice of home loans that went outside the Fannie and Freddie box.Of course now Fannie, Freddie and FHA are almost the entire market, and unfortunately most of the bad loans being made today are insured by the FHA - but that is a different story.


