 RSS Feed
 by Calculated Risk on 6/18/2010 07:20:00 PM
Friday, June 18, 2010
CoreLogic: House Prices increase 0.8% in April
From CoreLogic (formerly First American LoanPerformance): CoreLogic® Home Price Index Shows Year-Over-Year and Month-Over-Month Increase
National home prices increased in April, the second consecutive monthly increase. According to the CoreLogic HPI, national home prices, including distressed sales, increased by 2.6 percent in April 2010 compared to April 2009. This was an improvement over March’s yearover-year price increase of 2.3 percent. Excluding distressed sales, year-over-year prices increased in April by 2.2 percent; an improvement over the March non-distressed HPI which increased by 1.0 percent year-over-year.
On a month-over-month basis, the national average home price index increased by 0.8 percent in April 2010 compared to March 2010, which was stronger than the previous one-month increase of 0.1 percent from February to March.
...
“The monthly increase in the HPI shows the lingering effects of the homebuyer tax credit,” said Mark Fleming, chief economist for CoreLogic. “We expect that we will see home prices remain strong through early summer, but in the second half of the year we expect price growth to soften and possibly decline moderately.”
 Click on graph for larger image in new window.
 This graph shows the national LoanPerformance data since 1976. January 2000 = 100.
The index is up 2.6% over the last year, and off 29.5% from the peak.
House prices are off 3.5% from the recent peak in August 2009 (although some of the decline might be seasonal). The index bottomed in March 2009 ... and the index is up 3.1% since then.
CoreLogic expects prices to "soften and possibly decline moderately". I expect that we will see lower prices on this index later this year.
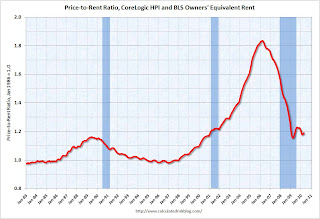 The second graph is an update on the price-to-rent ratio similar to the approach used by Fed economist John Krainer and researcher Chishen Wei in 2004: House Prices and Fundamental Value. Kainer and Wei presented a price-to-rent ratio using the OFHEO house price index and the Owners' Equivalent Rent (OER) from the BLS.
This graph shows the price to rent ratio using the CoreLogic data (January 2000 = 1.0).
This suggests that house prices are much closer to the bottom than the top, but that prices still have a ways to fall on a national basis.


