by Calculated Risk on 12/23/2008 10:35:00 AM
Tuesday, December 23, 2008
Existing Home Sales Plunge in November
From the NAR: Existing-Home Sales Decline in Economic Uncertainty
Existing-home sales – including single-family, townhomes, condominiums and co-ops – fell 8.6 percent to a seasonally adjusted annual rate of 4.49 million units in November from a downwardly revised level of 4.91 million in October, and are 10.6 percent below the 5.02 million-unit pace in November 2007.
Lawrence Yun, NAR chief economist, expected a decline. “The quickly deteriorating conditions in the job market, stock market, and consumer confidence in October and November have knocked down home sales to another level. We hope the home sales impact from the stock market crash turns out to be short-lived, as was the case in 1987 and 2001,” he said.
...
Total housing inventory at the end of November rose 0.1 percent to 4.20 million existing homes available for sale, which represents an 11.2-month supply at the current sales pace, up from a 10.3-month supply in October.
 Click on graph for larger image in new window.
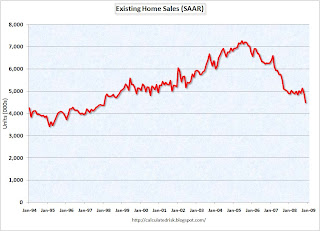
The first graph shows existing home sales, on a Seasonally Adjusted Annual Rate (SAAR) basis since 1993.
Sales in November 2008 (4.49 million SAAR) were 8.6% lower than last month, and were 10.5% lower than November 2007 (5.02 million SAAR).
It's important to note that a large percentage of these sales were foreclosure resales (banks selling foreclosed properties). NAR economist Yun suggested said a couple of months ago that "distressed sales are currently 35 to 40 percent of transactions". Distressed sales include foreclosure resales and short sales. Although these are real transactions, this means activity (ex-foreclosures) is running around 3 million units SAAR.
 The second graph shows nationwide inventory for existing homes. According to NAR, inventory increased slightly to 4.20 million in November, from an all time record of 4.57 million homes for sale in July. Usually inventory peaks in mid-Summer, so July was the peak for inventory this year.
 It is a little unusual for supply to increase in November (from October), and looking forward, usually supply falls sharply in December as homeowners take their properties off the market for the holidays. Something to watch for next month.
Most REOs (bank owned properties) are included in the inventory because they are listed - but not all. Some houses in the foreclosure process are listed as short sales - so those would be counted too.
 The third graph shows the 'months of supply' metric for the last six years.
Months of supply increased to 11.2 months.
This follows the highest year end months of supply since 1982 (the all time record of 11.5 months of supply).
I still expect sales to fall further over the next few months, although inventory has peaked for the year. I'll have more on existing home sales soon ...


