 RSS Feed
 by Calculated Risk on 7/31/2005 01:59:00 PM
Sunday, July 31, 2005

Friday, July 29, 2005
Bernanke: House Prices Unlikely to Decline
by Calculated Risk on 7/29/2005 08:07:00 PM
Bernanke was on CNBC today. From Reuters:
Top White House economic adviser Ben Bernanke said on Friday strong U.S. housing prices reflect a healthy economy and he doubts there will be a national decline in prices.Is it too early to start talking about the "Bernanke Put"?
"House prices have gone up a lot," Bernanke said in an interview on CNBC television. "It seems pretty clear, though, that there are a lot of strong fundamentals underlying that.
"The economy is strong. Jobs have been strong, incomes have been strong, mortgage rates have been very low," the chairman of the White House Council of Economic Advisers said.
The pace of housing prices may slow at some point, Bernanke said, but they are unlikely to drop on a national basis.
"We've never had a decline in housing prices on a nationwide basis," he said, "What I think is more likely is that house prices will slow, maybe stabilize ... I don't think it's going to drive the economy too far from its full-employment path, though."
Fed's Yellen: Fed Could Manage Housing Price Drop Impact
by Calculated Risk on 7/29/2005 04:15:00 PM
Federal Reserve Bank of San Francisco President Janet Yellen spoke at a Community Leaders' Luncheon in Portland, Oregon. On housing, Dr. Yellen said:
"... if a sizable reversal in house prices were to occur, it probably would affect the economy mainly through the lagged effects of declines in wealth and increases in interest rates, rather than through widespread financial disruptions."Her speech was very upbeat, but she did ask:
You might well ask, “What about oil prices?” “What about the record trade deficit?” “What about the possibility of a housing bubble?” “What about the ‘conundrum’ of surprisingly low long-term interest rates?”Her answer on housing:
Whatever the source of the conundrum, clearly low long-term rates have contributed to the continuing boom in the housing market. The share of residential investment in GDP is now at its highest level in decades. The question on everyone’s mind, of course, is whether this source of strength in the economy could reverse course and become instead a source of weakness. Put more bluntly: Is there a housing “bubble” that might collapse, and if so, what would that mean for the economy? To begin to answer this question, we need to know what we mean by the term “bubble.” A bubble does not just mean that prices are rising rapidly—it’s more complicated than that. Instead, a bubble means that the price of an asset—in this case, housing—is significantly higher than its fundamental value.
One common way of thinking about housing’s fundamental value is to consider the ratio of housing prices to rents. The price-to-rent ratio is equivalent to the price-to-dividend ratio for stocks. In the case of housing, rents reflect the flow of benefits obtained from housing assets—either the monetary return from rental property, or the value of living in owner-occupied housing. Historically, the ratio for the nation as a whole has had many ups and downs, but over time it has tended to return to its long-run average. Thus, when the price-to-rent ratio is high, housing prices tend to grow more slowly or fall for a time, and when the ratio is low, prices tend to rise more rapidly. I want to emphasize, though, that this is a loose relationship that can be counted on only for rough guidance rather than a precise reading.
Currently, the ratio for the country is higher than at any time since data became available in 1970—about 25 percent above its long-run average. Of course, the results vary widely from place to place. For Los Angeles and San Francisco, the price-to-rent ratio is about 40 percent higher than the normal level, while for Cleveland the ratio is very near its historical average.
Closer to home, the figure for Seattle is just over 35. For Portland, it turns out that the price-to-rent ratio is a bit anomalous. Unlike the ratio for the nation and many of the cities I’ve mentioned, Portland’s ratio has been trending up, and this pattern has been going on since the late 1980s. This means that there’s not a stable long-run average ratio to use as a comparison for today’s ratio, so the analysis we did for the other cities wouldn’t be that meaningful for Portland. What we do know is that the pace of home price appreciation in Portland has been close to the national pace over the past few years, lagging behind somewhat in 2003 as the state struggled to recover from the 2001 recession, but mostly catching up in 2004 and early 2005 as economic growth picked up noticeably in the state. As of early this year, home prices in the Portland area were up 12 percent over a year earlier, only a bit below the national pace of 12½ percent. More recently, I’ve heard reports that upscale homes in the Portland area are increasingly being sold at above-asking price—a phenomenon we’re all too familiar with in the Bay Area! So it’s clear that Portland’s housing market has been hot, but I’m sure that’s no surprise to you.
In any event, as I said before, the fact that the ratios for the nation and many areas of the country are higher than normal doesn’t necessarily prove that there’s a bubble. House prices could be high for some good reasons that affect their fundamental value. The most obvious reason is the low level of mortgage rates. This stems both from very stimulative monetary policy and from the conundrum I discussed earlier. Conventional mortgage rates have dropped from around 6 percent in early 2004 to around 5 percent recently.
Other factors could also be raising housing’s fundamental value. For example, recent changes in tax laws may be having an effect. In 1998, tax rates on capital gains were lowered and the exemption from capital gains taxation for housing was raised to $500,000. Both of these changes would reduce the potential tax bite from selling one home and buying another. Another development, which may be making housing more like an investment vehicle, is that it’s now easier and cheaper to get at the equity—either through refinancing, which has become a less costly process, or through an equity line of credit. Both of these innovations in mortgage markets make the funds invested in houses more liquid.
So there are good reasons to think that fundamental factors have played a role in the unusually high price-to-rent ratio. But the bottom line here is fuzzy. It’s very hard to say how big a role these factors have played, so we don’t know how much remains unexplained. Frankly, even the best available estimates are imprecise, and they don’t definitively answer the question: Is there a bubble, and if there is, how large is it?
Given this uncertainty, my focus as a monetary policymaker is on trying to understand what kind of risks a drop in house prices would pose for the economy. One of the classic ways to do this is to ask “What if…?”—in other words, to pose a purely hypothetical question. In this case, the “what if” question might be, “What’s the likely effect if national house prices did fall by 25 percent, enough to bring the price-to-rent ratio back to its historical average?” Before going any further, I want to emphasize that I’m not making any predictions about house price movements, but instead, simply discussing how a prudent monetary policymaker could assess the risk.
First, there would be an effect on consumers’ wealth. With housing wealth nearing $18 trillion today, such a drop in house prices would extinguish about $4½ trillion of household wealth—equal to about 38 percent of GDP. Standard estimates suggest that for each dollar of wealth lost, households tend to cut back on spending by around 3½ cents. This amounts to a decrease in consumer spending of about 1¼ percent of GDP. To get some perspective on how big the effect would be, it’s worth comparing it with the stock market decline that began in early 2000. In that episode, the extinction of wealth was much greater—stock market wealth fell by $8½ trillion from March 2000 to the end of 2002. This suggests that if house prices were to drop by 25 percent, the impact on the economy might be about half what it was when the stock market turned down a few years ago.
Moreover, the spending pullback wouldn’t happen all of a sudden. Wealth effects—positive or negative—tend to affect spending with fairly long lags. So, a drop in house prices probably would lead to a gradual cutback in spending, giving the Fed time to respond by lowering short-term interest rates and keeping the economy steady.
Now let’s complicate things. Suppose house prices started falling because bond and mortgage interest rates started rising as the conundrum was resolved, say, because the risk premium in bonds rose due to concerns about federal budget deficits or other factors. Then we’d have the cutback in spending because of the wealth effect, plus there’d likely be further spending cutbacks, as borrowing costs for households rose. Furthermore, a rise in long-term rates would have effects beyond just households—it also would dampen business investment in capital goods through a higher cost of capital.
How manageable would this scenario be? Like the wealth effect, these added interest-rate effects operate with a lag, so, again, there probably would be time for monetary policy to respond by lowering short-term interest rates. This obviously would not be a “slam dunk,” but in many circumstances it would seem manageable.
A matter of more concern is whether this scenario would lead to financial disruptions that could cause spending to slow sharply and quickly. One issue that receives a lot of attention is the increasing use of potentially riskier types of loans, like variable rate and interest-only loans that may make borrowers and lenders vulnerable to a fall in house prices or increase in interest rates. I believe that the odds of widespread financial disruption on this count are fairly slim, although, clearly, some borrowers are vulnerable. First, the shift to these new instruments appears relatively modest overall. Second, the equity cushions available to both borrowers and lenders still seem, on average, to be pretty substantial. This is evident in looking at loan-to-value ratios, which have fallen, on average, as home valuations have risen faster than mortgage debt. In addition, most financial institutions enjoy comfortable capital positions, so they’re better able to weather any problems with their mortgage portfolios. Finally, some of the risk associated with mortgages has been transferred from banks to investors, as banks have sold off securitized bundles of mortgage debt. These investors may be in a better position to handle the associated risk. So, while there undoubtedly would be some fallout from a substantial drop in house prices, the financial system and consumers appear to be in reasonably good shape to handle the situation.
GDP: Three Takes
by Calculated Risk on 7/29/2005 03:11:00 PM
Dr. Duy considers how the FED will review the GDP data: Fed Watch: A Week of Data That Point to More Tightening ...
And Dr. Hamilton presents: New GDP data and recession probabilities
And pgl is reasonably positive on GDP: Strong Fixed Investment Demand Growth.
Three interesting views.
For those with positive views on the economy, there is nothing in this report that will change their opinion. For those that are negative on the economy (because of the housing bubble, current account and fiscal deficits, etc.), there is nothing in this report that will sway them either.
Dr. Aigner: Trouble in housing market no game
by Calculated Risk on 7/29/2005 11:06:00 AM
Economics Professor and former Dean of the UCI Graduate School of Management Dennis Aigner writes in the OC Register: Trouble in housing market no game, Region's house of cards ready to topple as prices reach unsustainable levels.
Are you familiar with the game Jenga, where players successively remove small wooden blocks from the bottom of a tower and place them on top, creating a progressively more unstable situation until one player causes the whole structure to tumble? (Our family record is 31 courses, by the way, if you want to compare notes.) The remaining players yell, Jenga!, we all clean up the mess, restack the blocks and begin again.See Dr. Aigner's commentary for some comparisons to foreign markets.
That's basically what's about to happen very soon in parts of California and several other "hot" housing markets around the country. Merrill Lynch recently issued a "bubble" warning for six California housing markets - San Diego, the Inland Empire, Los Angeles, San Francisco, San Jose and Sacramento, where "affordability" indexes are at historic lows. In other words, household incomes are way out-of-sync with home prices.
... it won't take a big uptick in mortgage interest rates to trigger a slow-down or retrenchment in prices, and the argument that such high prices are justified by insufficient supply coupled with strong demand just doesn't hold water now that we have gone beyond all rationality with respect to affordability across the board.
We're in the midst of a classic speculative bubble, and even the venerable Alan Greenspan referred to a bit of "froth" in certain housing markets in a recent speech. The UCLA Anderson Forecast, which has been warning of a break in the bubble for the past couple of years, echoed that warning again in its latest quarterly update and predicted a recession to follow even if it's a "soft landing."
A hard landing is more likely (where nominal prices actually fall) because houses are more overvalued than in past booms, inflation is lower and many people have been buying houses as investments.
But the most compelling evidence of a bursting bubble to come is the divergence of home prices and rents. In the United States over the past decade the ratio of home prices to rents has increased by almost 40 percent.
The increase is much higher in hot housing markets like Orange County (99 percent), where the ratio of median home price to average monthly rent now stands at 433:1.
To re-calibrate to more reasonable historical levels will require rents to rise sharply, which is constrained by household income growth, or home prices will have to fall, the only other possibility.
...
Over the past four years, 90 percent of the growth in U.S. GDP was accounted for by consumer spending and residential construction. Declines in the nation's biggest housing markets are likely to trigger a major economic slowdown.
It is not a question of whether this will happen but when, how dire will be the consequences on economic growth, and how long it will take to restack the blocks and begin again.
WSJ: What Housing Bubble?
by Calculated Risk on 7/29/2005 02:32:00 AM
Neil Barsky writes in the WSJ "What Housing Bubble?"
If you want to be scared out of your wits these days, you basically have two choices: go watch Steven Spielberg's latest, or listen to the hysterical warnings of economists and journalists about the imminent popping of our so-called housing bubble.I think I missed out on those "parental contributions"! Barsky lists 3 myths:
...
The reality is this: There is no housing bubble in this country. Our strong housing market is a function of myriad factors with real economic underpinnings: low interest rates, local job growth, the emotional attachment one has for one's home, one's view of one's future earning- power, and parental contributions, all have done their part to contribute to rising home prices.
• Myth #1. There is too much capacity: According to Census data, over the past 10 years, housing permits have averaged about 1.63 million units per year -- including multifamily units. Household formation has averaged 1.49 million families per year. So far, so good. But ... Roughly 6% of the new home sales were for second homes ... approximately 360,000 units every year were torn down either because they were nonfunctional, or because they were "tear-downs." When the latter two numbers are taken into account, the real number of new homes is closer to 1.2 million, or 19% fewer than the average number of new households formed each year.
• Myth #2. Risky mortgage products are fueling house appreciation: Sages from Warren Buffett to Alan Greenspan have warned of the increased risk from the use of new mortgage products, particularly adjustable-rate mortgages and interest-only mortgages. The theory here is that buyers are extending themselves to make payments, and when their mortgages reset they will be in trouble. ... As virtually every mortgagee in the country knows, most ARMs are fixed rate for the first two to seven years. Virtually all have 2% interest-rate caps. The average American owns his home for seven years. Why pay several hundred basis points to lock in rates he is highly unlikely to take advantage of?
• Myth #3. Speculators are Driving Home Prices: The media today is chock-full of stories of day-trading dot-com refugees who have found their calling buying homes and condos "on spec," with the hope of flipping the property for a higher price. Earlier this month, one Wall Street analyst published an article with the catchy headline: "Investors Gone Wild: An Analysis of Real Estate Speculation." Scary ... again, some common-sense thinking is in order. In Manhattan, where I live, friends buy apartments kicking and screaming, convinced they top-ticked the housing market. Is Manhattan special? Are speculators flipping Palm Beach mansions? I don't think so. Yet these markets are experiencing the same price appreciation as Las Vegas, Phoenix and Florida, where real estate investors are supposedly driving prices higher.
Thursday, July 28, 2005
Housing Mortgage Trends
by Calculated Risk on 7/28/2005 06:09:00 PM
UPDATE: Also see Asha Bangalore's (pdf) Signs of Distress in the Effervescent Housing Market?
Fitch Ratings released a newsletter "RMBS Mortgage Principles and Interest" this week. (RMBS: Residential Mortgage Backed Securities)
There were several interesting trends.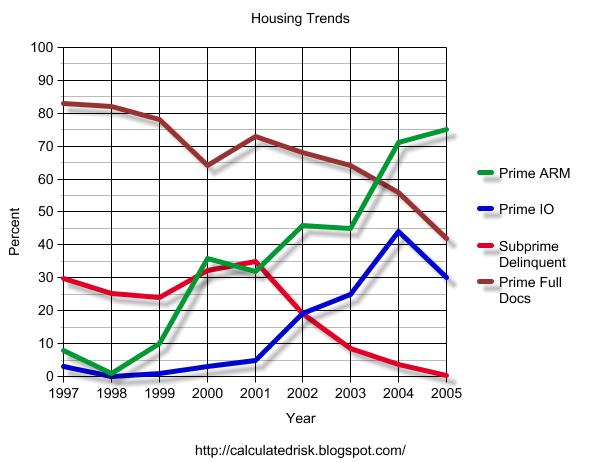 Click on graph for larger image.
The percentage of prime loans using ARMs and IOs has been increasing (IOs have dipped slightly so far in '05). The same pattern can be seen for subprime loans (not graphed).
At the same time, the percentage of loans requiring full documentation has dropped significantly.
UPDATE: tanta points out that these are old pools with "junk that can't prepay". Ignore this section on subprime delinquencies ... nothing of value here! Also of interest is the percent of subprime loans (the fastest growing segment) that are in delinquency. Although delinquency rates were around 30% (over 60 days late) for a number of years, recently the rate has fallen to almost zero. Also, I believe the extensive use of ARMs and IOs indicates excessive leverage, even in the prime market.
Lower delinquencies would usually be good, but I am concerned if the housing market slows that delinquency rates will return to the 30% range on subprimes.
Wednesday, July 27, 2005
Dr. Baker: Housing Bubble Fact Sheet
by Calculated Risk on 7/27/2005 10:51:00 PM
Dr. Dean Baker of Center for Economic Policy Research (CEPR) has put out "The Housing Bubble Fact Sheet". (thanks to Ficus for the tip).
1. The unprecedented rise in house prices has dangerous implications for the economy.Read Dr. Baker's fact sheet for the details. I agree with most of his points, but Baker is more pessimistic than me.
2. The housing bubble has created more than $5 trillion in bubble wealth, the equivalent of $70,000 per average family of four.
3. The increase in house prices is not being driven by fundamental factors in the housing market, such as income and population growth.
4. The housing bubble regions are large enough to have a major impact on the national economy.
5. The collapse of the housing bubble will throw the economy into a recession, and quite likely a severe recession.
6. The collapse of the housing bubble is likely to put major strains on the financial system and require a federal bailout of the mortgage market.
7. The sooner house prices drop, the less economic damage there will be.
8. The housing bubble could pop from higher interest rates, but it could also deflate even if interest rates stay low.
Bernanke's Bunkum
by Calculated Risk on 7/27/2005 06:02:00 PM
Dr. Thoma excerpts from Bernanke's commentary in the WSJ. Clearly Bernanke has been drinking the Bush Administration Kool-Aid.
How can anyone claim the Bush Administration has been pursuing "good economic policies" with respect to the budget deficit? That is outlandish.
And on jobs, I've cut the Bush Administration slack. But there is a difference between "cutting them slack" and giving them credit - The Bush Administration deserves no credit on jobs! Since Bush has taken office there have been a total of 161 thousand non-farm private sector jobs created. That is the worst net job creation performance in over 70 years.
The entire commentary is bunkum. But instead of correcting each of Bernanke's false assertions, I've found the template for his talking points:
No Congress of the United States ever assembled, on surveying the state of the Union, has met with a more pleasing prospect than that which appears at the present time. In the domestic field there is tranquillity and contentment, harmonious relations between management and wage earner, freedom from industrial strife, and the highest record of years of prosperity.Calvin Coolidge, State of the Union Address, December 4, 1928
Bernanke is now channeling Coolidge's monument to economic shortsightedness.
Housing: More stories on Inventories
by Calculated Risk on 7/27/2005 01:12:00 PM
Here are three more stories that back up my prediction for July.
New Hampshire: Real Estate Listings In Area Skyrocketing
Along a 2-mile stretch of Route 302 - from Bethlehem Junction to the Memory Lane Apartments - the landscape is dotted with "for sale" signs.Florida: More Strand homes for sale
...
As a result, the number of real estate listings in the greater Littleton area - including Bethlehem - have doubled since this time last year.
...
"Right near me every place is for sale,"
Home listings in the second quarter jumped 9 percent, from 2,916 to 3,165. Condo listings increased 36 percent from 2,636 to 3,584, according to the Multiple Listing Service for Horry and Georgetown counties.California: Higher inventory takes some zing out of sellers' edge that dominated '04
Meanwhile, the latest level of unsold inventory [in Palm Springs], at about 3,296 homes - more than 80 percent higher than a year ago and more than twice the level of April 2004 - suggests that the market is reaching an equilibrium between the needs of buyers and sellers.
"This is not a buyer's market yet," said Greg Berkemer, executive vice president of the California Desert Association of Realtors. "It's just less of a seller's market than it was a year ago."
June: Record New Home Sales
by Calculated Risk on 7/27/2005 11:00:00 AM
According to a Census Bureau report, New Home Sales in June were at a seasonally adjusted annual rate of 1.374 million vs. market expectations of 1.3 million. May sales were revised up to 1.321 million from 1.271 million.
Click on Graph for larger image.
NOTE: The graph starts at 700 thousand units per month to better show monthly variation.
Sales of new one-family houses in June 2005 were at a seasonally adjusted annual rate of 1,374,000, according to estimates released jointly today by the U.S. Census Bureau and the Department of Housing and Urban Development.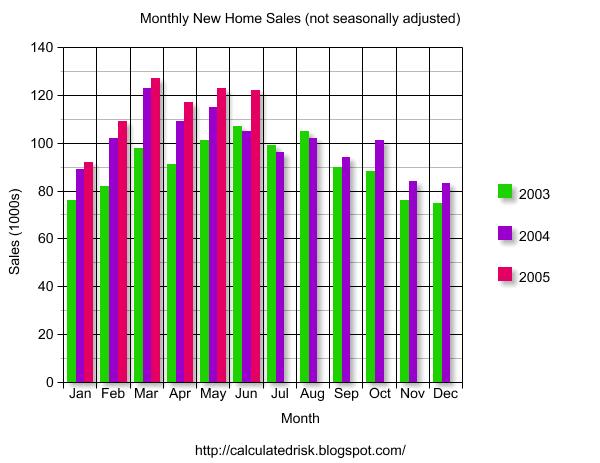
The Not Seasonally Adjusted monthly rate was 122,000 New Homes sold, down from a revised 123,000 in May.
The median sales price of new houses sold in June 2005 was $214,800; the average sales price was $267,400.
The average sales price is down and the median price is the lowest since September of 2004.
The seasonally adjusted estimate of new houses for sale at the end of June was 454,000. This represents a supply of 4.0 months at the current sales rate.
The seasonally adjusted supply of New Homes was 4.0 months, about normal for the last few years.
Tuesday, July 26, 2005
Housing Inventories
by Calculated Risk on 7/26/2005 02:22:00 AM
Existing home inventories rose to 2.653 million in June. Because sales were so strong (7.33 million annual rate), this represented a supply of 4.3 months.
I expect a further increase in inventories based on recent articles like this one: D.C. Area Housing Market Cools Off.
Home sales tend to slow in the summer, but the number of houses for sale in the Washington area has climbed by 50 percent in recent months. The available inventory has risen to about 35,300 homes, up from an average of about 23,000 in the past three years....Therefore I expect a further increase in July inventories to 2.9+ million (from 2.653 million in June). I also expect to see a small drop in July sales to maybe around 6.8 million (still very strong) annual rate.
If both of these predictions hold, this computes to a 5.1 month supply - the highest level in a number of years.
Monday, July 25, 2005
DiMartino: Bubble's Fallout?
by Calculated Risk on 7/25/2005 10:52:00 PM
DiMartino disagrees with Greenspan on the housing bubble:
There's a good chance the housing bubble carries severe macroeconomic implications, a point Alan Greenspan disputed in his congressional testimony last week.I tried to quantify the impact of the housing bust on the economy on Angry Bear. DiMartino does a better job:
If prices fall, he said, "they likely would be accompanied by some economic stress, though the macroeconomic implications need not be substantial."
Let's start with some factoids from Merrill Lynch:
•Real estate accounts for 70 percent of the rise in household net worth since 2001.
•Forty percent of private-sector jobs created since then are housing-related.
•Consumer spending and residential construction have accounted for 90 percent of U.S. economic growth.
The inevitable pullback in construction speaks directly to housing's risks. A similar 40 percent decline in construction to that of the 1981-82 recession implies a decline of 2 percentage points in GDP.
And then there's the wealth effect. The housing bubble has added $5 trillion to household net worth, equating to about $70,000 for a family of four.
"The large wealth effect associated with the housing bubble, which has spurred a consumption boom in the last few years, will go into reverse as housing prices plummet," Mr. Baker predicted.
This dent in consumption would whack an additional 1.6 to 2.5 percentage points off GDP growth. Totaled out, that GDP retreat about equals current GDP growth.
Maybe I'm being obtuse, but a recession is about as macro as you can get, economically speaking.
Maybe the best thing to do is respectfully agree to disagree with Mr. Greenspan and let time render its own decision.
Contract Oil Prices
by Calculated Risk on 7/25/2005 05:49:00 PM
Back in April, on Angry Bear, I suggested that a sustained oil contract price above $50 per barrel might lead to a recession.
UPDATE: By "contract" I mean actual price paid for oil, not Futures contract. The DOE provides the average price paid per contract on a weekly basis. When measuring the impact on the economy, I want to look at the actual dollars paid. Sorry for any confusion.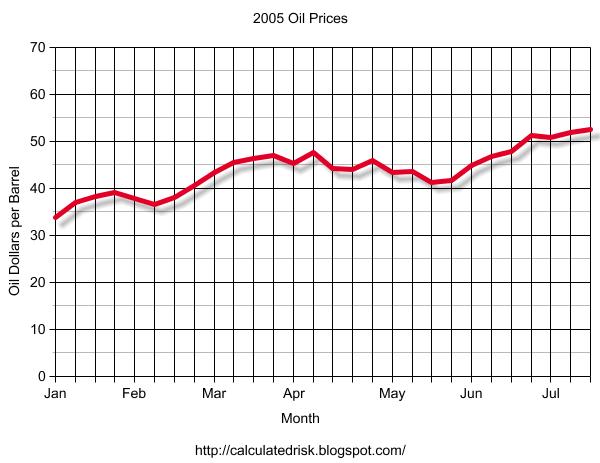
Click on graph for larger image.
The average contract price for a barrel of oil has been above $50 for four consecutive weeks.
The DOE expects this trend to continue and they are projecting spot prices to "average $59 per barrel for the third quarter of 2005" and "above $55 per barrel for the rest of 2005 and 2006".
NOTE: Actual contract prices are usually $5 to $10 per barrel below spot prices.
Based on my earlier calculations, I believe the price of oil is now in the danger zone for the economy. The good news is the price is being driven by growing demand as opposed to a supply shock like in '73 and '79. We will probably see some slackening of demand in the near future and that should lead to somewhat lower prices.
EDIT: Greenspan believes the current price of oil will not hurt the economy:
Should the prices of crude oil and natural gas flatten out after their recent run-up--the forecast currently embedded in futures markets--the prospects for aggregate demand appear favorable.However he cautioned:
Energy prices represent a second major uncertainty in the economic outlook. A further rise could cut materially into private spending and thus damp the rate of economic expansion.
Sunday, July 24, 2005
Premature Celebration
by Calculated Risk on 7/24/2005 10:13:00 PM
On Angry Bear I discuss a tale of two governors and the danger of premature fiscal celebrating. We should also consider the recent premature celebration by the Bush Administration.
Click on graph for larger image.
This graph shows the Year to Date (July 21st) and full fiscal year increase in the National Debt for 2001 through 2005.
The graph shows that for YTD fiscal 2005 (Oct 1, 2004 - July 21, 2005), the National Debt has increased $489.6 Billion. This is almost the same as for the equivalent period for the previous two years. Last year for the same period was $494.5 Billion.
Not exactly cause for celebration.
I will stick to my earlier prediction that the National Debt will increase more in Fiscal 2005 than in Fiscal 2004. It will probably be close, but this is far from the claims of the Bush Administration. Of course the Bush Administration isn't talking about reductions in the increase in the debt, they are discussing improvements in "forecasts" for the Enron style "Unified Budget".
Housing: "Rapid shifts putting chill on hot June data"
by Calculated Risk on 7/24/2005 04:06:00 PM
Rising inventories is the story in many housing bubble areas. The Sacramento Bee reports:
While the latest sales statistics for June show more of the same - a strong market with rising prices - many agents and brokers say the lagging data don't reflect recent market trends. The number of homes for sale has risen to levels not seen since the late 1990s, they say, and buyer psychology is changing fast.I think the surge in inventories will show up in June's Existing Home Sales numbers (released this coming week), but we may have to wait until the July numbers are released.
"We are in a shifting situation right now," said broker Pam Petterle, the manager for Prudential California Realty's Sacramento-Tahoe region. "The biggest change is that we have a much greater inventory ... and that's a major change because it shifts the balance from sellers driving this market to a more balanced market. There are not as many multiple offers, and listings are staying on the market longer."
At the end of June, the inventory of resale homes on the market in Sacramento, Placer, El Dorado and Yolo counties rose to 6,246. It was the highest for any June since 1999 and the most for any month since September 2001, according to TrendGraphix, a local data firm affiliated with Lyon Real Estate.
Saturday, July 23, 2005
Housing, Jobs and Bernanke Revisited
by Calculated Risk on 7/23/2005 02:02:00 AM
The Press-Enterprise quotes UCLA economist Christopher Thornberg on California's Inland Empire:
Thornberg also agreed ... that construction is the Inland area's economic driver -- a situation he finds troubling for the area.In a previous post I suggested CEA Chairman Bernanke misspoke when he argued that jobs were a driving factor in higher home prices. Dr. Hamilton of Econobrowser came to Bernanke's defense showing that there was some correlation between jobs and higher home prices (on a per state basis over the last 5 years). However, I believe Dr. Hamilton confused correlation with causation.
"There's a housing bubble and it's going to burst," he said. "When it does, everything else is going to start falling like dominoes behind it."
NOTE ADDED: I really enjoy Dr. Hamilton's blog and recommend it highly. I just disagree with him on this point.
I've argued for some time that the housing bubble was leading to RE related job creation (not the inverse). Apparently Dr. Thornberg agrees with me. In fact, if you back out RE related jobs, the correlation between jobs and housing prices appears to disappear.
I only analyzed a few states since this is a big job and the state by state BLS data varies. I looked at the boom states of California and Nevada, and bust states Ohio and Tennessee. In California, 309K of the 361K jobs added since March 2000 were RE related. In Nevada, it is 83K out of 189K. The reverse is true for Ohio and Tennessee; both of these states have lost RE related jobs. Although this isn't definitive, I would argue that the causation is the housing bubble is creating jobs - not jobs leading to higher housing prices.
To echo Dr. Thornberg: There is a housing bubble, it is going to burst, and those areas dependent on housing related jobs will experience a snowball economic effect.
Friday, July 22, 2005
Housing: Storm Clouds?
by Calculated Risk on 7/22/2005 01:35:00 PM
Next week, the National Association of Realtors will report June Existing Home Sales. Also, the Census Bureau will report New Home Sales. I expect the sales numbers to be strong, but I will be looking closely at inventories. There have been numerous local area reports of rising existing home inventories for June, and this report should tell us if rising inventories is a widespread phenomenon.
Click on graph for larger image.
Inventories have been relatively flat for the last year with normal seasonal fluctuations.
A jump in inventories to 2.7+ million would probably be a warning sign for the housing market.
On another note, General Glut predicts "The end of ultra-easy mortgage money". Gen'l Glut writes: "These interest rate hikes should hit ARM-dependent markets in particular -- and that means California." I concur.
The Mortgage Bankers Association reports:
The adjustable-rate mortgage (ARM) share of activity increased to 28.5 percent of total applications from 27.9 percent the previous week.Given the spread between the various mortgage products, I'm surprised anyone is using an ARM. The breakeven point for a 30 year fixed rate mortgage vs. a 1 year ARM is less than 3 years. For those using a 5/1 year ARM (fixed for 5 years), the rate is the same as a 15 year fixed!
Since 28% of all application are for ARMs, this probably means:
1) Buyers think interest rates will decline in the future, or
2) Buyers are planning on moving within 3 years, or
3) Buyers can only qualify with a reduced payment.
None of these reasons seem compelling. I think this is more evidence of speculation / excessive leverage.
UPDATE: Rising "Workouts" (Thanks to Ben Jones)
Typically, mortgage delinquencies and foreclosures result from an unexpected financial crisis - a job loss or medical illness that leaves homeowners unable to pay the bills. But now experts are warning that homeowners who - thanks to low rates - have taken on more debt than they should have, face a growing risk of mortgage delinquencies and foreclosures.
Indeed, the first signs of it are starting to emerge. The number of homeowners seeking loan workouts reached 89,741 in the first quarter of 2005, compared with 155,495 for all of 2004, according to the U.S. Department of Housing and Urban Development.
Last month, Standard & Poor's Ratings Services in New York said the risk of defaults is growing on certain adjustable-rate mortgages. These loans initially can lower monthly mortgage payments, allowing some buyers to purchase homes they otherwise couldn't afford. Some borrowers may face increases in their monthly payments of 50% to 90% when the low-rate period ends, S&P warned, and homeowners who haven't planned carefully, or whose income proves insufficient, may default.
"With some of the very unique and potentially risky loan products out there now, and the very high rate at which they're being used, it could turn into the full employment act for loan workout specialists," says Laurie Maggiano, deputy director of the office of single family asset management at HUD.
Thursday, July 21, 2005
Federal Reserve on Housing (June Minutes)
by Calculated Risk on 7/21/2005 02:04:00 PM
Federal Reserve minutes for June. Here are some excerpts on housing:
At this meeting the Committee reviewed and discussed staff presentations on the topic of housing valuations and monetary policy. Prices of houses in the United States had risen sharply in recent years, especially in certain areas of the country, to very high levels relative to incomes or rents. In addition to local market factors, a wide range of influences appeared to be supporting home prices, including solid gains in disposable income, low mortgage rates, and financial innovation in the residential mortgage market. Prices might be somewhat above the levels consistent with these underlying factors, but measuring the extent of any overvaluation either nationally or in regional markets posed considerable conceptual and statistical difficulties. Meeting participants noted that the rise in house prices had been accompanied by a modest shift toward potentially riskier types of mortgages, including adjustable-rate and interest-only loans, which could pose challenges to both lenders and borrowers. Nonetheless, financial institutions generally remained in a comfortable capital position, such loans had performed well thus far, much of the associated risk had been transferred to other investors through securitization, and valuations had risen more rapidly than mortgage debt on average--so that loan-to-value ratios had fallen.
Activity in the housing sector remained robust. Single-family starts averaged more than 1.65 million units at an annual rate in April and May, not much below the very strong first-quarter pace. Sales of both new and existing homes remained at a high level in May. While prices of existing homes continued to increase rapidly, new home prices showed signs of decelerating. Available indicators suggested that, with the ongoing support of low mortgage rates, the housing sector remained strong in June.
With regard to any role for monetary policy in responding to possible imbalances in housing or bond markets, meeting participants stressed the importance of the pursuit of their core objectives of price stability and maximum sustainable economic growth. To the extent that an asset price movement threatened the achievement of those objectives, it would of course be taken into consideration in setting policy. However, given the unavoidable uncertainties associated with judgments regarding the appropriate level of and likely future movements in asset prices, a strategy of responding more directly to possible mispricing was seen as very unlikely to contribute, on balance, to the achievement of the Committee's objectives over time.My interpretation: "There is a problem. There is nothing we can do." This is eerily reminiscent of minutes from the FED in late '99 concerning the NASDAQ.
Wednesday, July 20, 2005
Greenspan on Housing
by Calculated Risk on 7/20/2005 12:23:00 PM
Testimony of Chairman Alan Greenspan July 20, 2005. A short housing excerpt:
... they suggest that risk takers have been encouraged by a perceived increase in economic stability to reach out to more distant time horizons. These actions have been accompanied by significant declines in measures of expected volatility in equity and credit markets inferred from prices of stock and bond options and narrow credit risk premiums. History cautions that long periods of relative stability often engender unrealistic expectations of its permanence and, at times, may lead to financial excess and economic stress.
Such perceptions, many observers believe, are contributing to the boom in home prices and creating some associated risks. And, certainly, the exceptionally low interest rates on ten-year Treasury notes, and hence on home mortgages, have been a major factor in the recent surge of homebuilding, home turnover, and particularly in the steep climb in home prices. Whether home prices on average for the nation as a whole are overvalued relative to underlying determinants is difficult to ascertain, but there do appear to be, at a minimum, signs of froth in some local markets where home prices seem to have risen to unsustainable levels. Among other indicators, the significant rise in purchases of homes for investment since 2001 seems to have charged some regional markets with speculative fervor.
The apparent froth in housing markets appears to have interacted with evolving practices in mortgage markets. The increase in the prevalence of interest-only loans and the introduction of more-exotic forms of adjustable-rate mortgages are developments of particular concern. To be sure, these financing vehicles have their appropriate uses. But some households may be employing these instruments to purchase homes that would otherwise be unaffordable, and consequently their use could be adding to pressures in the housing market. Moreover, these contracts may leave some mortgagors vulnerable to adverse events. It is important that lenders fully appreciate the risk that some households may have trouble meeting monthly payments as interest rates and the macroeconomic climate change.
The U.S. economy has weathered such episodes before without experiencing significant declines in the national average level of home prices. Nevertheless, we certainly cannot rule out declines in home prices, especially in some local markets. If declines were to occur, they likely would be accompanied by some economic stress, though the macroeconomic implications need not be substantial. Nationwide banking and widespread securitization of mortgages make financial intermediation less likely to be impaired than it was in some previous episodes of regional house-price correction. Moreover, a decline in the national housing price level would need to be substantial to trigger a significant rise in foreclosures, because the vast majority of homeowners have built up substantial equity in their homes despite large mortgage-market-financed withdrawals of home equity in recent years.
Historically, it has been rising real long-term interest rates that have restrained the pace of residential building and have suppressed existing home sales, high levels of which have been the major contributor to the home equity extraction that arguably has financed a noticeable share of personal consumption expenditures and home modernization outlays.
Tuesday, July 19, 2005
Port of Los Angeles: Imports Up, Exports Down for June
by Calculated Risk on 7/19/2005 08:35:00 PM
The Port of Los Angeles released their June statistics today. Inbound (loaded containers) was 335 thousand compared to 313 thousand in May - an increase of 7%.
Outbound volume was 97 thousand loaded containers vs. 105 thousand for May. This is an 8% decline from May.
Port of Long Beach statistics correlate better with imports from China, but I can't overlook the strong import performance / weak export performance for the Port of Los Angeles.
This may indicate a stronger than expected June trade deficit and possibly a larger deficit with Japan.
Financial Times: Housing Bubble to Spread
by Calculated Risk on 7/19/2005 07:10:00 PM
An American Express economist is predicting that the US housing bubble [is] expected to spread according to the Financial Times.
"...the current bubble, which was already larger than the last one, is likely to grow - and spread even further - said John Calverley, chief economist at American Express, the financial services group.See Dr. Setser's comments on the Netherlands.
The boom in US house prices has started later than in other countries such as the UK, Australia, the Netherlands and Spain. However, figures suggest that it is catching up fast."
"...Mr Calverley warned that the boom had definitely become a bubble. The giveaway signs included excitement in the media and new lending policies from banks.
People were borrowing as much as they could because they expected prices would only go up. Meanwhile, new entrepreneurs were springing up offering property advice or “condo flipping”, when flats are bought off-plan and sold as quickly as possible.
A swift end to the phenomenon was unlikely unless interest rates rose significantly. Instead, the US could expect an expansion of the bubble and an even harder landing, predicted Mr Calverley ..."
Monday, July 18, 2005
DataQuick: SoCal RE Still Hot
by Calculated Risk on 7/18/2005 07:51:00 PM
UPDATE: Bay Area: Near Record Sales, New Price Peak
DataQuick reports: Southland Real Estate Market Hits New Highs
Both sales counts and prices reached new highs in Southern California last month. While appreciation continued to ease back, a new price peak was reached in each of the Southland counties.
| All Homes Sold | June-04 | June-05 | Pct.Chg |
| Los Angeles | 11,673 | 12,001 | 2.8% |
| Orange County | 4,749 | 4,898 | 3.1% |
| San Diego | 6,208 | 5,663 | -8.8% |
| Riverside | 6,343 | 6,485 | 2.2% |
| San Bernardino | 4,292 | 4,700 | 9.5% |
| Ventura | 1,466 | 1,707 | 16.4% |
| TOTAL SoCal | 34,731 | 35,454 | 2.1% |
| Median Home Price | June-04 | June-05 | Pct.Chg |
| Los Angeles | $414K | $475K | 14.7% |
| Orange County | $540K | $603K | 11.7% |
| San Diego | $464K | $493K | 6.3% |
| Riverside | $319K | $393K | 23.2% |
| San Bernardino | $246K | $322K | 30.9% |
| Ventura | $500K | $584K | 16.8% |
| TOTAL SoCal | $406K | $465K | 14.5% |
Friday, July 15, 2005
June Trade Deficit Forecast: OIL
by Calculated Risk on 7/15/2005 07:19:00 PM
The May numbers are barely dry, and here we go for June, starting with oil. Using the same model (described here) the ERPP (Energy Related Petroleum Products) trade numbers for June are forecast to be:
Forecast: Total NSA ERRP Imports: $19.6 Billion
Total SA ERPP FORECAST:
Imports SA: $19.4 Billion (seasonal factor estimated at 0.9925 for June)
Exports SA: $2.3 Billion
Balance ERPP: $17.1 Billion
DETAIL ALERT: The following are the internal numbers (mostly for my notes) that will cause your eyes to glaze over!
IMPORTS: Energy Related Petroleum Products.
Barrels Crude: 328.0 million barrels.
Barrels Other ERPP: 90.0 million barrels.
DOE Price per barrel (Crude): $45.11
DOE Price per barrel (Other): $51.88
Preliminary - Total NSA ERRP Imports: $19.5 Billion
NOTE: The BLS reports petroleum import prices rose 7.6% in June from May. The above model used DOE prices. After reviewing the prior prices and comparing the DOE and BLS approaches, the DOE has been slightly more accurate. Last month I split the difference between the estimates (the DOE was slightly closer).
This month I think the BLS numbers are too high (the real time data is revised significantly every month). The BLS approach would predict P(crude) = $46.35 compared to the DOE P(crude) = $45.11. I'm not going to split the difference, since I think the BLS is too high. Instead I will modify the DOE price forecast slightly upwards to reflect the BLS data as follows:
BLS/DOE Price per barrel (Crude): $45.40
BLS/DOE Price per barrel (Other): $52.21
Forecast: Total NSA ERRP Imports: $19.6 Billion
Total SA ERPP FORECAST:
Imports SA: $19.4 Billion (seasonal factor estimated at 0.9925 for June)
Exports SA: $2.3 Billion
Balance ERPP: $17.1 Billion
NOTE: This compares to the actual ERPP balance of -$15.8 Billion in May, so Oil is estimated to add $1.3 Billion to the deficit in June. Gen'l Glut has pointed out that the big jump in oil imports will come in July.
Bernanke, Job Growth and Home Prices
by Calculated Risk on 7/15/2005 05:20:00 PM
Earlier I quoted Ben Bernanke, the new chairman of the White House's Council of Economic Advisers suggesting that the boom in house prices was related to job growth:
"... states exhibiting higher rates of job growth also tend to have experienced greater appreciation in house prices."Now MSNBC's Martin Wolk provides data to show that Bernanke misspoke: Job growth fails to explain soaring home prices (Hat Tip to pgl at Angry Bear)
See the chart "Jobs & Home Prices". The conclusion ... Bernanke is wrong: "Job growth fails to explain soaring home prices".
Housing: New Loan Guidance Ignored
by Calculated Risk on 7/15/2005 11:19:00 AM
The NY Times is reporting: A Hands-Off Policy on Mortgage Loans
For two months now, federal banking regulators have signaled their discomfort about the explosive rise in risky mortgage loans.The regulators think Banks are not in danger because they have shifted the risk to investors and borrowers:
First they issued new "guidance" to banks about home-equity loans, warning against letting homeowners borrow too much against their houses. Then they expressed worry about the surge in no-money-down mortgages, interest-only loans and "liar's loans" that require no proof of a borrower's income.
The impact so far? Almost nil.
"It's as easy to get these loans now as it was two months ago," said Michael Menatian, president of Sanborn Mortgage, a mortgage broker in West Hartford, Conn. "If anything, people are offering them even more than before."
The reason is that federal banking regulators, from the Federal Reserve to the Office of the Comptroller of the Currency, have been reluctant to back up their words with specific actions. For even as they urge caution, officials here are loath to stand in the way of new methods of extending credit.
The main issue for regulators is whether banks and other lenders are properly managing their own risk, and the lenders are looking good.A couple of comforting thoughts:
They have hedged their risks by bundling mortgages into securities that are then sold to investors around the world. And if interest rates go higher, they have shifted much of the risk onto consumers because a growing share of home buyers have taken on adjustable-rate mortgages. At the same time, they have built sturdier financial institutions through mergers and the breakdown of barriers to interstate banking.
Bert Ely, an independent banking analyst who was among the first to recognize the crisis at savings and loan institutions in the 1980's, said the banks are far sounder today. "It's a night-and-day difference," Mr. Ely said. "No comparison."
But consumers - and perhaps the broader economy - are taking on more risk.
"There is a lot of pressure on banks to build market share, and consumers are looking for a quick response," said Barbara J. Grunkemeyer, deputy comptroller for credit risk at the Office of the Comptroller of the Currency. "With respect to these new mortgage products, they are new and have taken off rapidly. We are still in the process of understanding the risk-management systems that surround them."
"If you are the comptroller of the currency or the Federal Reserve, you're looking out for the system of the world," Mr. Frank added. "You're making macroeconomic policy. It's much more fun than looking out for consumers."
Thursday, July 14, 2005
Housing Humor
by Calculated Risk on 7/14/2005 08:50:00 PM
"The joke now in Lee County [Florida] is when the cops pull you over they ask for your real estate license because not everyone has a driver's license."From this otherwise serious article: Housing boom fraught with disasters waiting to happen.
And a Las Vegas story: Valley Home Buying Fallout.
Dyan Harmell, a Pulte home buyer, is drowning in a sea of debt. Her living room table is covered with bills and she's not quite sure how to pay them.Hat tip to Ben Jones for Vegas story. As the Vegas article says: "The real estate boom that sent Las Vegas home prices skyrocketing may be over, but the hangover is only getting worse."
"There are bills everywhere. House payments and debt," Harmell told FOX5. She's a long way from those heady days of Las Vegas' real estate boom, when she says Pulte's sales staff pushed and pushed her to buy.
"They call you and say 'you are so lucky .. this just came across.. it's going to be worth 100k before it closes,'"said Dyan Harmell. "We came with the hopes of buying two houses. We left the first day owning four. Within the next week, owning 6 -- all the way up to 19."
But Harmell's story is not unique. Walk around Pulte's Solera neighborhood and it's a ghost town. It seems as if "For Sale" signs are everywhere.
Signs that many people who thought they'd make a killing in Las Vegas' real estate market are now trying to unload homes at deep discounts.
Deficit Improvement?
by Calculated Risk on 7/14/2005 04:37:00 PM
The following graph shows the fiscal year to date increase in the National Debt for each of the last six fiscal years. The "fiscal year" is the accounting period of the federal government. It begins on October 1st and ends on September 30th of the next calendar year. Each fiscal year is identified by the calendar year in which it ends - so fiscal year 2005 ends on September 30, 2005.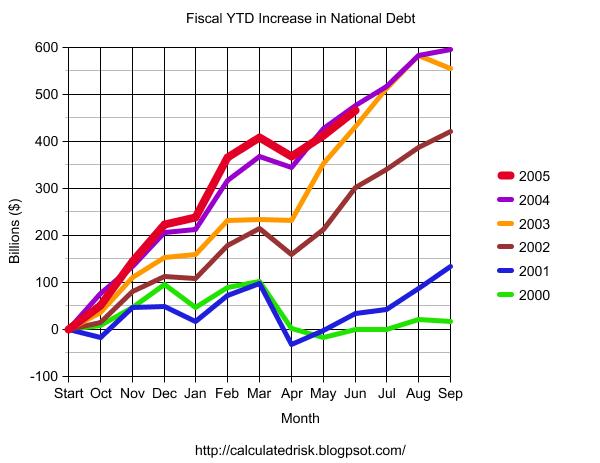
Click on graph for larger image.
The Year to Date increase in the National Debt is plotted for fiscal years 2000 through 2005. For 2005 (in RED) the data is plotted through June, 2005. The graph shows that contrary to the claims of the Bush Administration there has only been minor improvement in the overall deficit picture for 2005.
NOTE: There are many methods of looking at the annual budget deficit. The Bush Administration uses the "Enron Method" commonly called the "unified budget deficit". For a comparison of the unified budget deficit, the general fund deficit and the increase in the National Debt method see "Another Budget, Another Disaster".
Housing: The Bagholders
by Calculated Risk on 7/14/2005 11:47:00 AM
A couple weeks ago on Angry Bear, I quoted Econobrowser's Dr. Hamilton who asked: If there is a housing bubble,
"[W]hy are banks making loans to people who aren't going to be able to pay them back?"To try to answer Dr. Hamilton's question, I suggested we try to identify who would be left holding the bag and work backwards to motive.
Caroline Baum touches on the same topic in Enough About Loans. What About Lenders?
Forget the borrowers for a minute. Who's making these arguably risky loans? Why are lenders extending credit to seemingly bad credit risks?But this still doesn't identify the bagholders. Fannie Mae? Hedge Funds? Are investors underestimating the risk? Just more questions ...
One answer is that they aren't taking the risk. Rather, the risk is spread out, diluted. Lenders sell the loans, or the loans are securitized, in which case investors assume the risk.
As Federal Reserve Chairman Alan Greenspan reiterates, highly efficient capital markets in the U.S. diversify the risk, transferring it from those who don't want it to those who do.
Still, ``someone is taking on a lot of risk for someone to be able to take on less risk,'' [Michael Carliner, an economist at the National Association of Homebuilders in Washington] says.
Spreading the Risk
Then there's the question of whether risk is being priced correctly.
``There's been a dramatic explosion in lending to people with poorer credit-management history, and not a lot of history how certain loan products will perform,'' says Doug Duncan, chief economist at the Mortgage Bankers Association in Washington. ``We have no experience in 10-year interest-only mortgages.''
The risks apply to all parties in the transaction, Duncan says.
``For the borrower, did he understand how the loan would change?'' he says. For the servicer of the mortgage, ``did he understand how the loan would perform? Would it pre-pay faster, go delinquent? For the investor, did it achieve the yield expectations?''
OK, so the risk is spread out among various parties. Still, banks and thrifts do hold loans, especially ARMs, Duncan says. Won't they get stuck if the value of the house goes down, the borrower defaults and the lender can't recoup what was owed -- multiplied many times over?
Trade Deficit Projection: May Review
by Calculated Risk on 7/14/2005 01:24:00 AM
Two months ago I started to build a simple model to project the trade deficit. I didn't make as much progress as I had hoped, but the first two components (oil and China) have performed reasonably well for two months..
First, I projected the oil trade balance. And then I projected the trade deficit with China.
My model projected a deficit of $15.5 Billion Seasonally Adjusted in energy related petroleum product imports. The actual number was $15.8 Billion (see Exhibit 9). This is an error of just under 2%.
For the trade balance with China, my model projected a deficit of $15.5B NSA (SA is not available). The actual number (see Exhibit 14) was $15.7B or an error of 1.2%.
Here are each of the components and how the model performed:
| ITEM | Projection | Actual | Error |
| US Exports to China (NSA) | $3.4B | $3.3B | 3% |
| US Imports from China (NSA) | $18.9B | $19.05B | <1% |
| US Trade Deficit: China (NSA) | $15.5B | $15.75B | 1.6% |
| Oil: Imports SA | $17.4B | $18.1B | 3.9% |
| Oil: Exports SA | $1.9B | $2.3B | 17% |
| OIL Balance SA | $15.5B | $15.8B | 2% |
Some internal data:
| ITEM | Projection | Actual | Error |
| Oil: Contract Price BBL | $42.88 | $43.08 | <1% |
| Oil: BBLs Crude | 337.9M | 318.6M | 6% |
| Oil: Price Other BBL | $49.31 | $48.99 | <1% |
| Oil: BBLs Other | 85M | 99.7M | 15% |
| Oil: Oil Imports NSA | $18.7B | $18.6B | <1% |
It appears my SA factor for oil imports was somewhat off the mark. I'll have to take another look at that step. There is much more to do!
Wednesday, July 13, 2005
US Trade Deficit: $55.3 Billion for May
by Calculated Risk on 7/13/2005 08:33:00 AM
The U.S. Census Bureau and the U.S. Bureau of Economic Analysis released the monthly trade balance report today for May:
"... total May exports of $106.9 billion and imports of $162.2 billion resulted in a goods and services deficit of $55.3 billion, $1.6 billion less than the $56.9 billion in April, revised.Note: all numbers are seasonally adjusted.
May exports were $0.2 billion more than April exports of $106.7 billion.
May imports were $1.4 billion less than April imports of $163.6 billion."

Click on graph for larger image.
UPDATE: fixed a couple of errors.
May
The average contract price for oil dropped from a record $44.76 per barrel in April to $43.08 in May. The temporary drop in oil prices lowered the impact of oil on the trade deficit for May. However, the June trade deficit will be impacted by record high oil prices again.
I think the deficit will start to expand again starting in June.
Tuesday, July 12, 2005
May Trade Deficit Prediction
by Calculated Risk on 7/12/2005 06:39:00 PM
Once again, I've only modeled Oil and China, although I've added exports for Oil. Hopefully I will add more in the future. Here is a review of last month's predictions.
PROJECTIONS:
I: For petroleum, I project that NSA petroleum trade imports will be $18.7 Billion, down from $18.9 Billion in April. Including petroleum exports and adjusting for seasonal effects, the SA oil balance for May is projected at $15.5 Billion. This compares to $17.2 Billion for April.
II: For China, I project (see bottom) a NSA deficit of $15.5 Billion for May compared to $14.7 Billion in April. SA this is $16.1 Billion vs. $15.5 Billion for April.
III. OVERALL: I haven't developed a method for predicting the deficit for other countries, but based on Oil and China I think the deficit in May might improve slightly from April's deficit of $57 Billion. Oil will be about $1.7 Billion less in May (than April) and China approximately $0.6 Billion more.
My Guess (not enough work to call it a projection / estimate): $56.5 Billion Deficit.
NOTE: I expect June to be significantly worse than May.
CHINA: The following is the estimate for trade with China based on this methodology.
CHINA TRADE BALANCE: Table numbers in Billions $
NOT SEASONALLY ADJUSTED
| MONTH | NSA Balance | NSA Exports | NSA Imports |
| February | -$13.9 | $3.08 | $16.95 |
| March | -$12.9 | $3.3 | $16.21 |
| April | -$14.7 | $3.4 | $18.12 |
| May | -$15.5(est) | $3.4(est) | $18.9(est) |
SEASONALLY ADJUSTED (all estimates)
| MONTH | SA Balance | SA Exports | SA Imports |
| February | -$18.1 | $3.08 | $21.19 |
| March | -$15.1 | $3.3 | $18.42 |
| April | -$15.5 | $3.4 | $18.88 |
| May | -$16.1(est) | $3.4(est) | $19.5(est) |
Bernanke on Housing: Market Forces, not Speculation
by Calculated Risk on 7/12/2005 11:27:00 AM
Ben Bernanke gave his first speech this morning as the new chairman of the White House's Council of Economic Advisers. At the American Enterprise Institute, Bernanke commented on housing:
"While speculative behavior appears to be surfacing in some local markets, strong economic fundamentals are contributing importantly to the housing boom,"I disagree. Speculation, including excessive leverage, appears rampant in many markets.
Those fundamentals, Bernanke said, include low mortgage rates, rising employment and incomes, a growing population and a limited supply of homes or land in some areas.I disagree. Low mortgage rates are not a housing "fundamental", employment in California (one of the hottest real estate markets) is struggling, and population growth / limited supply of land was true 10 years ago too when housing was in a bust.
"For example, states exhibiting higher rates of job growth also tend to have experienced greater appreciation in house prices,"
"The administration will continue to monitor" developments in the housing market, Bernanke said. "However, our best defenses against potential problems in housing markets are vigilant lenders and banking regulators, together with perspective and good sense on the part of borrowers."And on the budget deficit:
"One consequence of the strong income growth we are enjoying is higher-than-expected levels of tax collections so far this year which, if maintained with spending controls, will reduce the government's budget deficit for this year well below its projected level,"This is laughable. There is a small improvement in the deficit this year, due to one time events, but next year will be worse.
As the Chairman of the CEA, it is understandable that Bernanke supports the Bush Administration's positions.
Monday, July 11, 2005
Free Money: Part III
by Calculated Risk on 7/11/2005 07:47:00 PM
About four months ago, I wrote that they were giving away free money in The OC (Orange County, CA). At that time the median home price in OC was $555,000.
According to the OC Register, the median home price in May was $585,000. That is a gain of $30,000 in just two months. See Free Money II.
Today the OC Register reports that the OC median home price is now $601,000.
That is a total of $46,000 in FREE MONEY since local RE Broker Gary Watts' prediction of $70,000 in gains this year. I'm starting to feel a little heat for making fun of Mr. Watts' comments.
Housing: The Tax Myth
by Calculated Risk on 7/11/2005 01:31:00 AM
Also: Please see my most recent post on Angry Bear: Help Wanted: Real Estate Agents
Housing: The Tax Myth
Various people have suggested that the current Real Estate boom is a direct result of the Tax Relief Act of 1997. The Tax Relief Act was sponsored by Rep John Kasich (R-OH) that replaced a similar senate Bill sponsored by Senator Roth (R-DE). Although the Bill was Republican sponsored, it passed the Senate 92 - 8 and the House 389 - 43 and was signed into law by President Clinton. Obviously the Act had widespread bipartisan support.
The '97 Act made a major change in how gains on primary residences are taxed. Under the old law, gains could be rolled over into a new home, as long as the home was of equal or greater value than the old home. Once a homeowner (or their spouse) reached the age of 55, they could take a one time exclusion up to $125,000 of the profit from the sale of their residence to "step down" and buy a smaller home. NOTE: I'm outlining the standard rules and skipping all complications.
Under the new law, homeowners receive a $250K (single) or $500K (married) tax exclusion when they sell their home. They can use this exclusion every two years. The old "rollover" and 55+ year old rules no longer apply. Some people have argued that this exclusion is responsible for the real estate boom.
What would motivate someone to take advantage of the exclusion? Here is the simple case: A married couple buys a home for $400K and some time later the house could be sold for $800K. Should they sell to take advantage of the $500K exclusion?
Assumptions: Property taxes are 1% (added: California Law). Transaction costs are 6%.
Here is the argument some people are making: To take advantage of the exclusion, this couple would sell their home for $800K and buy a similar home for $800K. They would have to take out a loan for $48K more on the new home to cover the transaction costs and their property taxes would increase from $4K per year to $8K per year. For doing this transaction, their basis on the new house would be $800K (as opposed to $400K under the old law). This new basis would save the couple from paying capital gains in the future on $352K ($400K minus $48K) or taxes of $70K (if taxed at 20% capital gains).
What is the better deal: 1) To have a $48K immediate increase in debt plus payments of $4K more per year or 2) to have a future tax liability of $70K? For most situations the answer is #2, so the Tax Relief Act of '97 isn't motivating people to buy and sell similar properties.
Is there an example of where the '97 Act would motivate people to buy and sell? If homeowners are moving down in price (moving to a smaller property or moving to a less expensive state or even renting) then the Act might be contributing to the boom. Is there evidence of homeowners en masse moving to renting? No, the opposite has happened. Is there evidence of homeowners moving to smaller homes or less expensive areas? Not a significant number. Besides this would drive up the prices in less expensive areas and lower the price in expensive areas - is that what is happening? No.
The bottom line is the Tax Relief Act of '97 is not contributing to the bubble as some people suspect.
However, there is one impact that might be happening in more expensive areas. Long time homeowners over 55, with significantly more than $500K in equity, might not move to less expensive housing to avoid paying taxes. This might reduce inventories of expensive homes, but I doubt this is a widespread problem.
Friday, July 08, 2005
Housing: Calpers is Selling
by Calculated Risk on 7/08/2005 02:43:00 AM
Forbes reports that "Public pensions are rushing into real estate the way they rushed into tech in the late 1990s."
When the tech boom went bust A few years ago, New Jersey's public pension fund was among the hardest hit in the country, suffering a loss in its tech-laden portfolio of nearly one-third of its value, or $30 billion. Now the State Investment Council has another great idea: In January it decided to jump into--this can't be a surprise--real estate.The Real Estate rush is on:
All told, the top 50 public funds increased their commitments to real estate last year by $9.8 billion, equal to 11% of their property holdings, according to the newsletter Real Estate Alert. Now they have set a target of loading another $34 billion into land and buildings as quickly as is practical, representing a 37% hike to $128 billion, or 7.2% of their assets.And some old timers are worried:
"We're drowning in liquidity," says Dale Anne Reiss, who heads Ernst & Young's real estate practice. "Banks are lending aggressively, and every flavor of institution thinks real estate is the best alternative out there. Some of us remember an equal degree of enthusiasm in the late 1980s just before the market collapsed."Meanwhile, Calpers is selling:
... California's pension fund Calpers, the nation's largest public fund and often in the investing vanguard [is selling]. As less savvy funds rush in, Calpers has lately sold about $7 billion in expensive real estate and taken profits.Of course, in California the affordability index is near the all time low.
"We think the timing is right" to sell, says Brad W. Pacheco, a Calpers spokesman. "We have a property on the block right now and plan to continue selling."
The percentage of households in California able to afford a median-priced home stood at 16 percent in May, a 3 percentage-point decrease compared with the same period a year ago when the Index was at 19 percent, according to a report released today by the California Association of REALTORS® (C.A.R.). The May Housing Affordability Index (HAI) declined 1 percentage point from April, when it stood at 17 percent.
"The record low was 14 percent set back in May and June of 1989," said Robert Kleinhenz, an economist with the group.
Thursday, July 07, 2005
The Real FED Funds Rate
by Calculated Risk on 7/07/2005 06:04:00 PM
Dr. Hamilton of Econbrowser asks: "How high will the Fed push interest rates?"
First, how high is the Fed Funds Rate now? In nominal terms, the FED Funds Rate is 3.25%. But in real terms it is barely positive.
Click on graph for larger image.
For this graph, I subtracted the averaged trailing 12 months median CPI (SOURCE: Cleveland Fed) from the average of the monthly Fed Funds rate (SOURCE: Federal Reserve).
After the '73-75 recession, the FED Funds Rate chased the inflation rate. This led to ever higher inflation until the Volcker FED put the brakes on in the early '80s. The Real FED Funds Rate has declined since the early '80s, with a low in the early '90s as the FED provided stimulus in reaction to the '90/'91 recession.
A neutral Real FED Funds Rate is probably 2% or higher. If the economy is as healthy as the FED claims "... the expansion remains firm and labor market conditions continue to improve gradually.", then the FED will raise the FED Funds Rate to over 4% unless inflation diminishes.
Like many others, I believe the economy has serious and intractable imbalances: the current account deficit, the structural budget deficits and the housing bubble. These are the result of global shifts and poor public and fiscal policies.
Wednesday, July 06, 2005
Bank of England to Lower Rates?
by Calculated Risk on 7/06/2005 07:39:00 PM
UPDATE: We are all British today ...
The Bank of England's Monetary Policy Committee will conclude a two day meeting tomorrow and will announce monetary policy at 12 noon immediately following the Thursday meeting. The London Times has called for a rate cut.
THE Bank of England should move to bolster the economy today with a cut in interest rates, four out of nine members of The Times Monetary Policy Committee (MPC) said yesterday amid anxiety over faltering growth.The calls for a rate cut come as more evidence of economic weakness has emerged:
As worries were fuelled by figures showing manufacturing stagnating and homeowners further scaling back borrowing against their properties, pressure on the Bank to act was emphasised by the close vote among the independent experts.
Fears that the consumer downturn will be prolonged were heightened by the Bank’s latest figures for mortgage equity withdrawal, when homeowners borrow against increased property values for reasons other than moving home. The amount of cash raised in this way fell to £6.4 billion in the first quarter from a revised £8.3 billion in the previous three months and a peak of £17.7 billion in late 2003.The Confederation of British Industry has also called for a rate cut:
In The Times MPC vote, Martin Weale, NIESR’s director, and Sir Steve Robson, former Treasury Second Permanent Secretary, added their voices to call for an immediate rate cut. They were joined by The Times’s Anatole Kaletsky and Sushil Wadhwani, a former member of the Bank’s MPC, who also voted for a cut in June.
Sir Steve said that last week’s overhauled GDP data “suggested that the economy has been losing momentum for a good deal longer than previously thought”. “There are no new factors in prospect which would give it new momentum,” he said. Inflation remained subdued, he added. Mr Weale echoed this, arguing that growth was likely to have been below its long-term trend for a year.
``As there still seems little risk of inflation, the time for action is now,'' said CBI Director-General Digby Jones in the text of speech to be given in northern England this evening. There are ``troubling signs of decline in the housing market where confidence is everything. Such a loss of confidence is something the U.K. economy cannot afford.''
U.K. growth lagged behind the euro region for the first time in more than four years during the first quarter as the increase in consumer spending slowed and manufacturing contracted, government statistics showed last week. Inflation in May stayed at a seven-year high of 1.9 percent for the third month running.
 Click on graph for larger image.
It is possible that the UK housing slowdown is a leading indicator for the US housing market. The BoE didn't lower rates as far as the FED and they started raising rates sooner. Now, with the UK housing market faltering and high street sales slumping, it looks like the peak of the BoE interest rate cycle will be the lowest in fifty years.
What does this mean for the FED? Probably nothing. As Dr. Altig points out, the futures market is indicating at least two more 25 bps point rate increases from the FED at the next two meetings.
UPDATE: Financial Times: Grim outlook for UK manufacturing sector
David Page at Investec said: “Although manufacturing appeared firmer than markets were expecting in May, wholesale revisions in line with last week’s National Accounts revealed a weaker recent past for manufacturing and firmly pointed to a manufacturing recession.”Scotsman: Manufacturing recession rears its ugly head
"UK manufacturers are finding it difficult to pass on cost increases, particularly given the scale of the increase in oil,'' said George Buckley, an economist at Deutsche Bank. "In addition, weakening consumption makes it difficult to sell their products."
Tuesday, July 05, 2005
$1 Million Trailer: Land not included
by Calculated Risk on 7/05/2005 11:22:00 PM
The USA Today reports Mobile home madness: Prices top $1 million
A two-bedroom, two-bathroom mobile home perched on a lot in Malibu is selling for $1.4 million. This isn't a greedy seller asking a ridiculous amount no one will pay. (Photo gallery: Mobile home boasts of spectacular views)Uh, OK.
Two others sold in the area recently for $1.3 million and $1.1 million. Another, at $1.8 million, is in escrow. Nearby, another lists for $2.7 million.
"Those are the hottest (prices) I've ever heard," says Bruce Savage, spokesman for the Manufactured Housing Institute. He says prices in another hot spot, Key West, Fla., top $500,000. As if the price isn't tough enough to swallow, trailer buyers:
•Don't own the land. As with most mobile homes sold in Malibu, the land is owned by the proprietor of the trailer park, in this case, Point Dume Club.
•Still pay rent. Not owning the land means paying what's called "space rent" that is as high as or higher than many mortgages in other parts of the USA. On the $1.4 million trailer, space rent is $2,700 a month.
•Can't get mortgages. Since the buyers don't own the land, most of the mobile homes are paid for in cash or with a personal property loan that usually amounts to $100,000 or less, says Clay Dickens, mortgage loan agent at Community West Bank.
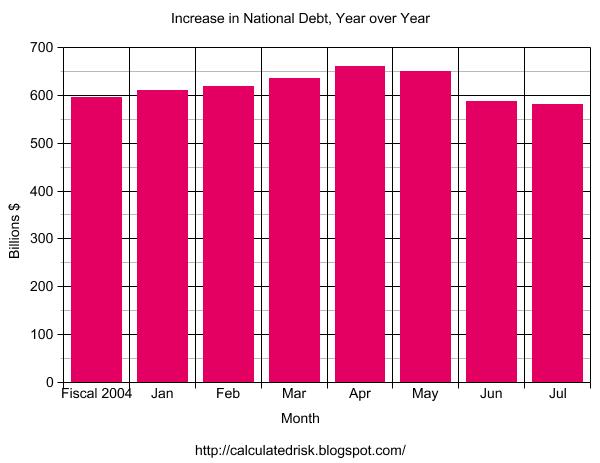
Budget Deficit: $581 Billion Year over Year
by Calculated Risk on 7/05/2005 03:58:00 PM
As of July 1, 2005 our National Debt is:
$7,827,306,264,287.53 (Over $7.8 Trillion)
As of July 1, 2004, our National Debt was:
$7,246,142,474,951.77
SOURCE: US Treasury.
Click on graph for larger image.
For comparison:
For Fiscal 2004 (End Sept 30, 2004): $596 Billion
For Jan 1, 2004 to Jan 1, 2005: $609.8 Billion
For Feb 1, 2004 to Feb 1, 2005: $618.6 Billion
For Mar 1, 2004 to Mar 1, 2005: $635.9 Billion
For Apr 1, 2004 to Apr 1, 2005: $660.9 Billion
For May 1, 2004 to May 1, 2005: $648.8 Billion
For Jun 1, 2004 to Jun 1, 2005: $588.0 Billion
For Jul 1, 2004 to Jul 1, 2005: $581.2 Billion
I still expect fiscal 2005 to set a new nominal budget deficit record although it might be close. The current record annual increase in the National Debt is $596 Billion for fiscal '04.
A Unique Conundrum?
by Calculated Risk on 7/05/2005 12:03:00 AM
The Federal Reserve has been steadily raising rates from a low of 1% to over 3%. And the yield on the Ten Year Treasury stubbornly refuses to budge.
Click on graph for larger image.
That is what happened in the early '60s. The Fed Funds rate moved from 1.1% in July 1961 to 3.5% in late 1963 and the Ten Year yield stayed steady at 4%.
All data from the Federal Reserve.
The yield curve narrowed and then what happened to the economy? It continued to grow and the stock market rallied.
There are many differences from forty years ago and today. But, with the constant drum beat in the financial press about the yield curve, I decided to check if the current situation was unique. It isn't. Nothing profound, I was just curious.
Also, my most recent post is up on Angry Bear: Housing Update.
Saturday, July 02, 2005
Housing: Boston is Looking Peaked
by Calculated Risk on 7/02/2005 12:00:00 AM
Many housing commentators have been looking to the UK and Australia housing markets as leading indicators for the US housing market. Now the housing bust may have reached the US shores: Boston is looking peaked.
In Massachusetts, the number of home sales dropped last month: Mass. home sales plunge 11.1 percent
There were about 36,259 homes on the market last month, or a supply of 8.8 months, a figure generally thought to be favorable to buyers, experts said.That is worth repeating; the supply of existing homes is now 8.8 months in Massachusetts. And that is exactly how many commentators felt the bubble would end:
Economists say this combination - higher prices amid lower sales volume - is precisely what you'd see in a bubble that's dying.And what happens when buyers use excessive leverage and can't sell? Massachusetts Foreclosure Filings Jump As Values Soar
Because of high housing prices, many first-time homebuyers have been using new, risky mortgage products that hold down costs in the early years of a loan, but they can face difficulties if payments rise later. In addition, people who already own homes have been tapping into rising property values to borrow money at historically low interest rates for college tuition, home improvements, credit-card debt, or other financial needs.And finally a quote from Bill Gross from Saturday's New York Times:
"When you tie all these factors together - the bubble in the real estate market, the popularity of interest-only loans, the willingness of lenders to give loans without a significant down payment, the lowering of standards for lenders, and the deep desire of people to own something priced beyond their means - you have a recipe for disaster," said Secretary of State William F. Galvin, whose office oversees the registries of deeds in a majority of the state's 14 counties. "That's what you're seeing in the Land Court."
"... if housing prices stop going up, which would be my forecast, that makes a substantial difference. Individuals have banked on that appreciation every year. You should come to a point where owners of houses realize we're in never-never land and stop buying on a speculative basis. Markets many times fall of their own weight. That's what happened with the Nasdaq in 2000."And maybe that's what is happening in Boston. Should we sound the alarm? The British Bust is coming!
Friday, July 01, 2005
Wells Fargo: Decade of Flat Home Prices
by Calculated Risk on 7/01/2005 01:19:00 AM
The Orange County Register reports on a presentation by Wells Fargo's chief economist Scott Anderson at the Westin South Coast Plaza on Wednesday. The Register quotes Anderson:
"We're talking about a decade at least – if not more – of (housing price) stagnation,"
"There will be a slow fizzle (in prices), not a pop,"Still Anderson is fairly positive:
There's a little oomph left in the market, he said. Anderson predicts that 30-year, fixed mortgage rates will remain around 5.8 percent over the next six months, which could help boost home prices about 5 percent this year. Next year, homeowners might see a 1 percent to 2 percent increase in appreciation, then Anderson expects prices will level off indefinitely until incomes can catch up.Previous housing booms also fizzled. But ten years of nominal price stagnation would be a 30% decline in real terms.
Even though much of Orange County's economic recovery can be attributed to the housing boom, Anderson doesn't think stagnant housing prices spell recession, because strength will remain in other sectors like technology and tourism.
I'm less confident than Mr. Anderson about avoiding a recession.


