 RSS Feed
 by Calculated Risk on 5/09/2025 07:10:00 PM
Friday, May 09, 2025
May 9th COVID Update: COVID Deaths Continue to Decline
 Note: Mortgage rates are from MortgageNewsDaily.com and are for top tier scenarios.
For deaths, I'm currently using 4 weeks ago for "now", since the most recent three weeks will be revised significantly.
Note: "Effective May 1, 2024, hospitals are no longer required to report COVID-19 hospital admissions, hospital capacity, or hospital occupancy data." So, I'm no longer tracking hospitalizations.
| COVID Metrics | ||||
|---|---|---|---|---|
| Now | Week Ago | Goal | ||
| Deaths per Week | 337✅ | 393 | ≤3501 | |
| 1my goals to stop weekly posts. 🚩 Increasing number weekly for Deaths. ✅ Goal met. | ||||
 Click on graph for larger image.
This graph shows the weekly (columns) number of deaths reported since Jan 2023.
Although weekly deaths met the original goal to stop posting in June 2023 (low of 314 deaths), I've continued to post since deaths were above the goal again - and I'll continue to post until weekly deaths are once again below the goal for several weeks.
Weekly deaths are steadily decreasing following the winter pickup and are nearing the lows of last June.
 This appears to be a leading indicator for COVID hospitalizations and deaths. This is moving towards the lows last May.
Nationally COVID in wastewater is "Low".
Q2 GDP Tracking: Around 2%
by Calculated Risk on 5/09/2025 02:27:00 PM
Plenty of data next week! Note that the Blue Chip consensus is wide - and currently around 1%.
From the Atlanta Fed: 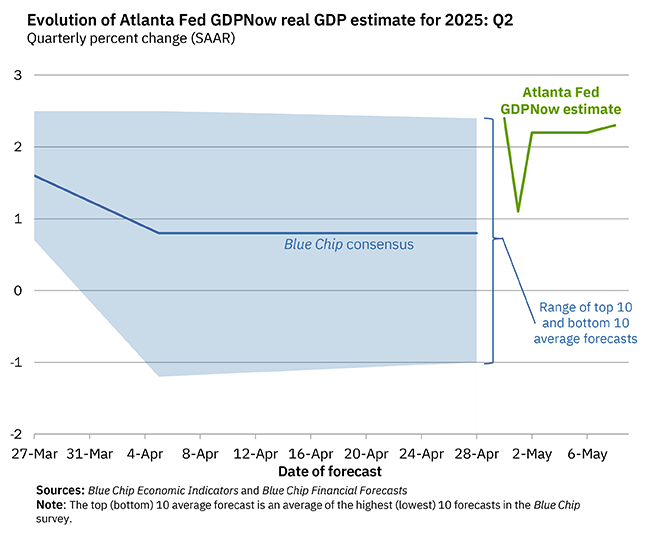
The GDPNow model estimate for real GDP growth (seasonally adjusted annual rate) in the second quarter of 2025 is 2.3 percent on May 8, up from 2.2 percent on May 6. After this morning’s wholesale trade report from the US Census Bureau, the nowcast of the contribution of inventory investment to annualized second-quarter real GDP growth increased from -0.46 percentage points to -0.43 percentage points. [May 8th estimate]
Part 1: Current State of the Housing Market; Overview for mid-May 2025
by Calculated Risk on 5/09/2025 11:00:00 AM
Today, in the Calculated Risk Real Estate Newsletter: Part 1: Current State of the Housing Market; Overview for mid-May 2025
A brief excerpt:
This 2-part overview for mid-May provides a snapshot of the current housing market.There is much more in the article.
Right now, the key story for existing homes is that inventory is increasing sharply, and sales are essentially flat compared to last year. That means prices will be under pressure (although there will not be a huge wave of distressed sales).
Yesterday, Realtor.com reported that there were “more than 1 million homes for sale last week, crossing this threshold for the first time since December 2019”.
...
Since inventory has increased sharply and sales are flat, a key for house prices is to watch months-of-supply. The following graph shows months-of-supply since 2017 using data from the NAR. Note that months-of-supply is higher than the previous 8 years!
Months-of-supply was at 4.0 months in March compared to 3.8 months in March 2019.
Inventory would probably have to increase to 5 1/2 to 6 months of supply to see national price declines.

AAR: Rail Carloads and Intermodal Up in April
by Calculated Risk on 5/09/2025 08:12:00 AM
From the Association of American Railroads (AAR) AAR Data Center. Graph and excerpts reprinted with permission.
Recent shifts in U.S. policies on trade and immigration have introduced volatility in financial markets and heightened uncertainty for firms. The ultimate outcomes and impacts of these policy changes remain unclear. Nevertheless, U.S. rail volumes have thus far remained stable, and many core economic indicators continue to signal underlying resilience. Railroads have long adapted to changing conditions, a legacy of resilience that continues today.
emphasis added
 Click on graph for larger image.
This table from the AAR shows the year-over-year change in carloads by category.
U.S. railroads originated 1.13 million total carloads in April 2025, up 6.2% (65,524 carloads) over April 2024. That’s the largest year-over-year percentage gain in 16 months and the third largest in nearly four years. Carloads averaged 225,569 per week in April—slightly below March, but otherwise the highest since October 2024, with gains in 13 of 20 categories tracked by AAR. Through the first four months of 2025, total carloads were up 1.8% (67,282 carloads) over the same period last year, with 11 of 20 carload categories seeing gains.
emphasis added
 And on intermodal:
 U.S. rail intermodal traffic, which is not included in carload counts, totaled 1.36 million containers and trailers in April 2025, up 7.4% (93,244 units) over April 2024. Weekly intermodal volume averaged 272,300 units in April 2025. The only April with higher intermodal volume was April 2021. In fact, April 2021 holds the all-time intermodal record for any month, averaging 290,955 units per week. Year-to-date intermodal volume in 2025 through April was 4.90 million units, up 8.1% (365,456 units) over 2024 and the second highest ever for the first four months of a year (again behind 2021). Intermodal volume closely tracks port activity, making it a bellwether for international trade trends.As yet, there is no apparent impact on carloads and intermodal from policy changes.
Thursday, May 08, 2025
"Mortgage Rates Move Higher After Trade Deal"
by Calculated Risk on 5/08/2025 07:25:00 PM
 From Matthew Graham at Mortgage News Daily: Mortgage Rates Move Higher After Trade Deal
Mortgage rates moved back up to the higher levels seen earlier this week after the official announcement of a trade deal between the U.S. and the U.K.
...
In the bigger picture, today's mortgage rate increase is unremarkable--sort of average--and it leaves the rate index well below the early April highs, despite being well above the range seen during the month of March.
Realtor.com Reports Most Actively "For Sale" Inventory since 2019
by Calculated Risk on 5/08/2025 01:39:00 PM
What this means: On a weekly basis, Realtor.com reports the year-over-year change in active inventory and new listings. On a monthly basis, they report total inventory. For May, Realtor.com reported inventory was up 30.6% YoY, but still down 16.3% compared to the 2017 to 2019 same month levels.
Now - on a weekly basis - inventory is up 31.1% YoY.
Realtor.com has monthly and weekly data on the existing home market. Here is their weekly report: Weekly Housing Trends View—Data for Week Ending May 3, 2025 Here is a graph of the year-over-year change in inventory according to realtor.com.
Inventory was up year-over-year for the 78th consecutive week.
Realtor.com has monthly and weekly data on the existing home market. Here is their weekly report: Weekly Housing Trends View—Data for Week Ending May 3, 2025
• Active inventory climbed 31.1% year-over-year
The number of homes actively for sale remains on a strong upward trajectory, now 31.1% higher than this time last year. This represents the 78th consecutive week of annual gains in inventory. There were more than 1 million homes for sale last week, crossing this threshold for the first time since December 2019.
• New listings—a measure of sellers putting homes up for sale—rebounded, rising 9.3% year-over-year
New listings picked up last week, rising 9.3% compared to a year ago. The momentum from earlier this spring is still going strong, pointing to a lively market heading into late spring and early summer. Last week boasted the highest number of new listings since mid-2022.
• The median list price was up 0.9% year-over-year
Home prices posted another slight gain this week, with the national median listing price rising 0.9% year-over-year.
 Here is a graph of the year-over-year change in inventory according to realtor.com.
 Inventory was up year-over-year for the 78th consecutive week.
New listings were the highest since 2022.
Median list prices are up slightly year-over-year.
Hotels: Occupancy Rate Increased 1.8% Year-over-year
by Calculated Risk on 5/08/2025 10:41:00 AM
From STR: U.S. hotel results for week ending 3 May
The U.S. hotel industry reported positive year-over-year comparisons, according to CoStar’s latest data through 3 May. ...The following graph shows the seasonal pattern for the hotel occupancy rate using the four-week average.
27 April through 3 May 2025 (percentage change from comparable week in 2024):
• Occupancy: 65.8% (+1.8%)
• Average daily rate (ADR): US$164.33 (+2.2%)
• Revenue per available room (RevPAR): US$108.06 (+4.1%)
Performance growth was lifted early in the week on the positive side of the Passover calendar shift.
emphasis added
 Click on graph for larger image.
The red line is for 2025, blue is the median, and dashed light blue is for 2024. Dashed purple is for 2018, the record year for hotel occupancy.
The 4-week average of the occupancy rate is tracking below both last year and is close to the median rate for the period 2000 through 2024 (Blue).
Note: Y-axis doesn't start at zero to better show the seasonal change.
The 4-week average will mostly move sideways until the summer travel season. We will likely see a hit to occupancy during the summer months due to less international tourism.
Weekly Initial Unemployment Claims Decrease to 228,000
by Calculated Risk on 5/08/2025 08:30:00 AM
The DOL reported:
In the week ending May 3, the advance figure for seasonally adjusted initial claims was 228,000, a decrease of 13,000 from the previous week's unrevised level of 241,000. The 4-week moving average was 227,000, an increase of 1,000 from the previous week's unrevised average of 226,000.The following graph shows the 4-week moving average of weekly claims since 1971.
emphasis added
 Click on graph for larger image.
The dashed line on the graph is the current 4-week average. The four-week average of weekly unemployment claims increased to 227,000.
The previous week was unrevised.
Weekly claims were above the consensus forecast.
Wednesday, May 07, 2025
Thursday: Unemployment Claims
by Calculated Risk on 5/07/2025 07:59:00 PM
 Note: Mortgage rates are from MortgageNewsDaily.com and are for top tier scenarios.
Thursday:
• At 8:30 AM ET, The initial weekly unemployment claims report will be released. The consensus is for initial claims of 223 thousand, down from 241 thousand last week.
Leading Index for Commercial Real Estate Increased 1% in April
by Calculated Risk on 5/07/2025 04:01:00 PM
From Dodge Data Analytics: Dodge Momentum Index Increases 1% in April
The Dodge Momentum Index (DMI), issued by Dodge Construction Network, grew 0.9% in April to 205.1 (2000=100) from the downwardly revised March reading of 203.1. Over the month, commercial planning grew 3.3% while institutional planning fell 4.2%.
“Despite an uptick in April, the bulk of the DMI’s growth was driven by a surge in data center planning, while momentum in other nonresidential sectors lagged behind,” stated Sarah Martin, associate director of forecasting at Dodge Construction Network. “Owners and developers are navigating heightened economic and policy uncertainty, which likely bogged down much of this month’s planning activity.”
A wave of data center projects entering planning played a key role in boosting commercial growth. Without data centers, commercial planning would have receded 2.3% in April and the entire DMI would have receded 3.0%. Office and hotel planning saw a sharp retreat this month, while warehouse and retail planning modestly ticked up. On the institutional side, planning momentum waned for education, healthcare, and government buildings. This was slightly offset by an uptick in recreational projects.
...
The DMI is a monthly measure of the value of nonresidential building projects going into planning, shown to lead construction spending for nonresidential buildings by a full year.
emphasis added
 Click on graph for larger image.
This graph shows the Dodge Momentum Index since 2002. The index was at 205.1 in April, up from 220.9 the previous month.
According to Dodge, this index leads "construction spending for nonresidential buildings by a full year". This index suggests a pickup in mid-2025, however, uncertainty might impact these projects.
Commercial construction is typically a lagging economic indicator.


