by Calculated Risk on 4/10/2024 07:15:00 PM
Wednesday, April 10, 2024
Thursday: Unemployment Claims, PPI

Thursday:
• At 8:30 AM ET, The initial weekly unemployment claims report will be released. The consensus is for 225 thousand initial claims, up from 221 thousand last week.
• Also at 8:30 AM, The Producer Price Index for March from the BLS. The consensus is for a 0.2% increase in PPI, and a 0.3% increase in core PPI.
Part 1: Current State of the Housing Market; Overview for mid-April 2024
by Calculated Risk on 4/10/2024 02:09:00 PM
Today, in the Calculated Risk Real Estate Newsletter: Part 1: Current State of the Housing Market; Overview for mid-April 2024
A brief excerpt:
This 2-part overview for mid-April provides a snapshot of the current housing market.There is much more in the article.
I always like to start with inventory, since inventory usually tells the tale!
...
Here is a graph of new listing from Realtor.com’s March 2024 Monthly Housing Market Trends Report showing new listings were 15.5% year-over-year in March. This is still well below pre-pandemic levels. From Realtor.com:
However, providing a boost to overall inventory, sellers turned out in higher numbers this March as newly listed homes were 15.5% above last year’s levels. This marked the fifth month of increasing listing activity after a 17-month streak of decline.Note the seasonality for new listings. December and January are seasonally the weakest months of the year for new listings, followed by February and November. New listings will be up year-over-year in 2024, but still below normal levels.
There are always people that need to sell due to the so-called 3 D’s: Death, Divorce, and Disease. Also, in certain times, some homeowners will need to sell due to unemployment or excessive debt (neither is much of an issue right now).
And there are homeowners who want to sell for a number of reasons: upsizing (more babies), downsizing, moving for a new job, or moving to a nicer home or location (move-up buyers). It is some of the “want to sell” group that has been locked in with the golden handcuffs over the last couple of years, since it is financially difficult to move when your current mortgage rate is around 3%, and your new mortgage rate will be in the 6 1/2% to 7 1/2% range.
But time is a factor for this “want to sell” group, and eventually some of them will take the plunge. That is probably why we are seeing more new listings now.
FOMC Minutes: Uncertainty about inflation; Need greater confidence
by Calculated Risk on 4/10/2024 02:00:00 PM
From the Fed: Minutes of the Federal Open Market Committee, March 19–20, 2024. Excerpt:
In their discussion of inflation, participants observed that significant progress had been made over the past year toward the Committee's 2 percent inflation objective even though the two most recent monthly readings on core and headline inflation had been firmer than expected. Some participants noted that the recent increases in inflation had been relatively broad based and therefore should not be discounted as merely statistical aberrations. However, a few participants noted that residual seasonality could have affected the inflation readings at the start of the year. Participants generally commented that they remained highly attentive to inflation risks but that they had also anticipated that there would be some unevenness in monthly inflation readings as inflation returned to target.
In their outlook for inflation, participants noted that they continued to expect that inflation would return to 2 percent over the medium term. They remained concerned that elevated inflation continued to harm households, especially those least able to meet the higher costs of essentials like food, housing, and transportation. A few participants remarked that they expected core nonhousing services inflation to decline as the labor market continued to move into better balance and wage growth moderated further. Participants discussed the still-elevated rate of housing services inflation and commented on the uncertainty regarding when and by how much lower readings for rent growth on new leases would pass through to this category of inflation. Several participants noted that the disinflationary pressure for core goods that had resulted from the receding of supply chain bottlenecks was likely to moderate. Other factors related to aggregate supply, such as increases in the labor force or better productivity growth, were viewed by several participants as likely to support continued disinflation. Some participants reported that business contacts had indicated that they were less able to pass on price increases or that consumers were becoming more sensitive to price changes. Some participants observed that longer-term inflation expectations appeared to remain well anchored, as reflected in a broad range of surveys of households, businesses, and forecasters, as well as measures from financial markets.
...
Participants noted indicators pointing to strong economic momentum and disappointing readings on inflation in recent months and commented that they did not expect it would be appropriate to reduce the target range for the federal funds rate until they had gained greater confidence that inflation was moving sustainably toward 2 percent.
emphasis added
Cleveland Fed: Median CPI increased 0.4% and Trimmed-mean CPI increased 0.3% in March
by Calculated Risk on 4/10/2024 11:35:00 AM
According to the Federal Reserve Bank of Cleveland, the median Consumer Price Index rose 0.4% in March. The 16% trimmed-mean Consumer Price Index increased 0.3%. "The median CPI and 16% trimmed-mean CPI are measures of core inflation calculated by the Federal Reserve Bank of Cleveland based on data released in the Bureau of Labor Statistics’ (BLS) monthly CPI report".
 Click on graph for larger image.
This graph shows the year-over-year change for these four key measures of inflation.
Note: The Cleveland Fed released the median CPI details. Rent and Owner's equivalent rent are still very high, and if we exclude rent, median CPI would be around 1.95% year-over-year.
YoY Measures of Inflation: Services, Goods and Shelter
by Calculated Risk on 4/10/2024 08:54:00 AM
Here are a few measures of inflation:
The first graph is the one Fed Chair Powell had mentioned when services less rent of shelter was up around 8% year-over-year. This declined, but has turned up recently, and is now up 4.8% YoY.

This graph shows the YoY price change for Services and Services less rent of shelter through March 2024.
Services less rent of shelter was up 4.8% YoY in March, up from 3.9% YoY in February.
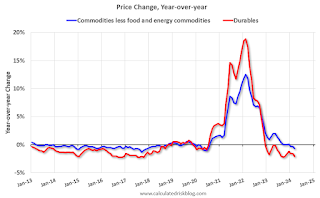
 The second graph shows that goods prices started to increase year-over-year (YoY) in 2020 and accelerated in 2021 due to both strong demand and supply chain disruptions.
Commodities less food and energy commodities were at -0.7% YoY in March, down from -0.3% YoY in February.
 Here is a graph of the year-over-year change in shelter from the CPI report (through March) and housing from the PCE report (through February)
Shelter was up 5.6% year-over-year in March, down from 5.8% in February. Housing (PCE) was up 5.8% YoY in February, down from 6.1% in January.
Core CPI ex-shelter was up 2.4% YoY in March, up from 2.2% in February.
BLS: CPI Increased 0.4% in March; Core CPI increased 0.4%
by Calculated Risk on 4/10/2024 08:30:00 AM
The Consumer Price Index for All Urban Consumers (CPI-U) increased 0.4 percent in March on a seasonally adjusted basis, the same increase as in February, the U.S. Bureau of Labor Statistics reported today. Over the last 12 months, the all items index increased 3.5 percent before seasonal adjustment.The change in both CPI and core CPI were above expectations. I'll post a graph later today after the Cleveland Fed releases the median and trimmed-mean CPI.
The index for shelter rose in March, as did the index for gasoline. Combined, these two indexes contributed over half of the monthly increase in the index for all items. The energy index rose 1.1 percent over the month. The food index rose 0.1 percent in March. The food at home index was unchanged, while the food away from home index rose 0.3 percent over the month.
The index for all items less food and energy rose 0.4 percent in March, as it did in each of the 2 preceding months. Indexes which increased in March include shelter, motor vehicle insurance, medical care, apparel, and personal care. The indexes for used cars and trucks, recreation, and new vehicles were among those that decreased over the month.
The all items index rose 3.5 percent for the 12 months ending March, a larger increase than the 3.2-percent increase for the 12 months ending February. The all items less food and energy index rose 3.8 percent over the last 12 months. The energy index increased 2.1 percent for the 12 months ending March, the first 12-month increase in that index since the period ending February 2023. The food index increased 2.2 percent over the last year.
emphasis added
MBA: Mortgage Applications Increased in Weekly Survey
by Calculated Risk on 4/10/2024 07:00:00 AM
From the MBA: Mortgage Applications Increase in Latest MBA Weekly Survey
Mortgage applications increased 0.1 percent from one week earlier, according to data from the Mortgage Bankers Association’s (MBA) Weekly Mortgage Applications Survey for the week ending April 5, 2024.
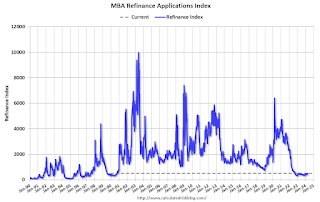
The Market Composite Index, a measure of mortgage loan application volume, increased 0.1 percent on a seasonally adjusted basis from one week earlier. On an unadjusted basis, the Index increased 0.2 percent compared with the previous week. The Refinance Index increased 10 percent from the previous week and was 4 percent higher than the same week one year ago. The seasonally adjusted Purchase Index decreased 5 percent from one week earlier. The unadjusted Purchase Index decreased 4 percent compared with the previous week and was 23 percent lower than the same week one year ago.
“Mortgage rates moved higher last week as several Federal Reserve officials reiterated a patient posture on rate cuts. Inflation remains stubbornly above the Fed’s target, and the broader economy continues to show resiliency. Unexpectedly strong employment data released last week further added to the upward pressure on rates,” said Joel Kan, MBA’s Vice President and Deputy Chief Economist. “The 30-year fixed rate increased to 7.01 percent, the highest in over a month. Purchase applications were down almost five percent to the lowest level since the end of February, but refinance applications were up 10 percent, driven particularly by VA refinance applications.”
...
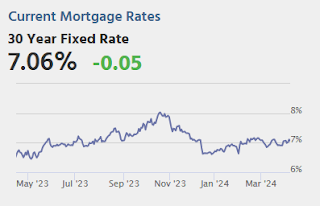
The average contract interest rate for 30-year fixed-rate mortgages with conforming loan balances ($766,550 or less) increased to 7.01 percent from 6.91 percent, with points remaining at 0.59 (including the origination fee) for 80 percent loan-to-value ratio (LTV) loans.
emphasis added
 Click on graph for larger image.
The first graph shows the MBA mortgage purchase index.
According to the MBA, purchase activity is down 23% year-over-year unadjusted.

Tuesday, April 09, 2024
Wednesday: CPI, FOMC Minutes
by Calculated Risk on 4/09/2024 07:43:00 PM

Wednesday:
• At 7:00 AM ET, The Mortgage Bankers Association (MBA) will release the results for the mortgage purchase applications index.
• At 8:30 AM, The Consumer Price Index for March from the BLS. The consensus is for 0.4% increase in CPI (up 3.5% YoY) and a 0.3% increase in core CPI (up 3.7% YoY).
• At 2:00 PM, FOMC Minutes, Meeting of March 19-20<
CPI Preview
by Calculated Risk on 4/09/2024 03:50:00 PM
Currently CPI is a significant market mover, especially for mortgage rates. Here are two previews on the report tomorrow.
From BofA:
After two firm reports to start the year, core CPI inflation should cool off in March. We expect core CPI inflation to round down to 0.2% m/m (0.24% unrounded) owing to a slight decline in core goods prices and less price pressure from core services. Meanwhile, headline CPI should round up to 0.3% m/m (0.25% unrounded). If our forecast proves correct, it should provide some confidence to the Fed.From Goldman:
We expect a 0.27% increase in March core CPI (vs. 0.3% consensus), corresponding to a year-over-year rate of 3.70% (vs. 3.7% consensus). We expect a 0.29% increase in March headline CPI (vs. 0.3% consensus), which corresponds to a year-over-year rate of 3.37% (vs. 3.4% consensus).
An Update on the House Price Battle Royale: Low Inventory vs Affordability
by Calculated Risk on 4/09/2024 11:16:00 AM
Today, in the Calculated Risk Real Estate Newsletter: An Update on the House Price Battle Royale: Low Inventory vs Affordability
A brief excerpt:
Almost a year ago I wrote: House Price Battle Royale: Low Inventory vs Affordability. Here is an update as the battle continues!There is much more in the article.
I’ve been wrestling with the impact on house prices of the rapid increase in mortgage rates and monthly payments over the last two years. My reaction was the current situation was somewhat similar to the 1978 to 1982 period and we would likely see prices decline in real terms (adjusted for inflation). See from March 2022: Housing: Don't Compare the Current Housing Boom to the Bubble and Bust.
In that article I wrote on prices:[W]e should expect something similar to the what happened in the late ‘70s - a decline in real house prices seems likely … Currently we just have to watch and wait. However, we can be fairly confident that we won’t see cascading nominal price declines like during the housing bust - since there will be few distressed sales.In the 1980 period, nominal prices only declined slightly on a month-to-month basis a few times according to the Case-Shiller National house price index. However, real prices - adjusted for inflation - declined 10.7% from the peak. The inflation adjusted peak was in October 1979, and real prices didn’t exceed that peak until May 1986 (See from October 2022: House Prices: 7 Years in Purgatory).


