 RSS Feed
 by Calculated Risk on 3/23/2024 02:11:00 PM
Saturday, March 23, 2024
Real Estate Newsletter Articles this Week: Single Family Starts Up 35% Year-over-year in February
At the Calculated Risk Real Estate Newsletter this week:
• NAR: Existing-Home Sales Increased to 4.38 million SAAR in February
• Single Family Starts Up 35% Year-over-year in February; Multi-Family Starts Down Sharply
• "The Lock-In Effect of Rising Mortgage Rates"
• California February Existing Home Sales increase 1.3% YoY, Prices up 9.7% YoY
This is usually published 4 to 6 times a week and provides more in-depth analysis of the housing market.
Schedule for Week of March 24, 2024
by Calculated Risk on 3/23/2024 08:11:00 AM
The key reports scheduled for this week include February New Home sales, the 3rd estimate of Q4 GDP, February Personal Income & Outlays, and January Case-Shiller house prices.
For manufacturing, the March Dallas, Richmond and Kansas City Fed surveys will be released.
8:30 AM ET: Chicago Fed National Activity Index for February. This is a composite index of other data.
 10:00 AM: New Home Sales for February from the Census Bureau.
 This graph shows New Home Sales since 1963. The dashed line is the sales rate for last month.
The consensus is for 673 thousand SAAR, up from 661 thousand in January.
8:30 AM: Durable Goods Orders for February from the Census Bureau. The consensus is for a 1.0% increase in durable goods orders.
 9:00 AM: S&P/Case-Shiller House Price Index for January.
This graph shows the year-over-year change for the Case-Shiller National, Composite 10 and Composite 20 indexes, through the most recent report (the Composite 20 was started in January 2000).
The consensus is for a 5.8% year-over-year increase in the National index for January, up from 5.5% YoY in December.
9:00 AM: FHFA House Price Index for January 2021. This was originally a GSE only repeat sales, however there is also an expanded index.
10:00 AM: Richmond Fed Survey of Manufacturing Activity for March.
10:30 AM: Dallas Fed Survey of Manufacturing Activity for March.
7:00 AM ET: The Mortgage Bankers Association (MBA) will release the results for the mortgage purchase applications index.
8:30 AM, Gross Domestic Product, 4th Quarter and Year 2023 (Third Estimate), GDP by Industry, and Corporate Profits. The consensus is that real GDP increased 3.2% annualized in Q4, unchanged from the second estimate.
8:30 AM: The initial weekly unemployment claims report will be released. The consensus is for 208 thousand initial claims, down from 210 thousand last week.
9:45 AM: Chicago Purchasing Managers Index for March. The consensus is for a reading of 43.0, down from 44.0 in February.
10:00 AM: Pending Home Sales Index for February. The consensus is for a 2.0% increase in the index.
10:00 AM: University of Michigan's Consumer sentiment index (Final for March). The consensus is for a reading of 76.5.
11:00 AM: the Kansas City Fed manufacturing survey for March. This is the last of the regional surveys for March.
All US markets will be closed in observance of Good Friday.
8:30 AM: Personal Income and Outlays for February. The consensus is for a 0.4% increase in personal income, and for a 0.5% increase in personal spending. And for the Core PCE price index to increase 0.3%. PCE prices are expected to be up 2.5% YoY, and core PCE prices up 2.8% YoY.
11:30 AM: Discussion, Fed Chair Jerome Powell, Moderated Discussion with Kai Ryssdal, At the Federal Reserve Bank of San Francisco Macroeconomics and Monetary Policy Conference, San Francisco, Calif
Friday, March 22, 2024
March 22nd COVID Update: Weekly Deaths Decreased
by Calculated Risk on 3/22/2024 07:46:00 PM
 Note: Mortgage rates are from MortgageNewsDaily.com and are for top tier scenarios.
Due to changes at the CDC, weekly cases are no longer updated.
For deaths, I'm currently using 4 weeks ago for "now", since the most recent three weeks will be revised significantly.
Hospitalizations have declined significantly from the winter high of 30,025 earlier this year but are still close to double the low of 5,380 last year.
| COVID Metrics | ||||
|---|---|---|---|---|
| Now | Week Ago | Goal | ||
| Hospitalized2 | 10,163 | 12,438 | ≤3,0001 | |
| Deaths per Week2 | 1,190 | 1,318 | ≤3501 | |
| 1my goals to stop weekly posts, 2Weekly for Currently Hospitalized, and Deaths 🚩 Increasing number weekly for Hospitalized and Deaths ✅ Goal met. | ||||
 Click on graph for larger image.
This graph shows the weekly (columns) number of deaths reported.
Weekly deaths have declined sharply from the recent peak of 2,528 but are still more than double the low of 490 last July.
 This appears to be a leading indicator for COVID hospitalizations and deaths.
Nationally, COVID in wastewater is now off more than 80% from the holiday peak at the end of December, and that suggests weekly hospitalizations and deaths will continue to decline.
ICE: Mortgage Delinquency Rate Decreased in February
by Calculated Risk on 3/22/2024 12:06:00 PM
From ICE (formerly Black Knight): ICE First Look at Mortgage Performance: Delinquencies Improve and Foreclosures Drop as Prepayments Rise Modestly
• The national delinquency rate eased to 3.34% in February, down 4 basis points (bps) from the month before and 11 bps lower than in February 2023Note: that last column below is for the same month in 2019 to show the change from pre-pandemic levels.
• While the number of borrowers one payment behind rose modestly by 10K, those 60 days late as well as those 90 or more days past due both fell to their lowest levels in three months
• Delinquency inflows rose 6.5% from January’s eight-month low, while rolls to later stages continued their recent improvement
• Serious delinquencies (loans 90+ days past due but not in active foreclosure) are down 103K (-18%) year over year, with the population now standing at 459K
• Representing 5.3% of serious delinquencies, February’s 25K foreclosure starts is the second lowest in the last twelve months
• The number of loans in active foreclosure fell -7K to 211K, remaining 25% (-72K) below pre-pandemic levels
• 6K foreclosure sales were completed nationally in February, a 9% decrease from the previous month and the second lowest level in the trailing 12-month period
• Prepayment activity rose 3 bps in February to a level not seen since October, as a brief dip in rates heading into the month provided a modest increase in refinance incentive
emphasis added
| ICE: Percent Loans Delinquent and in Foreclosure Process | ||||
|---|---|---|---|---|
| Feb 2024 | Jan 2024 | Feb 2023 | Feb 2019 | |
| Delinquent | 3.34% | 3.38% | 3.45% | 3.89% |
| In Foreclosure | 0.40% | 0.41% | 0.46% | 0.51% |
| Number of properties: | ||||
| Number of properties that are delinquent, but not in foreclosure: | 1,782,000 | 1,803,000 | 1,811,000 | 2,019,000 |
| Number of properties in foreclosure pre-sale inventory: | 211,000 | 219,000 | 240,000 | 264,000 |
| Total Properties | 1,993,000 | 2,022,000 | 2,050,000 | 2,284,000 |
Q1 GDP Tracking: Around 2%
by Calculated Risk on 3/22/2024 10:18:00 AM
From BofA:
Since our update last week, 1Q GDP tracking is down two-tenths to 2.2% q/q saar. 4Q tracking remained at 3.5% q/q saar. [Mar 22nd estimate]From Goldman:
emphasis added
We boosted our Q1 GDP tracking estimate by 0.2pp to +1.9% (qoq ar). Our Q1 domestic final sales growth forecast now stands at +2.2% (qoq ar). [Mar 21st estimate]And from the Altanta Fed: GDPNow
The GDPNow model estimate for real GDP growth (seasonally adjusted annual rate) in the first quarter of 2024 is 2.1 percent on March 19, down from 2.3 percent from March 14. [March 19th estimate]
Hotels: Occupancy Rate Decreased 1.4% Year-over-year
by Calculated Risk on 3/22/2024 08:21:00 AM
U.S. hotel performance increased from the previous week but showed continued declines year over year, according to CoStar’s latest data through 16 March.The following graph shows the seasonal pattern for the hotel occupancy rate using the four-week average.
10-16 March 2024 (percentage change from comparable week in 2023):
• Occupancy: 66.5% (-1.4%)
• Average daily rate (ADR): US$163.21 (-2.1%)
• Revenue per available room (RevPAR): US$108.51 (-3.5%)
emphasis added
 Click on graph for larger image.
The red line is for 2024, black is 2020, blue is the median, and dashed light blue is for 2023. Dashed purple is for 2018, the record year for hotel occupancy.
The 4-week average of the occupancy rate is tracking slightly below last year, and below the median rate for the period 2000 through 2023 (Blue).
Note: Y-axis doesn't start at zero to better show the seasonal change.
The 4-week average of the occupancy rate will move mostly sideways seasonally until the summer travel season.
Thursday, March 21, 2024
Realtor.com Reports Active Inventory UP 23.8% YoY; New Listings up 17.8% YoY
by Calculated Risk on 3/21/2024 02:51:00 PM
What this means: On a weekly basis, Realtor.com reports the year-over-year change in active inventory and new listings. On a monthly basis, they report total inventory. For February, Realtor.com reported inventory was up 14.8% YoY, but still down almost 40% compared to February 2019.
Now - on a weekly basis - inventory is up 23.8% YoY.
Realtor.com has monthly and weekly data on the existing home market. Here is their weekly report: Weekly Housing Trends View—Data Week Ending March 16, 2024 Here is a graph of the year-over-year change in inventory according to realtor.com.
Inventory was up year-over-year for the 19th consecutive week following 20 consecutive weeks with a YoY decrease in inventory.
Realtor.com has monthly and weekly data on the existing home market. Here is their weekly report: Weekly Housing Trends View—Data Week Ending March 16, 2024
• Active inventory increased, with for-sale homes 23.8% above year-ago levels. For a 19th straight week, active listings registered above the prior year’s level, which means that today’s home shoppers can consider more options for existing homes for sale. However, the number of homes on the market is still down nearly 40% compared with what was typical in 2017 to 2019, and the gain in inventory, particularly in the more affordable under-$350,000 price category, was primarily focused in the South last month. Nonetheless, in the first few weeks of March, inventory growth has also accelerated in the Midwest and West, while inventory in the Northeast remains similar to the previous year’s.
• New listings–a measure of sellers putting homes up for sale–were up this week, by 17.8% from one year ago. For the 21st consecutive week, newly listed homes have surpassed year-ago levels. This rate of growth is also increasing, with newly listed homes growing 17.8% compared with last year, while the previous week’s growth rate was 15.8%. This is the highest year-over-year growth rate in new listings seen since May 2021, but the base of inventory for this growth remains small.
 Here is a graph of the year-over-year change in inventory according to realtor.com.
 Inventory was up year-over-year for the 19th consecutive week following 20 consecutive weeks with a YoY decrease in inventory.
Inventory is still historically very low.
Although new listings remain below typical pre-pandemic levels, new listings are now up YoY for the 21st consecutive week.
BofA "Should policy be set on OER if nobody pays it?"
by Calculated Risk on 3/21/2024 12:57:00 PM
A brief excerpt from a BofA research note.
BofA economists ask: Should policy be set on OER if nobody pays
it?
One main factor behind sticky services inflation in the US has been the behavior of owners’ equivalent rent (OER), which measures the change in the cost of owner occupied housing. ... The Bureau of Labor Statistics (BLS) estimates OER by using actual rents as a proxy. Rents, which initially plunged during the pandemic, rebounded sharply for several reasons. These include a shift in demand from urban to rural locations where inventory was scarce, an increased desire to live alone, and a need for increased space to accommodate work-from-home arrangements.
That being said, we ask the following provocative question: should monetary policy be based on a price that two out of three households are not paying. ... The Harmonized Index of Consumer Prices (HIPC) [that] was created to mimic how inflation is estimated in Europe, which excludes OER from its price index due to disagreement over how to estimate owner-occupied housing costs. While headline CPI inflation was up 3.2% y/y through February and headline PCE inflation was up 2.4% through January (February data has not been released yet), where was HICP inflation? HICP inflation was up only 2.2%.
I've written extensively about the surge in household formation during the pandemic (mostly due to work from home), how and why asking rents are mostly flat year-over-year, and why I think OER should mostly be ignored right now by the Fed (monetary policy cannot impact the past).
Where would the Fed’s confidence to cut be if it saw inflation at 2.2%? We think most certainly higher.
With the February CPI report, I noted: "Rent and Owner's equivalent rent are still very high, and if we exclude rent, median CPI would be around 1.8% year-over-year." Core CPI ex-shelter was up 2.2% YoY in February, unchanged from 2.2% in January.
NAR: Existing-Home Sales Increased to 4.38 million SAAR in February; Median Prices Down 7.1 From Peak (NSA)
by Calculated Risk on 3/21/2024 10:40:00 AM
Today, in the CalculatedRisk Real Estate Newsletter: NAR: Existing-Home Sales Increased to 4.38 million SAAR in February
Excerpt:
Sales Year-over-Year and Not Seasonally Adjusted (NSA)There is much more in the article.
The fourth graph shows existing home sales by month for 2023 and 2024.
Sales declined 3.3% year-over-year compared to February 2023. This was the thirtieth consecutive month with sales down year-over-year. Be careful with February sales - the seasonal factor plays a role in boosting sales.

NAR: Existing-Home Sales Increased to 4.38 million SAAR in February
by Calculated Risk on 3/21/2024 10:00:00 AM
From the NAR: Existing-Home Sales Vaulted 9.5% in February, Largest Monthly Increase in a Year
Existing-home sales climbed in February, according to the National Association of REALTORS®. Among the four major U.S. regions, sales jumped in the West, South and Midwest, and were unchanged in the Northeast. Year-over-year, sales declined in all regions.
Total existing-home sales– completed transactions that include single-family homes, townhomes, condominiums and co-ops – bounced 9.5% from January to a seasonally adjusted annual rate of 4.38 million in February. Year-over-year, sales slid 3.3% (down from 4.53 million in February 2023).
...
Total housing inventory registered at the end of February was 1.07 million units, up 5.9% from January and 10.3% from one year ago (970,000). Unsold inventory sits at a 2.9-month supply at the current sales pace, down from 3.0 months in January but up from 2.6 months in February 2023.
emphasis added
 Click on graph for larger image.
This graph shows existing home sales, on a Seasonally Adjusted Annual Rate (SAAR) basis since 1994.
Sales in February (4.38 million SAAR) were up 9.5% from the previous month and were 3.3% below the February 2023 sales rate.
The second graph shows nationwide inventory for existing homes.
 According to the NAR, inventory increased to 1.07 million in February from 1.01 million the previous month.
 According to the NAR, inventory increased to 1.07 million in February from 1.01 million the previous month.
Headline inventory is not seasonally adjusted, and inventory usually decreases to the seasonal lows in December and January, and peaks in mid-to-late summer.
The last graph shows the year-over-year (YoY) change in reported existing home inventory and months-of-supply. Since inventory is not seasonally adjusted, it really helps to look at the YoY change. Note: Months-of-supply is based on the seasonally adjusted sales and not seasonally adjusted inventory.
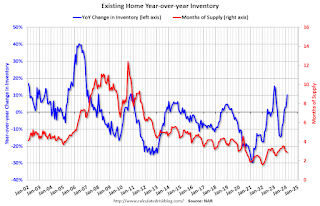 Inventory was up 10.3% year-over-year (blue) in February compared to February 2023.
Months of supply (red) decreased to 2.9 months in February from 3.0 months the previous month.
This was above the consensus forecast (but at Tom Lawler's estimate). I'll have more later.
The last graph shows the year-over-year (YoY) change in reported existing home inventory and months-of-supply. Since inventory is not seasonally adjusted, it really helps to look at the YoY change. Note: Months-of-supply is based on the seasonally adjusted sales and not seasonally adjusted inventory.
 Inventory was up 10.3% year-over-year (blue) in February compared to February 2023.
 Months of supply (red) decreased to 2.9 months in February from 3.0 months the previous month.
This was above the consensus forecast (but at Tom Lawler's estimate). I'll have more later.


