 RSS Feed
 by Calculated Risk on 3/21/2024 08:30:00 AM
Thursday, March 21, 2024
Weekly Initial Unemployment Claims Decrease to 210,000
The DOL reported:
In the week ending March 16, the advance figure for seasonally adjusted initial claims was 210,000, a decrease of 2,000 from the previous week's revised level. The previous week's level was revised up by 3,000 from 209,000 to 212,000. The 4-week moving average was 211,250, an increase of 2,500 from the previous week's revised average. The previous week's average was revised up by 750 from 208,000 to 208,750.The following graph shows the 4-week moving average of weekly claims since 1971.
emphasis added
 Click on graph for larger image.
The dashed line on the graph is the current 4-week average. The four-week average of weekly unemployment claims increased to 211,250.
The previous week was revised up.
Weekly claims were close to the consensus forecast.
Wednesday, March 20, 2024
Thursday: Unemployment Claims, Existing Home Sales
by Calculated Risk on 3/20/2024 07:54:00 PM
 Note: Mortgage rates are from MortgageNewsDaily.com and are for top tier scenarios.
Thursday:
• At 8:30 AM ET, The initial weekly unemployment claims report will be released. The consensus is for 212 thousand initial claims, up from 209 thousand last week.
• Also at 8:30 AM, the Philly Fed manufacturing survey for March. The consensus is for a reading of -2.5, down from 5.2.
• At 10:00 AM: Existing Home Sales for February from the National Association of Realtors (NAR). The consensus is for 3.94 million SAAR, down from 4.00 million. Housing economist Tom Lawler expects the NAR to report sales of 4.40 million SAAR for February (well above consensus).
FOMC Projections and Press Conference
by Calculated Risk on 3/20/2024 02:10:00 PM
Statement here.
Fed Chair Powell press conference video here or on YouTube here, starting at 2:30 PM ET.
Here are the projections. Since the last projections were released, the economy has performed close to FOMC expectations.
In December, the FOMC participants’ midpoint of the target level for the federal funds rate was at 4.675% at the end of 2024. The FOMC participants’ midpoint of the target range is now at 4.675% at the end of 2024.
Market participants expects the target range to be between 4.5% and 4.75% at the end of 2024.
1 Projections of change in real GDP and inflation are from the fourth quarter of the previous year to the fourth quarter of the year indicated.
The unemployment rate was at 3.9% in February and the projections for Q4 2024 were down slightly.
2 Projections for the unemployment rate are for the average civilian unemployment rate in the fourth quarter of the year indicated.
As of January 2024, PCE inflation increased 2.4 percent year-over-year (YoY). The projections for PCE inflation were revised up slightly.
PCE core inflation increased 2.8 percent YoY in January. The projections for core PCE inflation were revised up slightly.
Early estimates for Q1 GDP are around 2% annualized, and the FOMC projections for year-over-year growth in Q4 2024 were revised up.
| GDP projections of Federal Reserve Governors and Reserve Bank presidents, Change in Real GDP1 | ||||
|---|---|---|---|---|
| Projection Date | 2024 | 2025 | 2026 | |
| Mar 2024 | 2.0 to 2.4 | 1.9 to 2.3 | 1.8 to 2.1 | |
| Dec 2023 | 1.2 to 1.7 | 1.5 to 2.0 | 1.8 to 2.0 | |
The unemployment rate was at 3.9% in February and the projections for Q4 2024 were down slightly.
| Unemployment projections of Federal Reserve Governors and Reserve Bank presidents, Unemployment Rate2 | ||||
|---|---|---|---|---|
| Projection Date | 2024 | 2025 | 2026 | |
| Mar 2024 | 3.9 to 4.1 | 3.9 to 4.2 | 3.9 to 4.3 | |
| Dec 2023 | 4.0 to 4.2 | 4.0 to 4.2 | 3.9 to 4.3 | |
As of January 2024, PCE inflation increased 2.4 percent year-over-year (YoY). The projections for PCE inflation were revised up slightly.
| Inflation projections of Federal Reserve Governors and Reserve Bank presidents, PCE Inflation1 | ||||
|---|---|---|---|---|
| Projection Date | 2024 | 2025 | 2026 | |
| Mar 2024 | 2.3 to 2.7 | 2.1 to 2.2 | 2.0 to 2.1 | |
| Dec 2023 | 2.2 to 2.5 | 2.0 to 2.2 | 2.0 | |
PCE core inflation increased 2.8 percent YoY in January. The projections for core PCE inflation were revised up slightly.
Over the last 6 months, the PCE Price Index increase 2.5% annualized, the core PCE price index increased at a 2.5% annual rate. However, core PCE minus Housing increased at a 1.8% annualized rate suggesting that 2024 projections are too high.
| Core Inflation projections of Federal Reserve Governors and Reserve Bank presidents, Core Inflation1 | ||||
|---|---|---|---|---|
| Projection Date | 2024 | 2025 | 2026 | |
| Mar 2024 | 2.5 to 2.8 | 2.1 to 2.3 | 2.0 to 2.1 | |
| Dec 2023 | 2.4 to 2.7 | 2.0 to 2.2 | 2.0 to 2.1 | |
FOMC Statement: No Change to Policy
by Calculated Risk on 3/20/2024 02:00:00 PM
Recent indicators suggest that economic activity has been expanding at a solid pace. Job gains have remained strong, and the unemployment rate has remained low. Inflation has eased over the past year but remains elevated.
The Committee seeks to achieve maximum employment and inflation at the rate of 2 percent over the longer run. The Committee judges that the risks to achieving its employment and inflation goals are moving into better balance. The economic outlook is uncertain, and the Committee remains highly attentive to inflation risks.
In support of its goals, the Committee decided to maintain the target range for the federal funds rate at 5-1/4 to 5-1/2 percent. In considering any adjustments to the target range for the federal funds rate, the Committee will carefully assess incoming data, the evolving outlook, and the balance of risks. The Committee does not expect it will be appropriate to reduce the target range until it has gained greater confidence that inflation is moving sustainably toward 2 percent. In addition, the Committee will continue reducing its holdings of Treasury securities and agency debt and agency mortgage-backed securities, as described in its previously announced plans. The Committee is strongly committed to returning inflation to its 2 percent objective.
In assessing the appropriate stance of monetary policy, the Committee will continue to monitor the implications of incoming information for the economic outlook. The Committee would be prepared to adjust the stance of monetary policy as appropriate if risks emerge that could impede the attainment of the Committee's goals. The Committee's assessments will take into account a wide range of information, including readings on labor market conditions, inflation pressures and inflation expectations, and financial and international developments.
Voting for the monetary policy action were Jerome H. Powell, Chair; John C. Williams, Vice Chair; Thomas I. Barkin; Michael S. Barr; Raphael W. Bostic; Michelle W. Bowman; Lisa D. Cook; Mary C. Daly; Philip N. Jefferson; Adriana D. Kugler; Loretta J. Mester; and Christopher J. Waller.
emphasis added
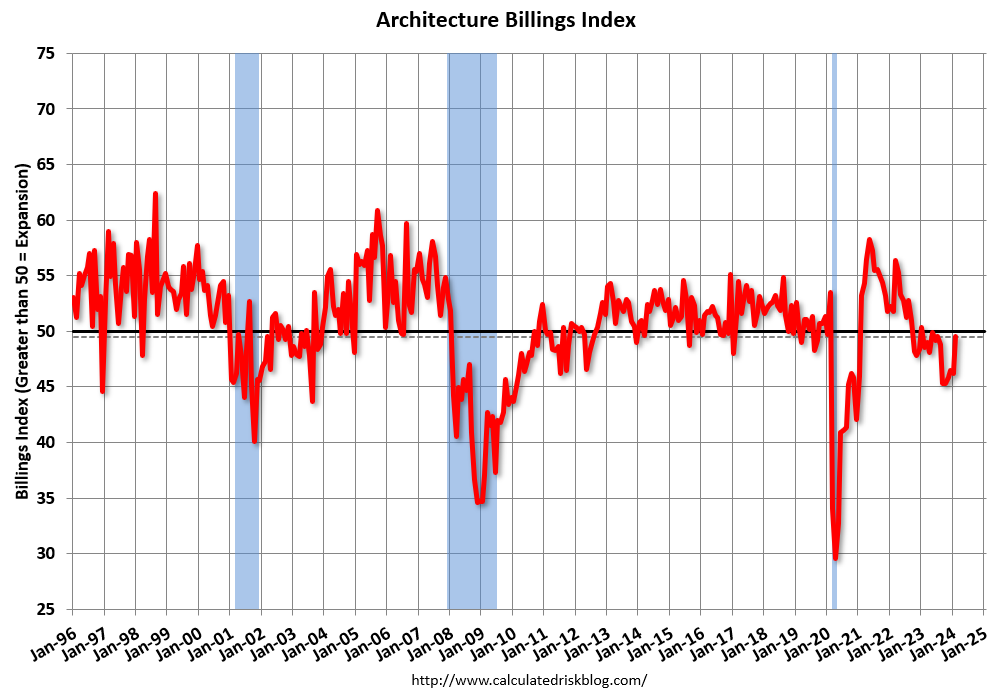
AIA: "Moderation in the Slowdown in Business Conditions at Architecture Firms"; Multi-family Billings Decline for 19th Consecutive Month
by Calculated Risk on 3/20/2024 10:11:00 AM
Note: This index is a leading indicator primarily for new Commercial Real Estate (CRE) investment.
From the AIA: AIA/Deltek ABI Reports Moderation in the Slowdown in Business Conditions at Architecture Firms in February
Architecture firm billings continued to decline in February, with an AIA/Deltek Architecture Billings Index (ABI) score of 49.5 for the month. However, February’s score marks the most modest easing in billings since July 2023 and suggests that the recent slowdown may be receding.• Northeast (44.0); Midwest (50.8); South (47.7); West (47.2)
“There are indicators this month that business conditions at firms may finally begin to pick up in the coming months. Inquiries into new projects grew at their fastest pace since November, and the value of newly signed design contracts increased at their fastest pace since last summer,” said Kermit Baker, PhD, AIA Chief Economist." Given the moderation of inflation for construction costs and prospects for lower interest rates in the coming months, there are positive signs for future growth.”
The Midwest as a region is still reporting billings growth, despite business conditions remaining weak across the country in February. Firms located in the Midwest reported growth for the last three months, and for four of the last five months.
The ABI score is a leading economic indicator of construction activity, providing an approximately nine-to-twelve-month glimpse into the future of nonresidential construction spending activity. The score is derived from a monthly survey of architecture firms that measures the change in the number of services provided to clients.
emphasis added
• Sector index breakdown: commercial/industrial (46.1); institutional (50.7); mixed practice (firms that do not have at least half of their billings in any one other category) (47.1); multifamily residential (44.9)
 Click on graph for larger image.
This graph shows the Architecture Billings Index since 1996. The index was at 49.5 in February, up from 46.2 in January. Anything below 50 indicates a decrease in demand for architects' services.
Note: This includes commercial and industrial facilities like hotels and office buildings, multi-family residential, as well as schools, hospitals and other institutions.
This index usually leads CRE investment by 9 to 12 months, so this index suggests a slowdown in CRE investment in 2024.
Note that multi-family billing turned down in August 2022 and has been negative for nineteen consecutive months (with revisions). This suggests we will see a further weakness in multi-family starts.
MBA: Mortgage Applications Decreased in Weekly Survey
by Calculated Risk on 3/20/2024 07:00:00 AM
From the MBA: Mortgage Applications Decrease in Latest MBA Weekly Survey
Mortgage applications decreased 1.6 percent from one week earlier, according to data from the Mortgage Bankers Association’s (MBA) Weekly Mortgage Applications Survey for the week ending March 15, 2024.
The Market Composite Index, a measure of mortgage loan application volume, decreased 1.6 percent on a seasonally adjusted basis from one week earlier. On an unadjusted basis, the Index decreased 1 percent compared with the previous week. The Refinance Index decreased 3 percent from the previous week and was 3 percent lower than the same week one year ago. The seasonally adjusted Purchase Index decreased 1 percent from one week earlier. The unadjusted Purchase Index decreased 1 percent compared with the previous week and was 14 percent lower than the same week one year ago.
“Mortgage rates increased last week as incoming data showed inflation was still hotter than expected, which stoked concerns about the timing and extent to which the Fed might be able to reduce the fed funds rates this year. After three weeks of declines, the 30-year fixed mortgage rate increased to 6.97 percent,” said Joel Kan, MBA’s Vice President and Deputy Chief Economist. “Mortgage applications continued to show sensitivity to rate movements, and both purchase and refinance activity decreased over the week. With housing supply low and prices high, the average loan size for purchase applications increased to the highest level since May 2022.”
...
The average contract interest rate for 30-year fixed-rate mortgages with conforming loan balances ($766,550 or less) increased to 6.97 percent from 6.84 percent, with points decreasing to 0.64 from 0.65 (including the origination fee) for 80 percent loan-to-value ratio (LTV) loans.
emphasis added
 Click on graph for larger image.
The first graph shows the MBA mortgage purchase index.
According to the MBA, purchase activity is down 14% year-over-year unadjusted.
Red is a four-week average (blue is weekly).
Purchase application activity is up slightly from the lows in late October 2023, and below the lowest levels during the housing bust.

The second graph shows the refinance index since 1990.
With higher mortgage rates, the refinance index declined sharply in 2022, and has mostly flatlined since then.
Tuesday, March 19, 2024
Wednesday: FOMC Statement
by Calculated Risk on 3/19/2024 07:52:00 PM
 Note: Mortgage rates are from MortgageNewsDaily.com and are for top tier scenarios.
Wednesday:
• At 7:00 AM ET, The Mortgage Bankers Association (MBA) will release the results for the mortgage purchase applications index.
• During the day, The AIA's Architecture Billings Index for February (a leading indicator for commercial real estate).
• At 2:00 PM, FOMC Meeting Announcement. No change to policy is expected at this meeting.
• At 2:00 PM, FOMC Projections. This will include the Federal Open Market Committee (FOMC) participants' projections of the appropriate target federal funds rate along with updated economic projections.
• At 2:30 PM, Fed Chair Jerome Powell holds a press briefing following the FOMC announcement.
California February Existing Home Sales increase 1.3% YoY, Prices up 9.7% YoY
by Calculated Risk on 3/19/2024 01:40:00 PM
Today, in the Calculated Risk Real Estate Newsletter: California February Existing Home Sales increase 1.3% YoY, Prices up 9.7% YoY
A brief excerpt:
February’s sales pace jumped 12.8 percent higher from the revised 257,040 homes sold in January and rose 1.3 percent from a year ago, when a revised 286,290 homes were sold on an annualized basis.
...
The statewide median price recorded a strong year-over-year gain in February, gaining 9.7 percent from $735,300 in February 2023 to $806,490 in February 2024.
Single Family Starts Up 35% Year-over-year in February; Multi-Family Starts Down Sharply
by Calculated Risk on 3/19/2024 10:12:00 AM
Today, in the Calculated Risk Real Estate Newsletter: Single Family Starts Up 35% Year-over-year in February; Multi-Family Starts Down Sharply
A brief excerpt:
Total housing starts in February were above expectations and starts in December and January were revised up.
Last month, I noted that permits held up better than starts in January, and that housing starts were impacted by the severe weather in January. For February, permits and starts were at about the same level.
The third graph shows the month-to-month comparison for total starts between 2023 (blue) and 2024 (red).
Total starts were up 5.9% in February compared to February 2023.
Starts were up year-over-year for the third consecutive month, after being down year-over-year for 16 of the previous 18 months.

Housing Starts Increased to 1.521 million Annual Rate in February
by Calculated Risk on 3/19/2024 08:30:00 AM
From the Census Bureau: Permits, Starts and Completions
Housing Starts:
Privately‐owned housing starts in February were at a seasonally adjusted annual rate of 1,521,000. This is 10.7 percent above the revised January estimate of 1,374,000 and is 5.9 percent above the February 2023 rate of 1,436,000. Single‐family housing starts in February were at a rate of 1,129,000; this is 11.6 percent above the revised January figure of 1,012,000. The February rate for units in buildings with five units or more was 377,000.
Building Permits:
Privately‐owned housing units authorized by building permits in February were at a seasonally adjusted annual rate of 1,518,000. This is 1.9 percent above the revised January rate of 1,489,000 and is 2.4 percent above the February 2023 rate of 1,482,000. Single‐family authorizations in February were at a rate of 1,031,000; this is 1.0 percent above the revised January figure of 1,021,000. Authorizations of units in buildings with five units or more were at a rate of 429,000 in February.
emphasis added
 Click on graph for larger image.
The first graph shows single and multi-family housing starts since 2000.
Multi-family starts (blue, 2+ units) increased in February compared to January. Multi-family starts were down 34.8% year-over-year in February.
Single-family starts (red) increased in February and were up 35.2% year-over-year.
 The second graph shows single and multi-family housing starts since 1968.
 This shows the huge collapse following the housing bubble, and then the eventual recovery - and the recent collapse and recovery in single-family starts.
Total housing starts in February were above expectations and starts in December and January were revised up.
I'll have more later …


