 RSS Feed
 by Calculated Risk on 3/22/2024 10:18:00 AM
Friday, March 22, 2024
Q1 GDP Tracking: Around 2%
From BofA:
Since our update last week, 1Q GDP tracking is down two-tenths to 2.2% q/q saar. 4Q tracking remained at 3.5% q/q saar. [Mar 22nd estimate]From Goldman:
emphasis added
We boosted our Q1 GDP tracking estimate by 0.2pp to +1.9% (qoq ar). Our Q1 domestic final sales growth forecast now stands at +2.2% (qoq ar). [Mar 21st estimate]And from the Altanta Fed: GDPNow
The GDPNow model estimate for real GDP growth (seasonally adjusted annual rate) in the first quarter of 2024 is 2.1 percent on March 19, down from 2.3 percent from March 14. [March 19th estimate]
Hotels: Occupancy Rate Decreased 1.4% Year-over-year
by Calculated Risk on 3/22/2024 08:21:00 AM
U.S. hotel performance increased from the previous week but showed continued declines year over year, according to CoStar’s latest data through 16 March.The following graph shows the seasonal pattern for the hotel occupancy rate using the four-week average.
10-16 March 2024 (percentage change from comparable week in 2023):
• Occupancy: 66.5% (-1.4%)
• Average daily rate (ADR): US$163.21 (-2.1%)
• Revenue per available room (RevPAR): US$108.51 (-3.5%)
emphasis added
 Click on graph for larger image.
The red line is for 2024, black is 2020, blue is the median, and dashed light blue is for 2023. Dashed purple is for 2018, the record year for hotel occupancy.
The 4-week average of the occupancy rate is tracking slightly below last year, and below the median rate for the period 2000 through 2023 (Blue).
Note: Y-axis doesn't start at zero to better show the seasonal change.
The 4-week average of the occupancy rate will move mostly sideways seasonally until the summer travel season.
Thursday, March 21, 2024
Realtor.com Reports Active Inventory UP 23.8% YoY; New Listings up 17.8% YoY
by Calculated Risk on 3/21/2024 02:51:00 PM
What this means: On a weekly basis, Realtor.com reports the year-over-year change in active inventory and new listings. On a monthly basis, they report total inventory. For February, Realtor.com reported inventory was up 14.8% YoY, but still down almost 40% compared to February 2019.
Now - on a weekly basis - inventory is up 23.8% YoY.
Realtor.com has monthly and weekly data on the existing home market. Here is their weekly report: Weekly Housing Trends View—Data Week Ending March 16, 2024 Here is a graph of the year-over-year change in inventory according to realtor.com.
Inventory was up year-over-year for the 19th consecutive week following 20 consecutive weeks with a YoY decrease in inventory.
Realtor.com has monthly and weekly data on the existing home market. Here is their weekly report: Weekly Housing Trends View—Data Week Ending March 16, 2024
• Active inventory increased, with for-sale homes 23.8% above year-ago levels. For a 19th straight week, active listings registered above the prior year’s level, which means that today’s home shoppers can consider more options for existing homes for sale. However, the number of homes on the market is still down nearly 40% compared with what was typical in 2017 to 2019, and the gain in inventory, particularly in the more affordable under-$350,000 price category, was primarily focused in the South last month. Nonetheless, in the first few weeks of March, inventory growth has also accelerated in the Midwest and West, while inventory in the Northeast remains similar to the previous year’s.
• New listings–a measure of sellers putting homes up for sale–were up this week, by 17.8% from one year ago. For the 21st consecutive week, newly listed homes have surpassed year-ago levels. This rate of growth is also increasing, with newly listed homes growing 17.8% compared with last year, while the previous week’s growth rate was 15.8%. This is the highest year-over-year growth rate in new listings seen since May 2021, but the base of inventory for this growth remains small.
 Here is a graph of the year-over-year change in inventory according to realtor.com.
 Inventory was up year-over-year for the 19th consecutive week following 20 consecutive weeks with a YoY decrease in inventory.
Inventory is still historically very low.
Although new listings remain below typical pre-pandemic levels, new listings are now up YoY for the 21st consecutive week.
BofA "Should policy be set on OER if nobody pays it?"
by Calculated Risk on 3/21/2024 12:57:00 PM
A brief excerpt from a BofA research note.
BofA economists ask: Should policy be set on OER if nobody pays
it?
One main factor behind sticky services inflation in the US has been the behavior of owners’ equivalent rent (OER), which measures the change in the cost of owner occupied housing. ... The Bureau of Labor Statistics (BLS) estimates OER by using actual rents as a proxy. Rents, which initially plunged during the pandemic, rebounded sharply for several reasons. These include a shift in demand from urban to rural locations where inventory was scarce, an increased desire to live alone, and a need for increased space to accommodate work-from-home arrangements.
That being said, we ask the following provocative question: should monetary policy be based on a price that two out of three households are not paying. ... The Harmonized Index of Consumer Prices (HIPC) [that] was created to mimic how inflation is estimated in Europe, which excludes OER from its price index due to disagreement over how to estimate owner-occupied housing costs. While headline CPI inflation was up 3.2% y/y through February and headline PCE inflation was up 2.4% through January (February data has not been released yet), where was HICP inflation? HICP inflation was up only 2.2%.
I've written extensively about the surge in household formation during the pandemic (mostly due to work from home), how and why asking rents are mostly flat year-over-year, and why I think OER should mostly be ignored right now by the Fed (monetary policy cannot impact the past).
Where would the Fed’s confidence to cut be if it saw inflation at 2.2%? We think most certainly higher.
With the February CPI report, I noted: "Rent and Owner's equivalent rent are still very high, and if we exclude rent, median CPI would be around 1.8% year-over-year." Core CPI ex-shelter was up 2.2% YoY in February, unchanged from 2.2% in January.
NAR: Existing-Home Sales Increased to 4.38 million SAAR in February; Median Prices Down 7.1 From Peak (NSA)
by Calculated Risk on 3/21/2024 10:40:00 AM
Today, in the CalculatedRisk Real Estate Newsletter: NAR: Existing-Home Sales Increased to 4.38 million SAAR in February
Excerpt:
Sales Year-over-Year and Not Seasonally Adjusted (NSA)There is much more in the article.
The fourth graph shows existing home sales by month for 2023 and 2024.
Sales declined 3.3% year-over-year compared to February 2023. This was the thirtieth consecutive month with sales down year-over-year. Be careful with February sales - the seasonal factor plays a role in boosting sales.

NAR: Existing-Home Sales Increased to 4.38 million SAAR in February
by Calculated Risk on 3/21/2024 10:00:00 AM
From the NAR: Existing-Home Sales Vaulted 9.5% in February, Largest Monthly Increase in a Year
Existing-home sales climbed in February, according to the National Association of REALTORS®. Among the four major U.S. regions, sales jumped in the West, South and Midwest, and were unchanged in the Northeast. Year-over-year, sales declined in all regions.
Total existing-home sales– completed transactions that include single-family homes, townhomes, condominiums and co-ops – bounced 9.5% from January to a seasonally adjusted annual rate of 4.38 million in February. Year-over-year, sales slid 3.3% (down from 4.53 million in February 2023).
...
Total housing inventory registered at the end of February was 1.07 million units, up 5.9% from January and 10.3% from one year ago (970,000). Unsold inventory sits at a 2.9-month supply at the current sales pace, down from 3.0 months in January but up from 2.6 months in February 2023.
emphasis added
 Click on graph for larger image.
This graph shows existing home sales, on a Seasonally Adjusted Annual Rate (SAAR) basis since 1994.
Sales in February (4.38 million SAAR) were up 9.5% from the previous month and were 3.3% below the February 2023 sales rate.
The second graph shows nationwide inventory for existing homes.
 According to the NAR, inventory increased to 1.07 million in February from 1.01 million the previous month.
 According to the NAR, inventory increased to 1.07 million in February from 1.01 million the previous month.
Headline inventory is not seasonally adjusted, and inventory usually decreases to the seasonal lows in December and January, and peaks in mid-to-late summer.
The last graph shows the year-over-year (YoY) change in reported existing home inventory and months-of-supply. Since inventory is not seasonally adjusted, it really helps to look at the YoY change. Note: Months-of-supply is based on the seasonally adjusted sales and not seasonally adjusted inventory.
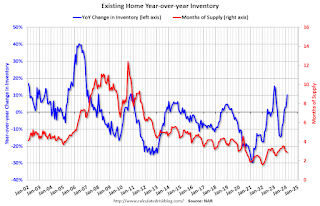 Inventory was up 10.3% year-over-year (blue) in February compared to February 2023.
Months of supply (red) decreased to 2.9 months in February from 3.0 months the previous month.
This was above the consensus forecast (but at Tom Lawler's estimate). I'll have more later.
The last graph shows the year-over-year (YoY) change in reported existing home inventory and months-of-supply. Since inventory is not seasonally adjusted, it really helps to look at the YoY change. Note: Months-of-supply is based on the seasonally adjusted sales and not seasonally adjusted inventory.
 Inventory was up 10.3% year-over-year (blue) in February compared to February 2023.
 Months of supply (red) decreased to 2.9 months in February from 3.0 months the previous month.
This was above the consensus forecast (but at Tom Lawler's estimate). I'll have more later.
Weekly Initial Unemployment Claims Decrease to 210,000
by Calculated Risk on 3/21/2024 08:30:00 AM
The DOL reported:
In the week ending March 16, the advance figure for seasonally adjusted initial claims was 210,000, a decrease of 2,000 from the previous week's revised level. The previous week's level was revised up by 3,000 from 209,000 to 212,000. The 4-week moving average was 211,250, an increase of 2,500 from the previous week's revised average. The previous week's average was revised up by 750 from 208,000 to 208,750.The following graph shows the 4-week moving average of weekly claims since 1971.
emphasis added
 Click on graph for larger image.
The dashed line on the graph is the current 4-week average. The four-week average of weekly unemployment claims increased to 211,250.
The previous week was revised up.
Weekly claims were close to the consensus forecast.
Wednesday, March 20, 2024
Thursday: Unemployment Claims, Existing Home Sales
by Calculated Risk on 3/20/2024 07:54:00 PM
 Note: Mortgage rates are from MortgageNewsDaily.com and are for top tier scenarios.
Thursday:
• At 8:30 AM ET, The initial weekly unemployment claims report will be released. The consensus is for 212 thousand initial claims, up from 209 thousand last week.
• Also at 8:30 AM, the Philly Fed manufacturing survey for March. The consensus is for a reading of -2.5, down from 5.2.
• At 10:00 AM: Existing Home Sales for February from the National Association of Realtors (NAR). The consensus is for 3.94 million SAAR, down from 4.00 million. Housing economist Tom Lawler expects the NAR to report sales of 4.40 million SAAR for February (well above consensus).
FOMC Projections and Press Conference
by Calculated Risk on 3/20/2024 02:10:00 PM
Statement here.
Fed Chair Powell press conference video here or on YouTube here, starting at 2:30 PM ET.
Here are the projections. Since the last projections were released, the economy has performed close to FOMC expectations.
In December, the FOMC participants’ midpoint of the target level for the federal funds rate was at 4.675% at the end of 2024. The FOMC participants’ midpoint of the target range is now at 4.675% at the end of 2024.
Market participants expects the target range to be between 4.5% and 4.75% at the end of 2024.
1 Projections of change in real GDP and inflation are from the fourth quarter of the previous year to the fourth quarter of the year indicated.
The unemployment rate was at 3.9% in February and the projections for Q4 2024 were down slightly.
2 Projections for the unemployment rate are for the average civilian unemployment rate in the fourth quarter of the year indicated.
As of January 2024, PCE inflation increased 2.4 percent year-over-year (YoY). The projections for PCE inflation were revised up slightly.
PCE core inflation increased 2.8 percent YoY in January. The projections for core PCE inflation were revised up slightly.
Early estimates for Q1 GDP are around 2% annualized, and the FOMC projections for year-over-year growth in Q4 2024 were revised up.
| GDP projections of Federal Reserve Governors and Reserve Bank presidents, Change in Real GDP1 | ||||
|---|---|---|---|---|
| Projection Date | 2024 | 2025 | 2026 | |
| Mar 2024 | 2.0 to 2.4 | 1.9 to 2.3 | 1.8 to 2.1 | |
| Dec 2023 | 1.2 to 1.7 | 1.5 to 2.0 | 1.8 to 2.0 | |
The unemployment rate was at 3.9% in February and the projections for Q4 2024 were down slightly.
| Unemployment projections of Federal Reserve Governors and Reserve Bank presidents, Unemployment Rate2 | ||||
|---|---|---|---|---|
| Projection Date | 2024 | 2025 | 2026 | |
| Mar 2024 | 3.9 to 4.1 | 3.9 to 4.2 | 3.9 to 4.3 | |
| Dec 2023 | 4.0 to 4.2 | 4.0 to 4.2 | 3.9 to 4.3 | |
As of January 2024, PCE inflation increased 2.4 percent year-over-year (YoY). The projections for PCE inflation were revised up slightly.
| Inflation projections of Federal Reserve Governors and Reserve Bank presidents, PCE Inflation1 | ||||
|---|---|---|---|---|
| Projection Date | 2024 | 2025 | 2026 | |
| Mar 2024 | 2.3 to 2.7 | 2.1 to 2.2 | 2.0 to 2.1 | |
| Dec 2023 | 2.2 to 2.5 | 2.0 to 2.2 | 2.0 | |
PCE core inflation increased 2.8 percent YoY in January. The projections for core PCE inflation were revised up slightly.
Over the last 6 months, the PCE Price Index increase 2.5% annualized, the core PCE price index increased at a 2.5% annual rate. However, core PCE minus Housing increased at a 1.8% annualized rate suggesting that 2024 projections are too high.
| Core Inflation projections of Federal Reserve Governors and Reserve Bank presidents, Core Inflation1 | ||||
|---|---|---|---|---|
| Projection Date | 2024 | 2025 | 2026 | |
| Mar 2024 | 2.5 to 2.8 | 2.1 to 2.3 | 2.0 to 2.1 | |
| Dec 2023 | 2.4 to 2.7 | 2.0 to 2.2 | 2.0 to 2.1 | |
FOMC Statement: No Change to Policy
by Calculated Risk on 3/20/2024 02:00:00 PM
Recent indicators suggest that economic activity has been expanding at a solid pace. Job gains have remained strong, and the unemployment rate has remained low. Inflation has eased over the past year but remains elevated.
The Committee seeks to achieve maximum employment and inflation at the rate of 2 percent over the longer run. The Committee judges that the risks to achieving its employment and inflation goals are moving into better balance. The economic outlook is uncertain, and the Committee remains highly attentive to inflation risks.
In support of its goals, the Committee decided to maintain the target range for the federal funds rate at 5-1/4 to 5-1/2 percent. In considering any adjustments to the target range for the federal funds rate, the Committee will carefully assess incoming data, the evolving outlook, and the balance of risks. The Committee does not expect it will be appropriate to reduce the target range until it has gained greater confidence that inflation is moving sustainably toward 2 percent. In addition, the Committee will continue reducing its holdings of Treasury securities and agency debt and agency mortgage-backed securities, as described in its previously announced plans. The Committee is strongly committed to returning inflation to its 2 percent objective.
In assessing the appropriate stance of monetary policy, the Committee will continue to monitor the implications of incoming information for the economic outlook. The Committee would be prepared to adjust the stance of monetary policy as appropriate if risks emerge that could impede the attainment of the Committee's goals. The Committee's assessments will take into account a wide range of information, including readings on labor market conditions, inflation pressures and inflation expectations, and financial and international developments.
Voting for the monetary policy action were Jerome H. Powell, Chair; John C. Williams, Vice Chair; Thomas I. Barkin; Michael S. Barr; Raphael W. Bostic; Michelle W. Bowman; Lisa D. Cook; Mary C. Daly; Philip N. Jefferson; Adriana D. Kugler; Loretta J. Mester; and Christopher J. Waller.
emphasis added


