 RSS Feed
 by Calculated Risk on 3/20/2024 10:11:00 AM
Wednesday, March 20, 2024
AIA: "Moderation in the Slowdown in Business Conditions at Architecture Firms"; Multi-family Billings Decline for 19th Consecutive Month
Note: This index is a leading indicator primarily for new Commercial Real Estate (CRE) investment.
From the AIA: AIA/Deltek ABI Reports Moderation in the Slowdown in Business Conditions at Architecture Firms in February
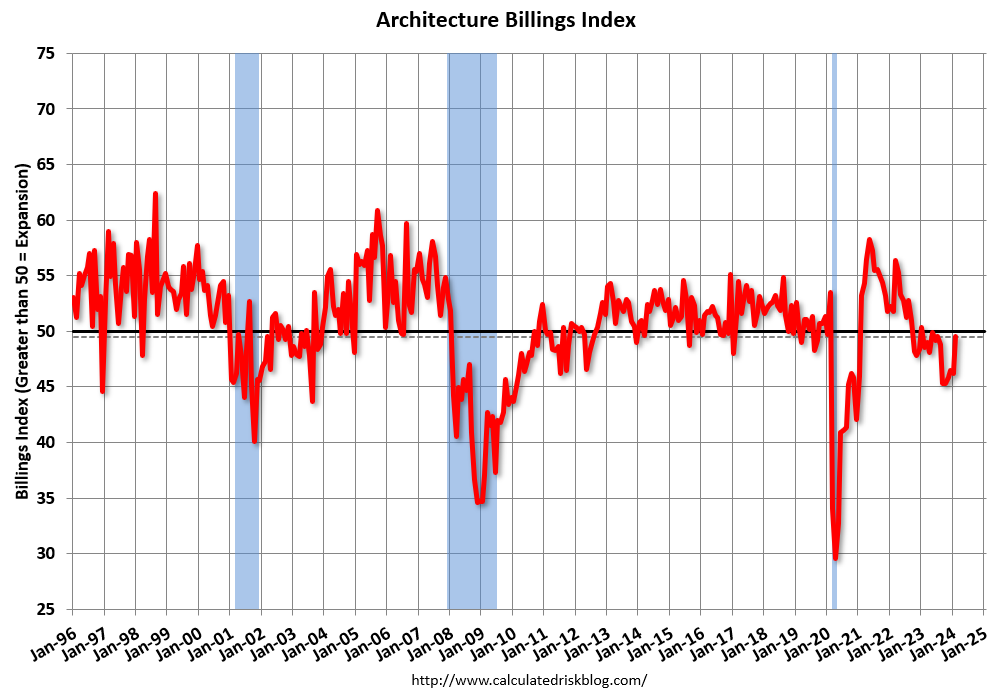
Architecture firm billings continued to decline in February, with an AIA/Deltek Architecture Billings Index (ABI) score of 49.5 for the month. However, February’s score marks the most modest easing in billings since July 2023 and suggests that the recent slowdown may be receding.• Northeast (44.0); Midwest (50.8); South (47.7); West (47.2)
“There are indicators this month that business conditions at firms may finally begin to pick up in the coming months. Inquiries into new projects grew at their fastest pace since November, and the value of newly signed design contracts increased at their fastest pace since last summer,” said Kermit Baker, PhD, AIA Chief Economist." Given the moderation of inflation for construction costs and prospects for lower interest rates in the coming months, there are positive signs for future growth.”
The Midwest as a region is still reporting billings growth, despite business conditions remaining weak across the country in February. Firms located in the Midwest reported growth for the last three months, and for four of the last five months.
The ABI score is a leading economic indicator of construction activity, providing an approximately nine-to-twelve-month glimpse into the future of nonresidential construction spending activity. The score is derived from a monthly survey of architecture firms that measures the change in the number of services provided to clients.
emphasis added
• Sector index breakdown: commercial/industrial (46.1); institutional (50.7); mixed practice (firms that do not have at least half of their billings in any one other category) (47.1); multifamily residential (44.9)
 Click on graph for larger image.
This graph shows the Architecture Billings Index since 1996. The index was at 49.5 in February, up from 46.2 in January. Anything below 50 indicates a decrease in demand for architects' services.
Note: This includes commercial and industrial facilities like hotels and office buildings, multi-family residential, as well as schools, hospitals and other institutions.
This index usually leads CRE investment by 9 to 12 months, so this index suggests a slowdown in CRE investment in 2024.
Note that multi-family billing turned down in August 2022 and has been negative for nineteen consecutive months (with revisions). This suggests we will see a further weakness in multi-family starts.
MBA: Mortgage Applications Decreased in Weekly Survey
by Calculated Risk on 3/20/2024 07:00:00 AM
From the MBA: Mortgage Applications Decrease in Latest MBA Weekly Survey
Mortgage applications decreased 1.6 percent from one week earlier, according to data from the Mortgage Bankers Association’s (MBA) Weekly Mortgage Applications Survey for the week ending March 15, 2024.
The Market Composite Index, a measure of mortgage loan application volume, decreased 1.6 percent on a seasonally adjusted basis from one week earlier. On an unadjusted basis, the Index decreased 1 percent compared with the previous week. The Refinance Index decreased 3 percent from the previous week and was 3 percent lower than the same week one year ago. The seasonally adjusted Purchase Index decreased 1 percent from one week earlier. The unadjusted Purchase Index decreased 1 percent compared with the previous week and was 14 percent lower than the same week one year ago.
“Mortgage rates increased last week as incoming data showed inflation was still hotter than expected, which stoked concerns about the timing and extent to which the Fed might be able to reduce the fed funds rates this year. After three weeks of declines, the 30-year fixed mortgage rate increased to 6.97 percent,” said Joel Kan, MBA’s Vice President and Deputy Chief Economist. “Mortgage applications continued to show sensitivity to rate movements, and both purchase and refinance activity decreased over the week. With housing supply low and prices high, the average loan size for purchase applications increased to the highest level since May 2022.”
...
The average contract interest rate for 30-year fixed-rate mortgages with conforming loan balances ($766,550 or less) increased to 6.97 percent from 6.84 percent, with points decreasing to 0.64 from 0.65 (including the origination fee) for 80 percent loan-to-value ratio (LTV) loans.
emphasis added
 Click on graph for larger image.
The first graph shows the MBA mortgage purchase index.
According to the MBA, purchase activity is down 14% year-over-year unadjusted.
Red is a four-week average (blue is weekly).
Purchase application activity is up slightly from the lows in late October 2023, and below the lowest levels during the housing bust.

The second graph shows the refinance index since 1990.
With higher mortgage rates, the refinance index declined sharply in 2022, and has mostly flatlined since then.
Tuesday, March 19, 2024
Wednesday: FOMC Statement
by Calculated Risk on 3/19/2024 07:52:00 PM
 Note: Mortgage rates are from MortgageNewsDaily.com and are for top tier scenarios.
Wednesday:
• At 7:00 AM ET, The Mortgage Bankers Association (MBA) will release the results for the mortgage purchase applications index.
• During the day, The AIA's Architecture Billings Index for February (a leading indicator for commercial real estate).
• At 2:00 PM, FOMC Meeting Announcement. No change to policy is expected at this meeting.
• At 2:00 PM, FOMC Projections. This will include the Federal Open Market Committee (FOMC) participants' projections of the appropriate target federal funds rate along with updated economic projections.
• At 2:30 PM, Fed Chair Jerome Powell holds a press briefing following the FOMC announcement.
California February Existing Home Sales increase 1.3% YoY, Prices up 9.7% YoY
by Calculated Risk on 3/19/2024 01:40:00 PM
Today, in the Calculated Risk Real Estate Newsletter: California February Existing Home Sales increase 1.3% YoY, Prices up 9.7% YoY
A brief excerpt:
February’s sales pace jumped 12.8 percent higher from the revised 257,040 homes sold in January and rose 1.3 percent from a year ago, when a revised 286,290 homes were sold on an annualized basis.
...
The statewide median price recorded a strong year-over-year gain in February, gaining 9.7 percent from $735,300 in February 2023 to $806,490 in February 2024.
Single Family Starts Up 35% Year-over-year in February; Multi-Family Starts Down Sharply
by Calculated Risk on 3/19/2024 10:12:00 AM
Today, in the Calculated Risk Real Estate Newsletter: Single Family Starts Up 35% Year-over-year in February; Multi-Family Starts Down Sharply
A brief excerpt:
Total housing starts in February were above expectations and starts in December and January were revised up.
Last month, I noted that permits held up better than starts in January, and that housing starts were impacted by the severe weather in January. For February, permits and starts were at about the same level.
The third graph shows the month-to-month comparison for total starts between 2023 (blue) and 2024 (red).
Total starts were up 5.9% in February compared to February 2023.
Starts were up year-over-year for the third consecutive month, after being down year-over-year for 16 of the previous 18 months.

Housing Starts Increased to 1.521 million Annual Rate in February
by Calculated Risk on 3/19/2024 08:30:00 AM
From the Census Bureau: Permits, Starts and Completions
Housing Starts:
Privately‐owned housing starts in February were at a seasonally adjusted annual rate of 1,521,000. This is 10.7 percent above the revised January estimate of 1,374,000 and is 5.9 percent above the February 2023 rate of 1,436,000. Single‐family housing starts in February were at a rate of 1,129,000; this is 11.6 percent above the revised January figure of 1,012,000. The February rate for units in buildings with five units or more was 377,000.
Building Permits:
Privately‐owned housing units authorized by building permits in February were at a seasonally adjusted annual rate of 1,518,000. This is 1.9 percent above the revised January rate of 1,489,000 and is 2.4 percent above the February 2023 rate of 1,482,000. Single‐family authorizations in February were at a rate of 1,031,000; this is 1.0 percent above the revised January figure of 1,021,000. Authorizations of units in buildings with five units or more were at a rate of 429,000 in February.
emphasis added
 Click on graph for larger image.
The first graph shows single and multi-family housing starts since 2000.
Multi-family starts (blue, 2+ units) increased in February compared to January. Multi-family starts were down 34.8% year-over-year in February.
Single-family starts (red) increased in February and were up 35.2% year-over-year.
 The second graph shows single and multi-family housing starts since 1968.
 This shows the huge collapse following the housing bubble, and then the eventual recovery - and the recent collapse and recovery in single-family starts.
Total housing starts in February were above expectations and starts in December and January were revised up.
I'll have more later …
Monday, March 18, 2024
"The Lock-In Effect of Rising Mortgage Rates"
by Calculated Risk on 3/18/2024 08:19:00 PM
Today, in the Calculated Risk Real Estate Newsletter: "The Lock-In Effect of Rising Mortgage Rates"
A brief excerpt:
Here is new working paper from Federal Housing Finance Agency (FHFA) staff Ross M. Batzer Jonah R. Coste William M. Doerner Michael J. Seiler quantifying the impact of the “lock-in effect”: The Lock-In Effect of Rising Mortgage RatesThere is much more in the article.
And here is their conclusion:This paper finds that for every percentage point that market mortgage rates exceed the origination interest rate, the probability of sale is decreased by 18.1%. This mortgage rate lock-in led to a 57% reduction in home sales with fixed-rate mortgages in 2023Q4 and prevented 1.33 million sales between 2022Q2 and 2023Q4. The supply reduction increased home prices by 5.7%, outweighing the direct impact of elevated rates, which decreased prices by 3.3%. These findings underscore how mortgage rate lock-in restricts mobility, results in people not living in homes they would prefer, inflates prices, and worsens affordability.
emphasis added
Tuesday: Housing Starts
by Calculated Risk on 3/18/2024 07:24:00 PM
 From Matthew Graham at Mortgage News Daily: Mortgage Rates Inch to March Highs
Rates marched higher to the highest levels in March today, but most lenders are only microscopically worse off than Friday afternoon. In the slightly bigger picture rates have moved up roughly a quarter of a percent in just over a week and that's a relatively quick move.Tuesday:
...
We already know the Fed will not be cutting rates. We don't know how they'll adjust their rate outlook for the rest of the year. [30 year fixed 7.11%]
emphasis added
• At 8:30 AM ET, Housing Starts for February. The consensus is for 1.435 million SAAR, up from 1.331 million SAAR.
MBA Survey: Share of Mortgage Loans in Forbearance Holds Steady at 0.22% in February
by Calculated Risk on 3/18/2024 04:23:00 PM
From the MBA: Share of Mortgage Loans in Forbearance Holds Steady at 0.22% in February
The Mortgage Bankers Association’s (MBA) monthly Loan Monitoring Survey revealed that the total number of loans now in forbearance remained unchanged at 0.22% as of February 29, 2024. According to MBA’s estimate, 110,000 homeowners are in forbearance plans. Mortgage servicers have provided forbearance to approximately 8.1 million borrowers since March 2020.At the end of February, there were about 110,000 homeowners in forbearance plans.
In February 2024, the share of Fannie Mae and Freddie Mac loans in forbearance declined 1 basis point to 0.12%. Ginnie Mae loans in forbearance increased by 1 basis point to 0.40%, and the forbearance share for portfolio loans and private-label securities (PLS) increased 1 basis point to 0.29%.
“The performance of servicing portfolios and loan workouts improved in February, as borrowers benefitted from tax refunds, the extra day in the month to submit their payments, and continued resilience in the job market,” said Marina Walsh, CMB, MBA’s Vice President of Industry Analysis. “Only around 110,000 loans nationwide remain in a forbearance plan, with little movement this month. The pandemic’s impact has waned, with only 16 percent of borrowers in forbearance because of COVID-19, compared to 72 percent for temporary personal hardships and 12 percent for natural disasters.”
emphasis added
LA Port Traffic Increased Sharply Year-over-year in February
by Calculated Risk on 3/18/2024 01:51:00 PM
Container traffic gives us an idea about the volume of goods being exported and imported - and usually some hints about the trade report since LA area ports handle about 40% of the nation's container port traffic.
The following graphs are for inbound and outbound traffic at the ports of Los Angeles and Long Beach in TEUs (TEUs: 20-foot equivalent units or 20-foot-long cargo container).
To remove the strong seasonal component for inbound traffic, the first graph shows the rolling 12-month average.
 Click on graph for larger image.
On a rolling 12-month basis, inbound traffic increased 2.8% in February compared to the rolling 12 months ending in January. Outbound traffic increased 1.0% compared to the rolling 12 months ending the previous month.
The 2nd graph is the monthly data (with a strong seasonal pattern for imports).
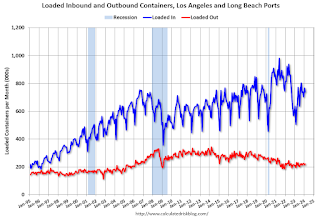 Usually imports peak in the July to October period as retailers import goods for the Christmas holiday, and then decline sharply and bottom in the Winter depending on the timing of the Chinese New Year.
 Usually imports peak in the July to October period as retailers import goods for the Christmas holiday, and then decline sharply and bottom in the Winter depending on the timing of the Chinese New Year.
 Imports were up 46% YoY in February, and exports were up 14% YoY. There is usually a dip in the new year depending on the timing of the Chinese New Year, but that didn't happen this year.
In general, it appears port traffic is returning to the pre-pandemic patterns.


