 RSS Feed
 by Calculated Risk on 3/18/2024 01:51:00 PM
Monday, March 18, 2024
LA Port Traffic Increased Sharply Year-over-year in February
Container traffic gives us an idea about the volume of goods being exported and imported - and usually some hints about the trade report since LA area ports handle about 40% of the nation's container port traffic.
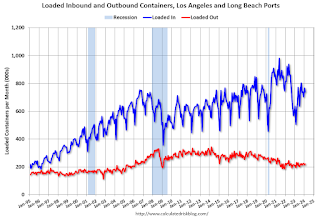
The following graphs are for inbound and outbound traffic at the ports of Los Angeles and Long Beach in TEUs (TEUs: 20-foot equivalent units or 20-foot-long cargo container).
To remove the strong seasonal component for inbound traffic, the first graph shows the rolling 12-month average.
 Click on graph for larger image.
On a rolling 12-month basis, inbound traffic increased 2.8% in February compared to the rolling 12 months ending in January. Outbound traffic increased 1.0% compared to the rolling 12 months ending the previous month.
The 2nd graph is the monthly data (with a strong seasonal pattern for imports).
 Usually imports peak in the July to October period as retailers import goods for the Christmas holiday, and then decline sharply and bottom in the Winter depending on the timing of the Chinese New Year.
 Usually imports peak in the July to October period as retailers import goods for the Christmas holiday, and then decline sharply and bottom in the Winter depending on the timing of the Chinese New Year.
 Imports were up 46% YoY in February, and exports were up 14% YoY. There is usually a dip in the new year depending on the timing of the Chinese New Year, but that didn't happen this year.
In general, it appears port traffic is returning to the pre-pandemic patterns.


