 RSS Feed
 by Calculated Risk on 6/05/2023 12:52:00 PM
Monday, June 05, 2023
ISM® Services Index Decreases to 50.3% in May
(Posted with permission). The ISM® Services index was at 50.3%, down from 51.9% last month. The employment index decreased to 49.2%, from 50.8%. Note: Above 50 indicates expansion, below 50 in contraction.
From the Institute for Supply Management: Services PMI® at 50.3% May 2023 Services ISM® Report On Business®
Economic activity in the services sector expanded in May for the fifth consecutive month as the Services PMI® registered 50.3 percent, say the nation's purchasing and supply executives in the latest Services ISM® Report On Business®. The sector has grown in 35 of the last 36 months, with the lone contraction in December of last year.The PMI was below expectations.
The report was issued today by Anthony Nieves, CPSM, C.P.M., A.P.P., CFPM, Chair of the Institute for Supply Management® (ISM®) Services Business Survey Committee: “In May, the Services PMI® registered 50.3 percent, 1.6 percentage points lower than April’s reading of 51.9 percent. The composite index indicated growth in May for the fifth consecutive month after a reading of 49.2 percent in December, which was the first contraction since May 2020 (45.4 percent). The Business Activity Index registered 51.5 percent, a 0.5-percentage point decrease compared to the reading of 52 percent in April. The New Orders Index expanded in May for the fifth consecutive month after contracting in December for the first time since May 2020; the figure of 52.9 percent is 3.2 percentage points lower than the April reading of 56.1 percent.
“The Supplier Deliveries registered 47.7 percent, 0.9 percentage point lower than the 48.6 percent recorded in April. In the last six months, the average reading of 48.0 percent (with a low of 45.8 percent in March) reflects the fastest supplier delivery performance since June 2009, when the index registered 46 percent. (Supplier Deliveries is the only ISM® Report On Business® index that is inversed; a reading of above 50 percent indicates slower deliveries, which is typical as the economy improves and customer demand increases.)
“The Prices Index was down 3.4 percentage points in May, to 56.2 percent. The Inventories Index expanded in May after a month of contraction and two previous months of growth, preceded by eight straight months of contraction; the reading of 58.3 percent is up 11.1 percentage points from April’s figure of 47.2 percent. The Inventory Sentiment Index (61 percent, up 12.1 percentage points from April’s reading of 48.9 percent) expanded after a month of contraction preceded by four months of growth, with a four-month period of contraction before that. The Backlog of Orders Index registered 40.9 percent, an 8.8-percentage point decrease compared to the April figure of 49.7 percent and the index’s lowest reading since May 2009 (40 percent).
emphasis added
Black Knight Mortgage Monitor: Home Prices Increased Month-to-month in April; Prices Unchanged YoY
by Calculated Risk on 6/05/2023 11:00:00 AM
Today, in the Calculated Risk Real Estate Newsletter: Black Knight Mortgage Monitor: Home Prices Increased Month-to-month in April; Prices Unchanged YoY
A brief excerpt:
Note: The Black Knight House Price Index (HPI) is a repeat sales index. Black Knight reports the median price change of the repeat sales.There is much more in the article. You can subscribe at https://calculatedrisk.substack.com/
Here is a graph of the Black Knight HPI. The index is still up 1.0% year-over-year and will likely turn negative YoY soon.
• April’s 0.46% seasonally adjusted rise was down from March’s revised +0.62% and roughly on par with the 0.49% rise in February
• April’s seasonally adjusted increase was near the 30-year average of 0.48% for the month – 5.5% annualized
• Despite prices firming up this spring, the annual home price growth rate slipped to 0% in April, the first-time prices have been flat year over year since the rebound from the Great Financial Crisis began in 2012
• At its current trajectory, the annual home price growth rate would only fall modestly below 0% for a very short time before pulling back above water by late Q2/early Q3
emphasis added

Housing June 5th Weekly Update: Inventory Increased 0.7% Week-over-week
by Calculated Risk on 6/05/2023 08:21:00 AM
Altos reports that active single-family inventory was up 0.7% week-over-week.
 Click on graph for larger image.
This inventory graph is courtesy of Altos Research.
As of June 2nd, inventory was at 436 thousand (7-day average), compared to 433 thousand the prior week.
Year-to-date, inventory is down 11.1%. And inventory is up 7.6% from the seasonal bottom seven weeks ago.

The red line is for 2023. The black line is for 2019. Note that inventory is up from the previous two years (the record low was in 2022), but still well below normal levels.
Inventory was up 18.4% compared to the same week in 2022 (last week it was up 21.1%), and down 53.7% compared to the same week in 2019 (last week down 53.5%).
It appears likely inventory will be down year-over-year in late June or early July.
Mike Simonsen discusses this data regularly on Youtube.
Sunday, June 04, 2023
Sunday Night Futures
by Calculated Risk on 6/04/2023 07:15:00 PM
Weekend:
• Schedule for Week of June 4, 2023
Monday:
• At 10:00 AM ET, the ISM Services Index for May. The consensus is for a reading of 52.5, up from 51.9.
From CNBC: Pre-Market Data and Bloomberg futures S&P 500 are up 3 and DOW futures are up 70 (fair value).
Oil prices were down over the last week with WTI futures at $71.74 per barrel and Brent at $76.13 per barrel. A year ago, WTI was at $119, and Brent was at $126 - so WTI oil prices are down about 40% year-over-year.
Here is a graph from Gasbuddy.com for nationwide gasoline prices. Nationally prices are at $3.52 per gallon. A year ago, prices were at $4.82 per gallon, so gasoline prices are down $1.30 per gallon year-over-year.
Hotels: Occupancy Rate Up 0.6% Year-over-year
by Calculated Risk on 6/04/2023 03:01:00 PM
As expected ahead of Memorial Day, U.S. hotel performance decreased from the previous week, according to STR‘s latest data through 27 May. Year-over-year comparisons were improved.The following graph shows the seasonal pattern for the hotel occupancy rate using the four-week average.
21-27 May 2023 (percentage change from comparable week in 2022):
• Occupancy: 66.8% (+0.6%)
• Average daily rate (ADR): US$156.63 (+2.2%)
• Revenue per available room (RevPAR): US$104.62 (+2.9%)
emphasis added
 Click on graph for larger image.
The red line is for 2023, black is 2020, blue is the median, and dashed light blue is for 2022. Dashed purple is for 2018, the record year for hotel occupancy.
The 4-week average of the occupancy rate is slightly above the median rate for the period 2000 through 2022 (Blue).
Note: Y-axis doesn't start at zero to better show the seasonal change.
The 4-week average of the occupancy rate will increase during the summer travel season.
Realtor.com Reports Weekly Active Inventory Up 18% YoY; New Listings Down 20% YoY
by Calculated Risk on 6/04/2023 08:11:00 AM
Realtor.com has monthly and weekly data on the existing home market. Here is their weekly report from economist Jiayi Xu: Weekly Housing Trends View — Data Week Ending May 27, 2023
• Active inventory growth slowed again, with for-sale homes up just 18% above one year ago. The number of homes for sale continues to grow, but compared to one year ago, the pace is slowing. As we have discussed previously, further slowing is likely ahead. Due to the limited housing inventory, many buyers have turned their attention towards newly constructed homes.
...
• New listings–a measure of sellers putting homes up for sale–were down again this week, by 20% from one year ago. The number of newly listed homes has been lower than the same time the previous year for the past 47 weeks. This week’s gap was smaller than last two weeks’, but the lack of new sellers is still a drag on home sales. In fact, this trend holds for all four regions in May, and the West saw the most significant decline in listing activities. Existing homeowners, benefiting from mortgage rates considerably lower than current rates, are reluctant to list their properties, leading to a lag in new listings.
 Here is a graph of the year-over-year change in inventory according to realtor.com.
 Inventory is still up year-over-year - from record lows - however, the YoY increase has slowed sharply recently.
This was the smallest YoY increase since June 2022.
The recent trend suggests active inventory could be down YoY in late June or July!
Saturday, June 03, 2023
Real Estate Newsletter Articles this Week: Case-Shiller National House Price Index Increased 0.7% year-over-year in March
by Calculated Risk on 6/03/2023 02:11:00 PM
At the Calculated Risk Real Estate Newsletter this week:
• Case-Shiller: National House Price Index Increased 0.7% year-over-year in March
• Inflation Adjusted House Prices 4.2% Below Peak
• Freddie Mac House Price Index Increased Slightly in April; Up 0.3% Year-over-year
• Lawler: Census Finally Releases 2020 Census Demographic Profile and Demographic and Housing Characteristics File
• Year-over-year Rent Growth Continues to Decelerate
This is usually published 4 to 6 times a week and provides more in-depth analysis of the housing market.
You can subscribe at https://calculatedrisk.substack.com/
Most content is available for free (and no Ads), but please subscribe!
Schedule for Week of June 4, 2023
by Calculated Risk on 6/03/2023 08:11:00 AM
The key report scheduled for this week is the April trade balance.
10:00 AM: the ISM Services Index for May. The consensus is for a reading of 52.5, up from 51.9.
8:00 AM ET: CoreLogic House Price index for April.
7:00 AM ET: The Mortgage Bankers Association (MBA) will release the results for the mortgage purchase applications index.
 8:30 AM: Trade Balance report for April from the Census Bureau.
 This graph shows the U.S. trade deficit, with and without petroleum.
The blue line is the total deficit, and the black line is the petroleum surplus, and the red line is the trade deficit ex-petroleum products.
The consensus is the trade deficit to be $75.4 billion. The U.S. trade deficit was at $64.2 Billion in March.
----- Thursday, June 8th -----
8:30 AM: The initial weekly unemployment claims report will be released. The consensus is for 238 thousand initial claims, up from 232 thousand last week.
12:00 PM: Q1 Flow of Funds Accounts of the United States from the Federal Reserve.
----- Friday, June 9th -----
No major economic releases scheduled.
The consensus is the trade deficit to be $75.4 billion. The U.S. trade deficit was at $64.2 Billion in March.
8:30 AM: The initial weekly unemployment claims report will be released. The consensus is for 238 thousand initial claims, up from 232 thousand last week.
12:00 PM: Q1 Flow of Funds Accounts of the United States from the Federal Reserve.
No major economic releases scheduled.
Friday, June 02, 2023
June 2nd COVID Update: New Pandemic Lows for Deaths and Hospitalizations
by Calculated Risk on 6/02/2023 09:10:00 PM
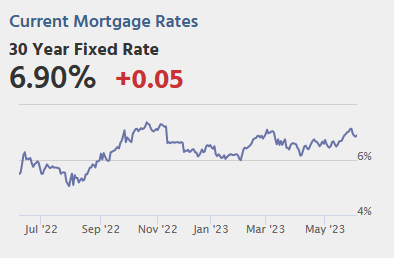 Note: Mortgage rates are from MortgageNewsDaily.com and are for top tier scenarios.
Due to changes at the CDC, weekly cases are no longer updated.
After the first few weeks, the pandemic low for weekly deaths had been the week of July 7, 2021, at 1,690 deaths (until recently).
For COVID hospitalizations, the previous low was 9,821 (until five weeks ago).
| COVID Metrics | ||||
|---|---|---|---|---|
| Now | Week Ago | Goal | ||
| Hospitalized2 | 6,942 | 7,544 | ≤3,0001 | |
| Deaths per Week2 | 684 | 849 | ≤3501 | |
| 1my goals to stop weekly posts, 2Weekly for Currently Hospitalized, and Deaths 🚩 Increasing number weekly for Hospitalized and Deaths ✅ Goal met. | ||||
 Click on graph for larger image.
This graph shows the weekly (columns) number of deaths reported.
For deaths, I'm currently using 3 weeks ago for "now", since the most recent two weeks will be revised significantly.
Heavy Truck Sales Up Sharply Year-over-year in May
by Calculated Risk on 6/02/2023 03:08:00 PM
The BEA released their estimate of vehicle sales for May this morning.
This graph shows heavy truck sales since 1967 using data from the BEA. The dashed line is the May 2023 seasonally adjusted annual sales rate (SAAR).
Heavy truck sales really collapsed during the great recession, falling to a low of 180 thousand SAAR in May 2009. Then heavy truck sales increased to a new all-time high of 570 thousand SAAR in April 2019.
 Click on graph for larger image.
Note: "Heavy trucks - trucks more than 14,000 pounds gross vehicle weight."
Heavy truck sales declined sharply at the beginning of the pandemic, falling to a low of 308 thousand SAAR in May 2020.
Heavy truck sales were at 558 thousand SAAR in May, up from 548 thousand in April, and up 20% from 464 thousand SAAR in May 2022.
Usually, heavy truck sales decline sharply prior to a recession. Sales were strong in May.


