 RSS Feed
 by Calculated Risk on 5/16/2023 09:01:00 PM
Tuesday, May 16, 2023
Wednesday: Housing Starts
 Note: Mortgage rates are from MortgageNewsDaily.com and are for top tier scenarios.
Wednesday:
• At 7:00 AM ET, The Mortgage Bankers Association (MBA) will release the results for the mortgage purchase applications index.
• At 8:30 AM, Housing Starts for April. The consensus is for 1.396 million SAAR, down from 1.420 million SAAR in March.
Lawler: Early Read on Existing Home Sales in April
by Calculated Risk on 5/16/2023 01:10:00 PM
Today, in the Calculated Risk Real Estate Newsletter: Lawler: Early Read on Existing Home Sales in April
A brief excerpt:
From housing economist Tom Lawler:There is more in the article. You can subscribe at https://calculatedrisk.substack.com/
Based on publicly-available local realtor/MLS reports released across the country through today, I project that existing home sales as estimated by the National Association of Realtors ran at a seasonally adjusted annual rate of 4.33 million in April, down 2.5% from March’s preliminary pace and down 22.3% from last April’s seasonally adjusted pace.
NAHB: Builder Confidence Increased in May
by Calculated Risk on 5/16/2023 10:13:00 AM
The National Association of Home Builders (NAHB) reported the housing market index (HMI) was at 50, up from 45 last month. Any number above 50 indicates that more builders view sales conditions as good than poor.
From the NAHB: Lack of Existing Inventory Boosts Builder Confidence to Key Marker
Limited existing inventory, which has put a renewed emphasis on new construction, resulted in a solid gain for builder confidence in May even as the industry continues to face several challenges, including building material supply chain disruptions and tightening credit conditions for construction loans.
Builder confidence in the market for newly built single-family homes in May rose five points to 50, according to the National Association of Home Builders (NAHB)/Wells Fargo Housing Market Index (HMI). This marks the fifth straight month that builder confidence has increased and is the first time that sentiment levels have reached the midpoint mark of 50 since July 2022.
New home construction is taking on an increased role in the marketplace because many home owners with loans well below current mortgage rates are electing to stay put, and this is keeping the supply of existing homes at a very low level. In March, 33% of homes listed for sale were new homes in various stages of construction. That share from 2000-2019 was a 12.7% average. With limited available housing inventory, new construction will continue to be a significant part of prospective buyers’ search in the quarters ahead.
While this is fueling cautious optimism among builders, they continue to face ongoing challenges to meet a growing demand for new construction. These include shortages of transformers and other building materials and tightening credit conditions for residential real estate development and construction brought on by the actions of the Federal Reserve to raise interest rates.
...
All three major HMI indices posted gains in May. The HMI index gauging current sales conditions rose five points to 56, the component charting sales expectations in the next six months increased seven points to 57 and the gauge measuring traffic of prospective buyers increased two points to 33.
Looking at the three-month moving averages for regional HMI scores, the, the Midwest edged up two points to 39, the South increased three points to 52 and the West moved three points higher to 41. The Northeast held steady at 45.
emphasis added
 Click on graph for larger image.
This graph shows the NAHB index since Jan 1985.
This was at the consensus forecast.
The "traffic of prospective buyers" is still well below breakeven at 33 (below 50).
Industrial Production Increased 0.5% in April
by Calculated Risk on 5/16/2023 09:22:00 AM
From the Fed: Industrial Production and Capacity Utilization
Industrial production rose 0.5 percent in April after moving sideways the previous two months. In April, manufacturing increased 1.0 percent, bolstered by a strong gain in the output of motor vehicles and parts; factory output excluding motor vehicles and parts moved up 0.4 percent. The index for mining rose 0.6 percent, while the index for utilities dropped 3.1 percent, as milder temperatures in April lowered demand for heating. At 103.0 percent of its 2017 average, total industrial production in April was 0.2 percent above its year-earlier level. Capacity utilization edged up to 79.7 percent in April, a rate that is equal to its long-run (1972–2022) average.
emphasis added
 Click on graph for larger image.
This graph shows Capacity Utilization. This series is up from the record low set in April 2020, and above the level in February 2020 (pre-pandemic).
Capacity utilization at 79.7% is at the average from 1972 to 2022. This was at consensus expectations.
Note: y-axis doesn't start at zero to better show the change.
 The second graph shows industrial production since 1967.
Industrial production increased in April to 103.0. This is above the pre-pandemic level.
Industrial production was above consensus expectations, however previous months were revised down.
Retail Sales Increased 0.4% in April
by Calculated Risk on 5/16/2023 08:40:00 AM
On a monthly basis, retail sales were up 0.4% from March to April (seasonally adjusted), and sales were up 1.6 percent from April 2022.
From the Census Bureau report:
Advance estimates of U.S. retail and food services sales for April 2023, adjusted for seasonal variation and holiday and trading-day differences, but not for price changes, were $686.1 billion, up 0.4 percent from the previous month, and up 1.6 percent above April 2022. ... The February 2023 to March 2023 percent change was revised from down 0.6 percent to down 0.7 percent.
emphasis added
 Click on graph for larger image.
This graph shows retail sales since 1992. This is monthly retail sales and food service, seasonally adjusted (total and ex-gasoline).
Retail sales ex-gasoline were up 0.5% in April.
The second graph shows the year-over-year change in retail sales and food service (ex-gasoline) since 1993.
Retail and Food service sales, ex-gasoline, increased by 3.3% on a YoY basis.
 Sales in April were below expectations, and sales in March were revised down.
Monday, May 15, 2023
Tuesday: Retail Sales, Industrial Production, Homebuilder Survey
by Calculated Risk on 5/15/2023 08:46:00 PM
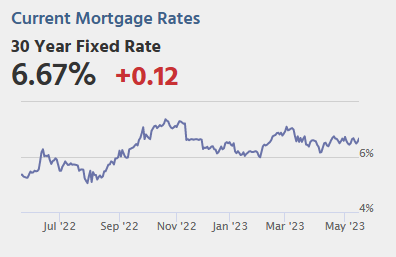 From Matthew Graham at Mortgage News Daily: Without Conclusive Answers, The Sideways Curse Continues
While it may be blessing for rates to be flatter and more predictable lately, the fact that the sideways range is close to long-term highs feels more like a curse. ... Apart from the year-end drift in December and the false start created by strong econ data in February, bonds have spent almost all of their time in the same range for 6 months now. [30 year fixed 6.67%]Tuesday:
emphasis added
• At 8:30 AM ET, Retail sales for April is scheduled to be released. The consensus is for 0.6% increase in retail sales.
• At 9:15 AM, The Fed will release Industrial Production and Capacity Utilization for April. The consensus is for a 0.1% decrease in Industrial Production, and for Capacity Utilization to decrease to 79.7%.
• At 10:00 AM, The May NAHB homebuilder survey. The consensus is for a reading of 45 unchanged from 45 last month. Any number below 50 indicates that more builders view sales conditions as poor than good.
MBA Survey: "Share of Mortgage Loans in Forbearance Decreases to 0.51% in April"
by Calculated Risk on 5/15/2023 04:00:00 PM
From the MBA: Share of Mortgage Loans in Forbearance Decreases to 0.51% in April
The Mortgage Bankers Association’s (MBA) monthly Loan Monitoring Survey revealed that the total number of loans now in forbearance decreased by 4 basis points from 0.55% of servicers’ portfolio volume in the prior month to 0.51% as of April 30, 2023. According to MBA’s estimate, 255,000 homeowners are in forbearance plans. Mortgage servicers have provided forbearance to approximately 7.8 million borrowers since April 2020.
In April 2023, the share of Fannie Mae and Freddie Mac loans in forbearance decreased 2 basis points to 0.24%. Ginnie Mae loans in forbearance decreased 7 basis points to 1.11%, and the forbearance share for portfolio loans and private-label securities (PLS) decreased 7 basis points to 0.61%.
“While the number of loans in forbearance continues to dwindle, there was some deterioration in the performance of post-forbearance workouts,” said Marina Walsh, CMB, MBA’s Vice President of Industry Analysis. “About three out of four borrowers are remaining current on their post-forbearance workouts, but this is down from the average of four out of five borrowers that was relatively consistent in 2022 and into 2023.”
Added Walsh, “Overall servicing portfolios remain healthy, and some of the worsening monthly performance can be attributed to seasonal factors such as tax refunds that pushed up the March results and then normalized in April. MBA’s forecast calls for an economic slowdown and an increase in unemployment later this year and into 2024, which will impact loan performance.
emphasis added
 Click on graph for larger image.
This graph shows the percent of portfolio in forbearance by investor type over time.
The share of forbearance plans has been decreasing, declined to 0.51% in April from 0.55% in March.
At the end of April, there were about 255,000 homeowners in forbearance plans.
3rd Look at Local Housing Markets in April
by Calculated Risk on 5/15/2023 12:33:00 PM
Today, in the Calculated Risk Real Estate Newsletter: 3rd Look at Local Housing Markets in April
A brief excerpt:
This is the third look at local markets in April. I’m tracking about 40 local housing markets in the US. Some of the 40 markets are states, and some are metropolitan areas. I update these tables throughout the month as data is released.There is much more in the article. You can subscribe at https://calculatedrisk.substack.com/
Closed sales in April were mostly for contracts signed in February and March. Since 30-year fixed mortgage rates were over 6% for all of February and March - compared to the 4% range the previous year - closed sales were down significantly year-over-year in April.
It is likely sales were down more year-over-year in April than in March, however, the impact was probably not as severe as for closed sales in December and January (rates were the highest in October and November 2022 when contracts were signed for closing in December and January).
...
In April, sales in these markets were down 24.7%. In March, these same markets were down 19.8% YoY Not Seasonally Adjusted (NSA).
This is a larger YoY decline NSA than in March for these markets, however there was one less selling day in April this year. This data suggests the April existing home sales report will show another significant YoY decline, and the 20th consecutive month with a YoY decline in sales.
More local markets to come!

NY Fed Q1 Report: Household Debt Increases, Mortgage Loan Growth Slows
by Calculated Risk on 5/15/2023 11:12:00 AM
From the NY Fed: Total Household Debt Reaches $17.05 trillion in Q1 2023; Mortgage Loan Growth Slows
The Federal Reserve Bank of New York's Center for Microeconomic Data today issued its Quarterly Report on Household Debt and Credit. The Report shows an increase in total household debt in the first quarter of 2023, increasing by $148 billion (0.9%) to $17.05 trillion. Balances now stand $2.9 trillion higher than at the end of 2019, before the pandemic recession. The report is based on data from the New York Fed's nationally representative Consumer Credit Panel.
Mortgage balances rose modestly by $121 billion in the first quarter of 2023 and stood at $12.04 trillion at the end of March. Credit card balances were flat in the first quarter, at $986 billion. Auto loan balances increased by $10 billion in the first quarter, bucking the typical trend of balance declines in first quarters. Student loan balances slightly increased and now stand at $1.60 trillion. Other balances, which include retail cards and other consumer loans, increased by $5 billion. In total, non-housing balances grew by $24 billion.
Mortgage originations, which include refinances, dropped sharply in the first quarter of 2023 to $324 billion, the lowest level seen since 2014. The volume of newly originated auto loans was $162 billion, a reduction from pandemic-era highs but still elevated compared to pre-Covid volumes. Aggregate limits on credit card accounts increased by $119 billion, representing a 2.7% increase from Q4 2022 levels. Limits on home equity lines of credit were up by $9 billion in the first quarter.
The share of current debt becoming delinquent increased for most debt types. The delinquency transition rate for credit cards and auto loans increased by 0.6 and 0.2 percentage points, respectively approaching or surpassing their pre-pandemic levels.
emphasis added
 Click on graph for larger image.
Here are three graphs from the report:
The first graph shows aggregate consumer debt increased in Q1. Household debt previously peaked in 2008 and bottomed in Q3 2013. Unlike following the great recession, there wasn't a decline in debt during the pandemic.
From the NY Fed:
Aggregate household debt balances increased by $148 billion in the first quarter of 2023, a 0.9% rise from 2022Q4. Balances now stand at $17.05 trillion and have increased by $2.9 trillion since the end of 2019, just before the pandemic recession.
 The second graph shows the percent of debt in delinquency.
The overall delinquency rate increased slightly in Q1. From the NY Fed:
Aggregate delinquency rates were roughly flat in the first quarter of 2023 and remained low, after declining sharply through the beginning of the pandemic. As of March, 2.6% of outstanding debt was in some stage of delinquency, 2.1 percentage points lower than last quarter of 2019, just before the COVID-19 pandemic hit the United States.
 The third graph shows Mortgage Originations by Credit Score.
From the NY Fed:
Mortgage originations measured as appearances of new mortgages on consumer credit reports, dropped sharply in the first quarter of 2023 to $324 billion, the lowest seen since 2014Q2, a quarter that was unusually low due to the “taper tantrum”. ... Limits on home equity lines of credit (HELOC) were up by $9 billion, or a 1% increase. ... The median credit score for newly originated mortgages decreased slightly to 765.There is much more in the report.
Housing May 15th Weekly Update: Inventory Increased 0.2% Week-over-week
by Calculated Risk on 5/15/2023 08:21:00 AM
Altos reports that active single-family inventory was up 0.2% week-over-week.
 Click on graph for larger image.
This inventory graph is courtesy of Altos Research.
As of May 12th, inventory was at 420 thousand (7-day average), compared to 420 thousand the prior week.
Year-to-date, inventory is down 14.3%. And inventory is up 3.7% from the seasonal bottom four weeks ago.

The red line is for 2023. The black line is for 2019. Note that inventory is up from the previous two years (the record low was in 2022), but still well below normal levels.
It appears likely inventory will be down year-over-year in Q3.
Inventory was up 34.4% compared to the same week in 2022 (last week it was up 39.7%), and down 53.1% compared to the same week in 2019 (last week down 52.6%).
Mike Simonsen discusses this data regularly on Youtube.


