 RSS Feed
 by Calculated Risk on 5/14/2023 06:17:00 PM
Sunday, May 14, 2023
Monday: NY Fed Mfg, Q1 Quarterly Report on Household Debt and Credit
Weekend:
• Schedule for Week of May 14, 2023
Monday:
• At 8:30 AM ET, The New York Fed Empire State manufacturing survey for May. The consensus is for a reading of -2.0, down from 10.8.
• At 11:00 AM, NY Fed: Q1 Quarterly Report on Household Debt and Credit
From CNBC: Pre-Market Data and Bloomberg futures S&P 500 are down 7 and DOW futures are down 50 (fair value).
Oil prices were down over the last week with WTI futures at $70.04 per barrel and Brent at $74.17 per barrel. A year ago, WTI was at $111, and Brent was at $112 - so WTI oil prices are down about 35% year-over-year.
Here is a graph from Gasbuddy.com for nationwide gasoline prices. Nationally prices are at $3.53 per gallon. A year ago, prices were at $4.44 per gallon, so gasoline prices are down $0.91 per gallon year-over-year.
DOT: Vehicle Miles Driven Increased 0.6% year-over-year in March
by Calculated Risk on 5/14/2023 11:27:00 AM
This is something I check occasionally.
The Department of Transportation (DOT) reported:
Travel on all roads and streets changed by +0.6% (+1.7 billion vehicle miles) for March 2023 as compared with March 2022. Travel for the month is estimated to be 271.2 billion vehicle miles.
The seasonally adjusted vehicle miles traveled for March 2023 is 266.8 billion miles, a 0.3% ( 0.9 billion vehicle miles) change over March 2022. It also represents a -1.1% change (-3.0 billion vehicle miles) compared with February 2023.
emphasis added
 Click on graph for larger image.
This graph shows the monthly total vehicle miles driven, seasonally adjusted.
Miles driven declined sharply in March 2020, and really collapsed in April 2020. Miles driven are now slightly below pre-pandemic levels.
Saturday, May 13, 2023
Real Estate Newsletter Articles this Week: "House Price Battle Royale: Low Inventory vs Affordability"
by Calculated Risk on 5/13/2023 02:11:00 PM
At the Calculated Risk Real Estate Newsletter this week:
• Part 1: Current State of the Housing Market; Overview for mid-April
• Part 2: Current State of the Housing Market; Overview for mid-April
• House Price Battle Royale: Low Inventory vs Affordability
• Lawler: American Homes 4 Rent Net Seller of Single-Family Homes Last Quarter
• 2nd Look at Local Housing Markets in April
This is usually published 4 to 6 times a week and provides more in-depth analysis of the housing market.
You can subscribe at https://calculatedrisk.substack.com/
Most content is available for free (and no Ads), but please subscribe!
Schedule for Week of May 14, 2023
by Calculated Risk on 5/13/2023 08:11:00 AM
The key reports this week are April Retail Sales, Housing Starts and Existing Home Sales.
For manufacturing, April Industrial Production, and the May NY and Philly Fed manufacturing surveys will be released.
Fed Chair Powell speaks on Friday.
8:30 AM: The New York Fed Empire State manufacturing survey for May. The consensus is for a reading of -2.0, down from 10.8.
11:00 AM: NY Fed: Q1 Quarterly Report on Household Debt and Credit
 8:30 AM ET: Retail sales for April is scheduled to be released. The consensus is for 0.6% increase in retail sales.
This graph shows retail sales since 1992. This is monthly retail sales and food service, seasonally adjusted (total and ex-gasoline).
Retail sales were down 0.6% in March (revised).
 9:15 AM: The Fed will release Industrial Production and Capacity Utilization for April.
This graph shows industrial production since 1967.
The consensus is for a 0.1% decrease in Industrial Production, and for Capacity Utilization to decrease to 79.7%.
10:00 AM: The May NAHB homebuilder survey. The consensus is for a reading of 45 unchanged from 45 last month. Any number below 50 indicates that more builders view sales conditions as poor than good.
7:00 AM ET: The Mortgage Bankers Association (MBA) will release the results for the mortgage purchase applications index.
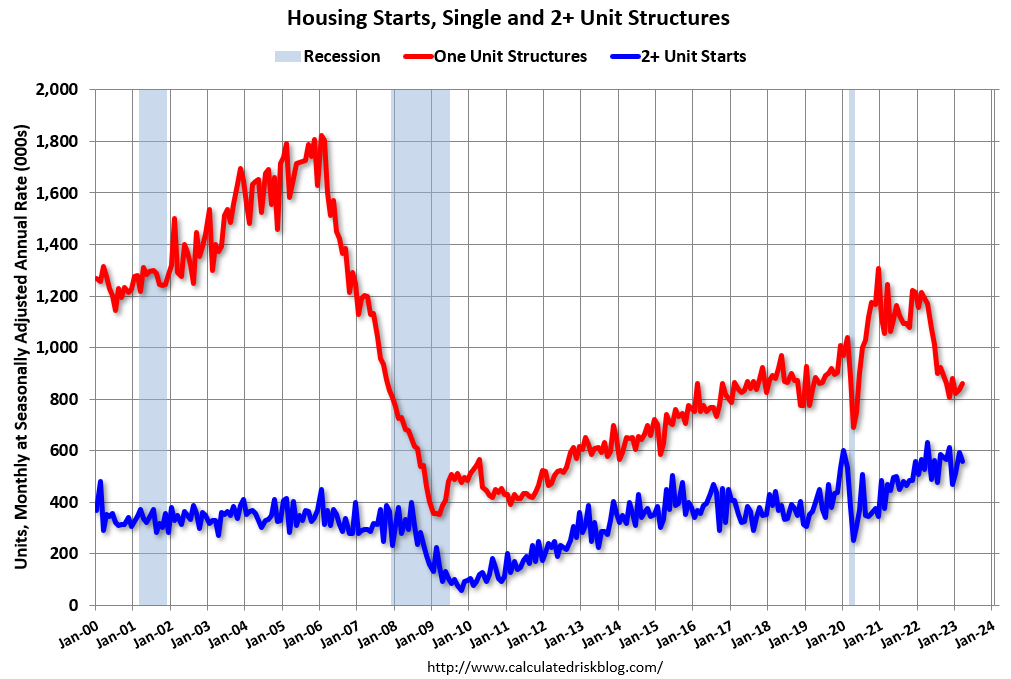 8:30 AM ET: Housing Starts for April.
 This graph shows single and total housing starts since 2000.
The consensus is for 1.396 million SAAR, down from 1.420 million SAAR in March.
8:30 AM: The initial weekly unemployment claims report will be released. The consensus is for 253 thousand initial claims, down from 264 thousand last week.
8:30 AM: the Philly Fed manufacturing survey for May. The consensus is for a reading of -21.1, up from -31.3.
 10:00 AM: Existing Home Sales for April from the National Association of Realtors (NAR). The consensus is for 4.30 million SAAR, down from 4.44 million.
The graph shows existing home sales from 1994 through the report last month.
10:00 AM: State Employment and Unemployment (Monthly) for April 2023
11:00 AM: Discussion, Conversation with Chair Jerome Powell and Ben Bernanke, former Chair of the Board of Governors of the Federal Reserve System At the Thomas Laubach Research Conference, Washington, D.C.
Friday, May 12, 2023
May 12th COVID Update: New Pandemic Low for Hospitalizations
by Calculated Risk on 5/12/2023 09:04:00 PM
 Note: Mortgage rates are from MortgageNewsDaily.com and are for top tier scenarios.
This will be the last update for Cases data due to changes at the CDC.
After the first few weeks, the pandemic low for weekly deaths had been the week of July 7, 2021, at 1,690 deaths (until recently).
For deaths, I'm currently using 3 weeks ago for "now", since the most recent two weeks will be revised significantly.
For COVID hospitalizations, the previous low was 9,821 (until two weeks ago).
| COVID Metrics | ||||
|---|---|---|---|---|
| Now | Week Ago | Goal | ||
| New Cases per Week2 | N/A | 77,924 | ≤35,0001 | |
| Hospitalized2 | 8,701 | 9,697 | ≤3,0001 | |
| Deaths per Week2 | 993 | 1,123 | ≤3501 | |
| 1my goals to stop weekly posts, 2Weekly for Cases, Currently Hospitalized, and Deaths 🚩 Increasing number weekly for Cases, Hospitalized, and Deaths ✅ Goal met. | ||||
Early Q2 GDP Tracking: Wide Range
by Calculated Risk on 5/12/2023 03:22:00 PM
From BofA:
Overall, incoming data this week pushed down our 1Q US GDP tracking estimate from 1.0% q/q saar to 0.9% q/q saar. [May 12th estimate]And from the Altanta Fed: GDPNow
emphasis added
The GDPNow model estimate for real GDP growth (seasonally adjusted annual rate) in the second quarter of 2023 is 2.7 percent on May 8, unchanged from May 4 after rounding. [May 8th estimate]
Part 2: Current State of the Housing Market; Overview for mid-April
by Calculated Risk on 5/12/2023 09:24:00 AM
Today, in the Calculated Risk Real Estate Newsletter: Part 2: Current State of the Housing Market; Overview for mid-April
A brief excerpt:
Yesterday, in Part 1: Current State of the Housing Market; Overview for mid-April I reviewed home inventory and sales, and mortgage delinquencies.There is much more in the article. You can subscribe at https://calculatedrisk.substack.com/
...
Other measures of house prices indicated year-over-year slowing or further declines in March. The NAR reported median prices were down 0.9% YoY in March. Black Knight reported prices were up 1.0% YoY in March, and Freddie Mac reported house prices were up 1.0% YoY in March. Here is a comparison of year-over-year change in the FMHPI, median house prices from the NAR, and the Case-Shiller National index.
The FMHPI and the NAR median prices appear to be leading indicators for Case-Shiller. The median price was down YoY in March, and based on the recent trend, the FMHPI will be negative year-over-year in April or May - and Case-Shiller will follow within a few months.
In real terms, the Case-Shiller National index is down 4.6% from the peak, seasonally adjusted. Historically it takes a number of years for real prices to return to the previous peak, see House Prices: 7 Years in Purgatory.

Hotels: Occupancy Rate Up 2.0% Year-over-year
by Calculated Risk on 5/12/2023 08:21:00 AM
U.S. hotel performance showed mixed results from the previous week but grew year over year, according to STR‘s latest data through 6 May.The following graph shows the seasonal pattern for the hotel occupancy rate using the four-week average.
30 April through 6 May 2023 (percentage change from comparable week in 2022):
• Occupancy: 65.2% (+2.0%)
• Average daily rate (ADR): US$157.62 (+6.4%)
• Revenue per available room (RevPAR): US$102.74 (+8.4%)
emphasis added
 Click on graph for larger image.
The red line is for 2023, black is 2020, blue is the median, and dashed light blue is for 2022. Dashed purple is for 2018, the record year for hotel occupancy.
The 4-week average of the occupancy rate is slightly above the median rate for the period 2000 through 2020 (Blue).
Note: Y-axis doesn't start at zero to better show the seasonal change.
The 4-week average of the occupancy rate will move mostly sideways until the summer travel season.
Thursday, May 11, 2023
Realtor.com Reports Weekly Active Inventory Up 31% YoY; New Listings Down 16% YoY
by Calculated Risk on 5/11/2023 04:15:00 PM
Realtor.com has monthly and weekly data on the existing home market. Here is their weekly report from chief economist Danielle Hale: Weekly Housing Trends View — Data Week Ending May 6, 2023
• Active inventory was up at a slower pace, with for-sale homes up just 31% above one year ago. The number of homes for sale continues to grow, but compared to one year ago, the pace is slowing.
...
• New listings–a measure of sellers putting homes up for sale–were down again this week, by 16% from one year ago. The number of newly listed homes has been lower than the same time the previous year for the past 44 weeks.
 Here is a graph of the year-over-year change in inventory according to realtor.com.
 Inventory is still up year-over-year - from record lows - however, the YoY increase has slowed sharply recently.
This was the smallest YoY increase since October.
The recent trend suggests active inventory could be down YoY in Q3!
Part 1: Current State of the Housing Market; Overview for mid-April
by Calculated Risk on 5/11/2023 12:35:00 PM
Today, in the Calculated Risk Real Estate Newsletter: Part 1: Current State of the Housing Market; Overview for mid-April
A brief excerpt:
Interestingly, new home inventory is essentially at a record percentage of total inventory. This graph uses Not Seasonally Adjusted (NSA) existing home inventory from the National Association of Realtors® (NAR) and new home inventory from the Census Bureau (only completed and under construction inventory).There is much more in the article. You can subscribe at https://calculatedrisk.substack.com/
Note: Mark Fleming, Chief Economist at First American pointed this out in March.
It took a number of years following the housing bust for new home inventory to return to the pre-bubble percent of total inventory. Then, with the pandemic, existing home inventory collapsed and now the percent of new homes is over 25% of total for sale inventory. The lack of existing home inventory, and few distressed sales, has been a positive for homebuilders.


