 RSS Feed
 by Calculated Risk on 4/02/2023 06:42:00 PM
Sunday, April 02, 2023
Monday: ISM Mfg, Construction Spending, Vehicle Sales
Weekend:
• Schedule for Week of April 2, 2023
Monday:
• At 10:00 AM ET, ISM Manufacturing Index for March. The consensus is for the ISM to be at 47.5, down from 47.7 in February.
• Also at 10:00 AM, Construction Spending for February. The consensus is for 0.1% decrease in construction spending.
• All day, Light vehicle sales for March. The consensus is for light vehicle sales to be 14.9 million SAAR in March, unchanged from 14.9 million in February (Seasonally Adjusted Annual Rate).
From CNBC: Pre-Market Data and Bloomberg futures S&P 500 and DOW futures are down slightly (fair value).
Oil prices were up over the last week with WTI futures at $75.67 per barrel and Brent at $79.89 per barrel. A year ago, WTI was at $99, and Brent was at $106 - so WTI oil prices are DOWN 23% year-over-year.
Here is a graph from Gasbuddy.com for nationwide gasoline prices. Nationally prices are at $3.48 per gallon. A year ago, prices were at $4.20 per gallon, so gasoline prices are down $0.72 per gallon year-over-year.
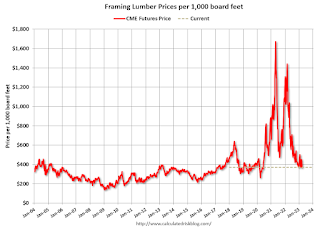
Update: Framing Lumber Prices Down 63% YoY, Below Pre-Pandemic Levels
by Calculated Risk on 4/02/2023 10:23:00 AM
Here is another monthly update on framing lumber prices.
This graph shows CME random length framing futures through March 31st.
Lumber is currently at $360 per 1000 board feet.
This is down from the peak of $1,733, and down 63% from $1008 a year ago.
Prices are below the pre-pandemic levels of around $400.
 Click on graph for larger image.
It is unlikely we will see a significant runup in prices this Spring due to the housing slowdown.
Prices are below the pre-pandemic levels of around $400.
 Click on graph for larger image.
There is somewhat of a seasonal demand for lumber, and lumber prices usually peak in April or May.
It is unlikely we will see a significant runup in prices this Spring due to the housing slowdown.
Saturday, April 01, 2023
Real Estate Newsletter Articles this Week: "Price-to-rent index is 7.9% below recent peak"
by Calculated Risk on 4/01/2023 02:11:00 PM
At the Calculated Risk Real Estate Newsletter this week:
• Inflation Adjusted House Prices 4.6% Below Peak Price-to-rent index is 7.9% below recent peak
• Year-over-year Rent Growth Continues to Decelerate
• Case-Shiller: National House Price Index "Declining Trend Continued" to 3.8% year-over-year increase in January
• Freddie Mac House Price Index Declines for 8th Consecutive Month in February
This is usually published 4 to 6 times a week and provides more in-depth analysis of the housing market.
You can subscribe at https://calculatedrisk.substack.com/
Most content is available for free (and no Ads), but please subscribe!
Schedule for Week of April 2, 2023
by Calculated Risk on 4/01/2023 08:11:00 AM
The key report scheduled for this week is the March employment report on Friday.
Other key reports include the February Trade Deficit and March Auto Sales.
For manufacturing, the March ISM Manufacturing survey will be released.
10:00 AM: ISM Manufacturing Index for March. The consensus is for the ISM to be at 47.5, down from 47.7 in February.
10:00 AM: Construction Spending for February. The consensus is for 0.1% decrease in construction spending.
 All Day: Light vehicle sales for March. The consensus is for light vehicle sales to be 14.9 million SAAR in March, unchanged from 14.9 million in February (Seasonally Adjusted Annual Rate).
This graph shows light vehicle sales since the BEA started keeping data in 1967. The dashed line is the February sales rate.
8:00 AM: Corelogic House Price index for February.
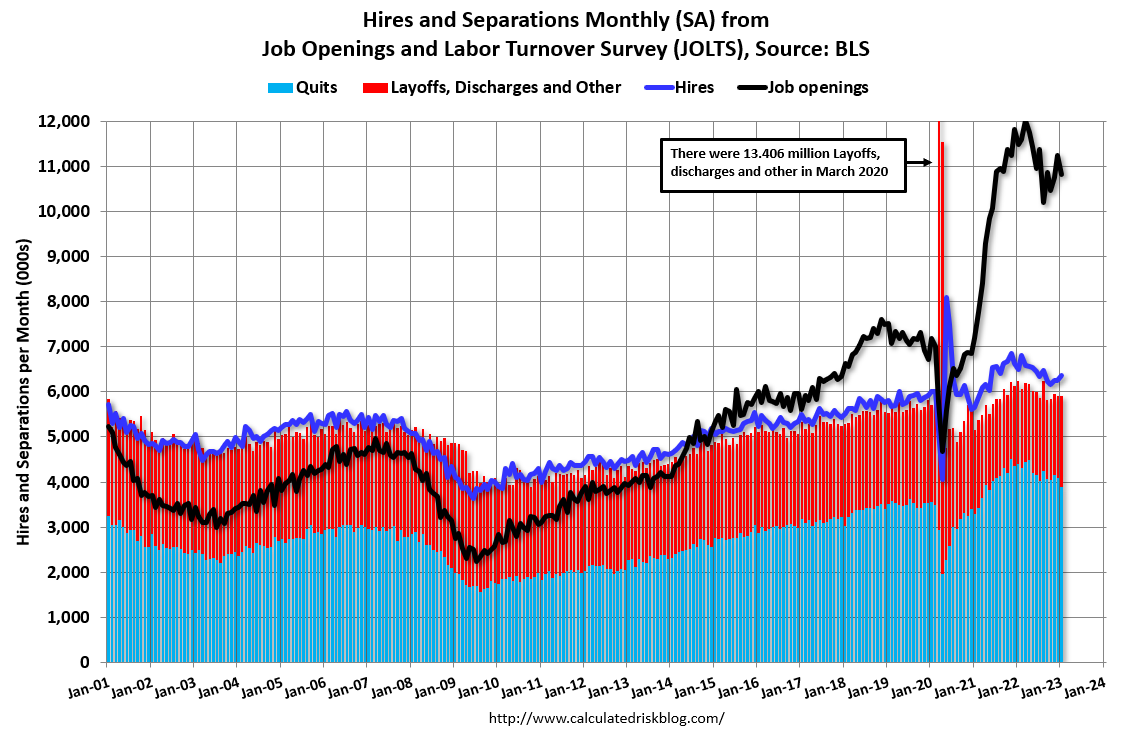 10:00 AM ET: Job Openings and Labor Turnover Survey for February from the BLS.
 This graph shows job openings (black line), hires (dark blue), Layoff, Discharges and other (red column), and Quits (light blue column) from the JOLTS.
Jobs openings decreased in January to 10.8 million from 11.2 million in December.
7:00 AM ET: The Mortgage Bankers Association (MBA) will release the results for the mortgage purchase applications index.
8:15 AM: The ADP Employment Report for March. This report is for private payrolls only (no government). The consensus is for 200,000 payroll jobs added in March, down from 242,000 added in February.
 8:30 AM: Trade Balance report for February from the Census Bureau.
 This graph shows the U.S. trade deficit, with and without petroleum, through the most recent report. The blue line is the total deficit, and the black line is the petroleum deficit, and the red line is the trade deficit ex-petroleum products.
The consensus is the trade deficit to be $68.7 billion. The U.S. trade deficit was at $68.3 billion in January.
10:00 AM: the ISM Services Index for March.
8:30 AM: The initial weekly unemployment claims report will be released. The consensus is for 196 thousand initial claims, down from 198 thousand last week.
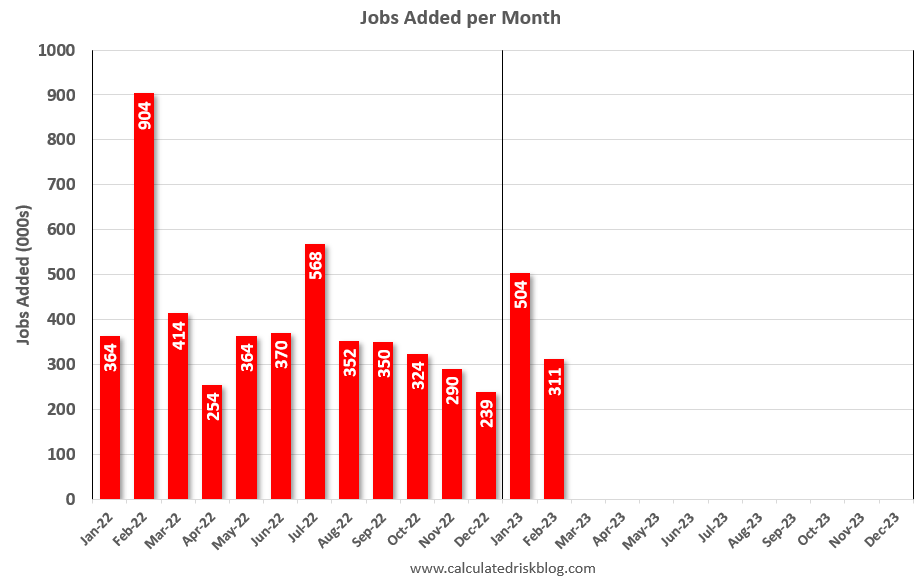 8:30 AM: Employment Report for March. The consensus is for 240,000 jobs added, and for the unemployment rate to be unchanged at 3.6%.
There were 311,000 jobs added in February, and the unemployment rate was at 3.6%.
This graph shows the jobs added per month since January 2022.
Friday, March 31, 2023
COVID Mar 31, 2023: Update on Cases, Hospitalizations and Deaths
by Calculated Risk on 3/31/2023 09:10:00 PM
 Note: Mortgage rates are from MortgageNewsDaily.com and are for top tier scenarios.
On COVID (focus on hospitalizations and deaths). Data is now weekly.
After the first few weeks, the pandemic low for weekly deaths was the week of July 7, 2021, at 1,690 deaths.
Weekly deaths just set a new pandemic low at 1,596, although the data might be revised up.
| COVID Metrics | ||||
|---|---|---|---|---|
| Now | Week Ago | Goal | ||
| New Cases per Week2 | 139,931 | 154,244 | ≤35,0001 | |
| Hospitalized2 | 14,650 | 15,965 | ≤3,0001 | |
| Deaths per Week2 | 1,596 | 2,260 | ≤3501 | |
| 1my goals to stop weekly posts, 2Weekly for Cases, Currently Hospitalized, and Deaths 🚩 Increasing number weekly for Cases, Hospitalized, and Deaths ✅ Goal met. | ||||
 Click on graph for larger image.
This graph shows the weekly (columns) number of deaths reported.
For cases, the low was 82,186.
For COVID hospitalizations, the low was 9,821.
Freddie Mac House Price Index Declines for 8th Consecutive Month in February
by Calculated Risk on 3/31/2023 01:23:00 PM
Today, in the Calculated Risk Real Estate Newsletter: Freddie Mac House Price Index Declines for 8th Consecutive Month in February
A brief excerpt:
Freddie Mac reported that its “National” Home Price Index (FMHPI) declined for the eighth consecutive month on a seasonally adjusted basis in February, putting the National FMHPI down 2.5% from its June 2022 peak, and down 4.7% Not Seasonally Adjusted (NSA) from the peak.There is much more in the article. You can subscribe at https://calculatedrisk.substack.com/
On a year-over-year basis, the National FMHPI was up 1.1% in February, down from 2.9% YoY in January. The YoY increase peaked at 19.2% in July 2021. ...
In February, 29 states and D.C. were below their 2022 peaks, Seasonally Adjusted. The largest seasonally adjusted declines from the recent peak were in Idaho (-10.0%), Nevada (-8.4%), Washington (-7.5%), Arizona (-7.1%), California (-6.9%), Utah (-6.8%), and D.C. (-6.7%).
...
For cities (Core-based Statistical Areas, CBSA), here are the 30 cities with the largest declines from the peak, seasonally adjusted.

Q1 GDP Tracking: Around 2%
by Calculated Risk on 3/31/2023 12:29:00 PM
From BofA:
Personal income rose by a larger-than-expected 0.3% m/m in February, after a 0.6% m/m print in January. Personal spending rose by 0.2% m/m in nominal terms with sizeable upward revisions to January, both in nominal and real terms. This increased our 1Q PCE tracking estimate. Overall, today's personal income and outlays print pushed up our 1Q US GDP tracking estimate from 0.8% q/q saar to 1.5% q/q saar. [Mar 31st estimate]From Goldman:
emphasis added
The February core PCE price index rose by 0.30% month-over-month, below consensus expectations, and the year-over-year rate decreased to 4.60%. ... The spending details of this morning’s data were firmer than our previous assumptions, and we boosted our Q1 GDP tracking estimate by 0.2pp to +2.4% (qoq ar). [Mar 31st estimate]And from the Altanta Fed: GDPNow
The GDPNow model estimate for real GDP growth (seasonally adjusted annual rate) in the first quarter of 2023 is 2.5 percent on March 31, down from 3.2 percent on March 24. After recent releases from the US Census Bureau and the US Bureau of Economic Analysis, the nowcasts of first-quarter real personal consumption expenditures growth, first-quarter real gross private domestic investment growth, and first-quarter real government spending growth decreased from 5.0 percent, -7.0 percent, and 1.8 percent, respectively, to 4.6 percent, -7.3 percent, and 1.7 percent. [Mar 31st estimate]
Personal Income increased 0.3% in February; Spending increased 0.2%
by Calculated Risk on 3/31/2023 08:36:00 AM
The BEA released the Personal Income and Outlays report for February:
Personal income increased $72.9 billion (0.3 percent) in February, according to estimates released today by the Bureau of Economic Analysis. Disposable personal income (DPI) increased $89.9 billion (0.5 percent) and personal consumption expenditures (PCE) increased $27.9 billion (0.2 percent).The February PCE price index increased 5.0 percent year-over-year (YoY), down from 5.3 percent YoY in January, and down from the recent peak of 7.0 percent in June 2022.
The PCE price index increased 0.3 percent. Excluding food and energy, the PCE price index also increased 0.3 percent. Real DPI increased 0.2 percent in February and Real PCE decreased 0.1 percent; goods and services each decreased 0.1 percent.
emphasis added
The PCE price index, excluding food and energy, increased 4.6 percent YoY, down from 4.7 percent in January, and down from the recent peak of 5.4 percent in February 2022.
The following graph shows real Personal Consumption Expenditures (PCE) through February 2023 (2012 dollars). Note that the y-axis doesn't start at zero to better show the change.
 Click on graph for larger image.
The dashed red lines are the quarterly levels for real PCE.
Personal income was at expectations, and the increase in PCE was below expectations.
Inflation was slightly lower than expected.
Using the two-month method to estimate Q1 real PCE growth, real PCE was increasing at a 4.0% annual rate in Q1 2023. (Using the mid-month method, real PCE was increasing at 4.7%)
Using the two-month method to estimate Q1 real PCE growth, real PCE was increasing at a 4.0% annual rate in Q1 2023. (Using the mid-month method, real PCE was increasing at 4.7%)
Thursday, March 30, 2023
Friday: Personal Income and Outlays
by Calculated Risk on 3/30/2023 08:44:00 PM
 Note: Mortgage rates are from MortgageNewsDaily.com and are for top tier scenarios.
Friday:
• At 8:30 AM ET, Personal Income and Outlays for February. The consensus is for a 0.3% increase in personal income, and for a 0.3% increase in personal spending. And for the Core PCE price index to increase 0.4%. PCE prices are expected to be up 5.1% YoY, and core PCE prices up 4.7% YoY.
• At 9:45 AM, Chicago Purchasing Managers Index for March. The consensus is for a reading of 43.6, unchanged from 43.6 in February.
• At 10:00 AM, University of Michigan's Consumer sentiment index (Final for March). The consensus is for a reading of 63.4.
Hotels: Occupancy Rate Down 6.3% Compared to Same Week in 2019
by Calculated Risk on 3/30/2023 02:29:00 PM
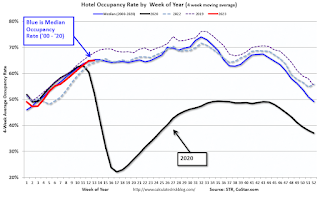
Reflecting the normal ebb and flow of spring break season, U.S. hotel performance decreased from the previous week, according to STR‘s latest data through March 25.The following graph shows the seasonal pattern for the hotel occupancy rate using the four-week average.
March 19-25, 2023 (percentage change from comparable weeks in 2022, 2019):
• Occupancy: 64.9% (-0.6%, -6.3%)
• Average daily rate (ADR): $158.61 (+4.7%, +19.5%)
• Revenue per available room (RevPAR): $102.98 (+4.1%, +12.0%)
emphasis added
NOTE: Last year, the occupancy rate was close to normal after the first quarter (depressed due to a surge in COVID), so STR will only be comparing to 2022 after Q1.
 Click on graph for larger image.
The red line is for 2023, black is 2020, blue is the median, and dashed light blue is for 2022. Dashed purple is 2019 (STR is comparing to a strong year for hotels).
 Click on graph for larger image.
The red line is for 2023, black is 2020, blue is the median, and dashed light blue is for 2022. Dashed purple is 2019 (STR is comparing to a strong year for hotels).
The 4-week average of the occupancy rate is close to the median rate for the previous 20 years (Blue).
Note: Y-axis doesn't start at zero to better show the seasonal change.
The 4-week average of the occupancy rate will move more sideways until the Summer.


