 RSS Feed
 by Calculated Risk on 3/16/2023 09:32:00 AM
Thursday, March 16, 2023
February Housing Starts: Average Length of Time from Start to Completion increased Sharply in 2022
Today, in the CalculatedRisk Real Estate Newsletter: February Housing Starts: Average Length of Time from Start to Completion increased Sharply in 2022
Excerpt:
Census released the annual data on the length of time from start to completion, and this showed construction delays in 2022.There is much more in the post. You can subscribe at https://calculatedrisk.substack.com/
In 2022, it took an average of 8.3 months from start to completion for single family homes, up from already elevated 7.2 months in 2021. For 2+ unit buildings, it took 17.0 months for buildings with 2 or more units in 2022, up from 15.4 months in 2021. This will be even longer for multi-family in 2023 as many of these units that have been under construction are completed this year.
The delays following the housing bubble were due to many projects being mothballed for several years. The recent delays were due to pandemic related supply constraints.
From Authorization to Start, it took 1.3 months in 2022 for single family homes, up from 1.3 months in 2021, and it took 2.8 months in 2021 for 2+ Unit buildings, up from 2.2 months.
...
The weakness in 2022 was mostly for single family starts. I expect multi-family starts to turn down in 2023.

Housing Starts Increased to 1.450 million Annual Rate in February
by Calculated Risk on 3/16/2023 08:40:00 AM
From the Census Bureau: Permits, Starts and Completions
Housing Starts:
Privately‐owned housing starts in February were at a seasonally adjusted annual rate of 1,450,000. This is 9.8 percent above the revised January estimate of 1,321,000, but is 18.4 percent below the February 2022 rate of 1,777,000. Single‐family housing starts in February were at a rate of 830,000; this is 1.1 percent above the revised January figure of 821,000. The February rate for units in buildings with five units or more was 608,000.
Building Permits:
Privately‐owned housing units authorized by building permits in February were at a seasonally adjusted annual rate of 1,524,000. This is 13.8 percent above the revised January rate of 1,339,000, but is 17.9 percent below the February 2022 rate of 1,857,000. Single‐family authorizations in February were at a rate of 777,000; this is 7.6 percent above the revised January figure of 722,000. Authorizations of units in buildings with five units or more were at a rate of 700,000 in February.
emphasis added
 Click on graph for larger image.
The first graph shows single and multi-family housing starts for the last several years.
Multi-family starts (blue, 2+ units) decreased in February compared to January. Multi-family starts were up 9.9% year-over-year in February.
Single-family starts (red) increased slightly in February and were down 31.6% year-over-year.
 The second graph shows single and multi-family housing starts since 1968.
 This shows the huge collapse following the housing bubble, and then the eventual recovery - and the recent collapse in single-family starts.
Total housing starts in February were above expectations, however, starts in December and January were revised down, combined.
I'll have more later …
Weekly Initial Unemployment Claims decrease to 192,000
by Calculated Risk on 3/16/2023 08:33:00 AM
The DOL reported:
In the week ending March 11, the advance figure for seasonally adjusted initial claims was 192,000, a decrease of 20,000 from the previous week's revised level. The previous week's level was revised up by 1,000 from 211,000 to 212,000. The 4-week moving average was 196,500, a decrease of 750 from the previous week's revised average. The previous week's average was revised up by 250 from 197,000 to 197,250.The following graph shows the 4-week moving average of weekly claims since 1971.
emphasis added
 Click on graph for larger image.
The dashed line on the graph is the current 4-week average. The four-week average of weekly unemployment claims decreased to 196,500.
The previous week was revised up.
Weekly claims were below the consensus forecast.
Wednesday, March 15, 2023
Thursday: Housing Starts, Unemployment Claims, Philly Fed Mfg
by Calculated Risk on 3/15/2023 08:37:00 PM
 Note: Mortgage rates are from MortgageNewsDaily.com and are for top tier scenarios.
Thursday:
• At 8:30 AM ET, Housing Starts for February. The consensus is for 1.310 million SAAR, up from 1.309 million SAAR.
• Also at 8:30 AM, The initial weekly unemployment claims report will be released. The consensus is for 205 thousand initial claims, down from 211 thousand last week.
• Also at 8:30 AM, the Philly Fed manufacturing survey for March. The consensus is for a reading of -14.8, up from -24.3.
Weather Boosted Employment by About 65,000 in February
by Calculated Risk on 3/15/2023 03:13:00 PM
The BLS reported 311 thousand non-farm jobs were added in February. During the Winter months, I like to look at the weather impact on the report.
The BLS reported 174 thousand people were employed in non-agriculture industries, with a job, but not at work due to bad weather. The average for February over the previous 10 years was 345 thousand (median 248 thousand), so fewer than normal impacted by bad weather.
The BLS also reported 493 thousand people that are usually full-time employees were working part time in January due to bad weather. The average for February over the previous 10 years was 1.57 million (median was 708 thousand). This series suggests weather positively impacted employment more than usual (boosting seasonally adjusted employment).
The San Francisco Fed estimates Weather-Adjusted Change in Total Nonfarm Employment (monthly change, seasonally adjusted). They use local area weather to estimate the impact on employment. For February, the San Francisco Fed estimated that weather boosted employment by 65 to 95 thousand jobs.
This is the second consecutive month with an employment boost from better than normal weather, and we should expect some negative payback in coming months.
Current State of the Housing Market: Overview for mid-March
by Calculated Risk on 3/15/2023 12:14:00 PM
Today, in the Calculated Risk Real Estate Newsletter: Current State of the Housing Market; Overview for mid-March
A brief excerpt:
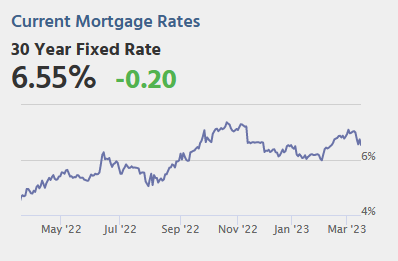
The following graph from MortgageNewsDaily.com shows mortgage rates since January 1, 2020. 30-year mortgage rates were at 6.75% on March 14th, up from 6.0% in early February, and down from the recent high of over 7.0% - and still up sharply year-over-year.There is much more in the article. You can subscribe at https://calculatedrisk.substack.com/
A year ago, the payment on a $500,000 house, with a 20% down payment and 3.76% 30-year mortgage rates, would be around $1,855 for principal and interest. The monthly payment for the same house, with house prices up 3% YoY and mortgage rates at 6.75%, would be $2,672 - an increase of 44%! Monthly payments are still up sharply year-over-year.
There are always some people that need to sell; death, divorce, moving for employment are a few reasons. However, homeowners with a low mortgage rate will be reluctant to sell, and then buy a new home, when their monthly payment will be much higher for the new home. The sharp increase in mortgage rates is probably the key reason new listings have declined sharply year-over-year.
This is very different from the housing bust, when many homeowners were forced to sell as their teaser rates expired and they could not afford the fully amortized mortgage payment. The current situation is similar to the 1980 period, when rates increased quickly.

NAHB: Builder Confidence Increased in March
by Calculated Risk on 3/15/2023 10:13:00 AM
The National Association of Home Builders (NAHB) reported the housing market index (HMI) was at 44, up from 42 last month. Any number below 50 indicates that more builders view sales conditions as poor than good.
From the NAHB: Builder Confidence Edges Higher in March but Future Outlook Uncertain
Although high construction costs and elevated interest rates continue to hamper housing affordability, builders expressed cautious optimism in March as a lack of existing inventory is shifting demand to the new home market.
Builder confidence in the market for newly built single-family homes in March rose two points to 44, according to the National Association of Home Builders (NAHB)/Wells Fargo Housing Market Index (HMI). This is the third straight monthly increase in builder sentiment levels..
...
The HMI index gauging current sales conditions in March rose two points to 49 and the gauge measuring traffic of prospective buyers increased three points to 31. This is the highest traffic reading since September of last year. The component charting sales expectations in the next six months fell one point to 47.
Looking at the three-month moving averages for regional HMI scores, the Northeast rose five points to 42, the Midwest edged one-point higher to 34, the South increased five points to 45 and the West moved four points higher to 34.
emphasis added
 Click on graph for larger image.
This graph shows the NAHB index since Jan 1985.
This was above the consensus forecast.
The "traffic of prospective buyers" is still well below breakeven at 31 (below 50).
Retail Sales Decreased 0.4% in February
by Calculated Risk on 3/15/2023 08:42:00 AM
On a monthly basis, retail sales were down 0.4% from January to February (seasonally adjusted), and sales were up 5.4 percent from February 2022.
From the Census Bureau report:
Advance estimates of U.S. retail and food services sales for February 2023, adjusted for seasonal variation and holiday and trading-day differences, but not for price changes, were $697.9 billion, down 0.4 percent from the previous month, but up 5.4 percent above February 2022. ... The December 2022 to January 2023 percent change was revised from up 3.0 percent to up 3.2 percent.
emphasis added
 Click on graph for larger image.
This graph shows retail sales since 1992. This is monthly retail sales and food service, seasonally adjusted (total and ex-gasoline).
Retail sales ex-gasoline were down 0.4% in February.
The second graph shows the year-over-year change in retail sales and food service (ex-gasoline) since 1993.
Retail and Food service sales, ex-gasoline, increased by 6.1% on a YoY basis.
 Sales in February were slightly below expectations, however, sales in December and January were revised up.
MBA: Mortgage Purchase Applications Increased in Weekly Survey
by Calculated Risk on 3/15/2023 07:00:00 AM
From the MBA: Mortgage Applications Increase in Latest MBA Weekly Survey
Mortgage applications increased 6.5 percent from one week earlier, according to data from the Mortgage Bankers Association’s (MBA) Weekly Mortgage Applications Survey for the week ending March 10, 2023.
The Market Composite Index, a measure of mortgage loan application volume, increased 6.5 percent on a seasonally adjusted basis from one week earlier. On an unadjusted basis, the Index increased 7 percent compared with the previous week. The Refinance Index increased 5 percent from the previous week and was 74 percent lower than the same week one year ago. The seasonally adjusted Purchase Index increased 7 percent from one week earlier. The unadjusted Purchase Index increased 8 percent compared with the previous week and was 38 percent lower than the same week one year ago.
“Treasury yields declined late last week, as market concerns over bank closures and the potential for broader ripple effects triggered a flight to safety in Treasury bonds. This decline pushed mortgage rates for all loan types lower, with the 30-year fixed rate decreasing to 6.71 percent,” said Joel Kan, MBA’s Vice President and Deputy Chief Economist. “Home-purchase applications increased for the second straight week but remained almost 40 percent below last year’s pace. While lower rates should buoy housing demand, the financial market volatility may cause buyers to pause their decisions.”
Added Kan, “Refinance activity remained more than 70 percent behind last year’s level, as rates are still more than two percentage points higher than a year ago. The dip in rates did bring some borrowers back as evidenced by the 5 percent increase in refinance applications last week.”
..
The average contract interest rate for 30-year fixed-rate mortgages with conforming loan balances ($726,200 or less) decreased to 6.71 percent from 6.79 percent, with points decreasing to 0.79 from 0.80 (including the origination fee) for 80 percent loan-to-value ratio (LTV) loans.
emphasis added
 Click on graph for larger image.
The first graph shows the refinance index since 1990.
With higher mortgage rates, the refinance index declined sharply in 2022.
Other than the lows recent in Q4 of 2022 and earlier this year, the refinance index was at the lowest level since the year 2000.
The second graph shows the MBA mortgage purchase index.
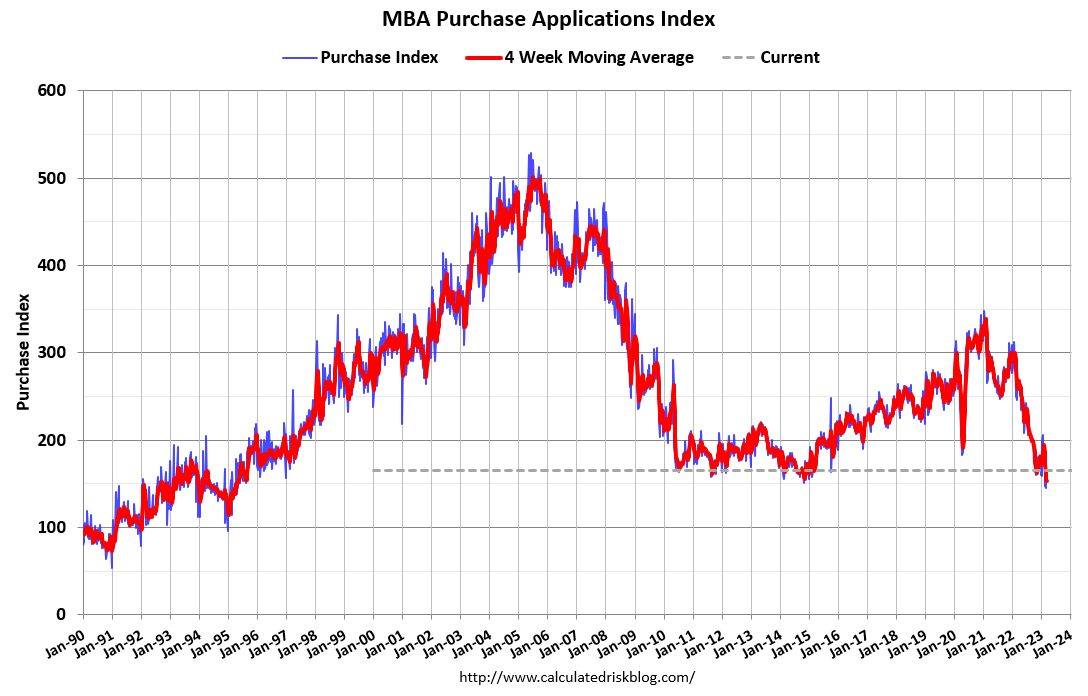 According to the MBA, purchase activity is down 38% year-over-year unadjusted.
 Red is a four-week average (blue is weekly).
Tuesday, March 14, 2023
Wednesday: Retail Sales, PPI, NY Fed Mfg, Homebuilder Survey
by Calculated Risk on 3/14/2023 08:06:00 PM
 Note: Mortgage rates are from MortgageNewsDaily.com and are for top tier scenarios.
Wednesday:
• At 7:00 AM ET, The Mortgage Bankers Association (MBA) will release the results for the mortgage purchase applications index.
• At 8:30 AM, Retail sales for February is scheduled to be released. The consensus is for a 0.3% decrease in retail sales.
• Also at 8:30 AM, The Producer Price Index for February from the BLS. The consensus is for a 0.3% increase in PPI, and a 0.4% increase in core PPI.
• Also at 8:30 AM, The New York Fed Empire State manufacturing survey for March. The consensus is for a reading of -7.7, down from -5.8.
• At 10:00 AM, The March NAHB homebuilder survey. The consensus is for a reading of 41, down from 42. Any number below 50 indicates that more builders view sales conditions as poor than good.


