 RSS Feed
 by Calculated Risk on 3/18/2023 02:11:00 PM
Saturday, March 18, 2023
Real Estate Newsletter Articles this Week: "Average Length of Time from Start to Completion increased Sharply in 2022"
At the Calculated Risk Real Estate Newsletter this week:
• Pandemic Economics, Housing and Monetary Policy: Part 2
• Current State of the Housing Market; Overview for mid-March
• Lawler: Early Read on Existing Home Sales in February
• February Housing Starts: Average Length of Time from Start to Completion increased Sharply in 2022
• Q4 Update: Delinquencies, Foreclosures and REO
• 2nd Look at Local Housing Markets in February
This is usually published 4 to 6 times a week and provides more in-depth analysis of the housing market.
You can subscribe at https://calculatedrisk.substack.com/
Most content is available for free (and no Ads), but please subscribe!
Schedule for Week of March 19, 2023
by Calculated Risk on 3/18/2023 08:11:00 AM
The key reports this week are February New and Existing Home Sales.
The FOMC meets this week, and there is some uncertainty on rate hikes due to the recent banking issues.
No major economic releases scheduled.
 10:00 AM: Existing Home Sales for February from the National Association of Realtors (NAR). The consensus is for 4.15 million SAAR, up from 4.00 million.
The graph shows existing home sales from 1994 through the report last month.
Housing economist Tom Lawler expects the NAR to report sales of 4.51 million SAAR for February (well above consensus).
----- Wednesday, March 22nd -----
7:00 AM ET: The Mortgage Bankers Association (MBA) will release the results for the mortgage purchase applications index.
During the day: The AIA's Architecture Billings Index for February (a leading indicator for commercial real estate).
2:00 PM: FOMC Meeting Announcement. The FOMC is expected to raise the Fed Funds rate by 25bps at this meeting, although there is some uncertainty due to the bank issues.
2:00 PM: FOMC Projections. This will include the Federal Open Market Committee (FOMC) participants' projections of the appropriate target federal funds rate along with updated economic projections.
2:30 PM: Fed Chair Jerome Powell holds a press briefing following the FOMC announcement.
----- Thursday, March 23rd -----
8:30 AM: The initial weekly unemployment claims report will be released. The consensus is for 190 thousand initial claims, down from 192 thousand last week.
8:30 AM ET: Chicago Fed National Activity Index for February. This is a composite index of other data.
 10:00 AM: New Home Sales for February from the Census Bureau.
This graph shows New Home Sales since 1963. The dashed line is the sales rate for last month.
The consensus is for 650 thousand SAAR, down from 670 thousand in January.
11:00 AM: the Kansas City Fed manufacturing survey for March.
----- Friday, March 24th -----
8:30 AM: Durable Goods Orders for February from the Census Bureau. The consensus is for a 1.2% increase in durable goods orders.
10:00 AM: State Employment and Unemployment (Monthly), February 2023
7:00 AM ET: The Mortgage Bankers Association (MBA) will release the results for the mortgage purchase applications index.
During the day: The AIA's Architecture Billings Index for February (a leading indicator for commercial real estate).
2:00 PM: FOMC Meeting Announcement. The FOMC is expected to raise the Fed Funds rate by 25bps at this meeting, although there is some uncertainty due to the bank issues.
2:00 PM: FOMC Projections. This will include the Federal Open Market Committee (FOMC) participants' projections of the appropriate target federal funds rate along with updated economic projections.
2:30 PM: Fed Chair Jerome Powell holds a press briefing following the FOMC announcement.
8:30 AM: The initial weekly unemployment claims report will be released. The consensus is for 190 thousand initial claims, down from 192 thousand last week.
8:30 AM ET: Chicago Fed National Activity Index for February. This is a composite index of other data.
 10:00 AM: New Home Sales for February from the Census Bureau.
 This graph shows New Home Sales since 1963. The dashed line is the sales rate for last month.
The consensus is for 650 thousand SAAR, down from 670 thousand in January.
11:00 AM: the Kansas City Fed manufacturing survey for March.
8:30 AM: Durable Goods Orders for February from the Census Bureau. The consensus is for a 1.2% increase in durable goods orders.
10:00 AM: State Employment and Unemployment (Monthly), February 2023
Friday, March 17, 2023
COVID Mar 17, 2023: Update on Cases, Hospitalizations and Deaths
by Calculated Risk on 3/17/2023 08:45:00 PM
 Note: Mortgage rates are from MortgageNewsDaily.com and are for top tier scenarios.
On COVID (focus on hospitalizations and deaths). Data is now weekly.
| COVID Metrics | ||||
|---|---|---|---|---|
| Now | Week Ago | Goal | ||
| New Cases per Week2 | 149,955 | 186,793 | ≤35,0001 | |
| Hospitalized2 | 17,348 | 19,629 | ≤3,0001 | |
| Deaths per Week2 | 1,706 | 2,100 | ≤3501 | |
| 1my goals to stop weekly posts, 2Weekly for Cases, Currently Hospitalized, and Deaths 🚩 Increasing number weekly for Cases, Hospitalized, and Deaths ✅ Goal met. | ||||
 Click on graph for larger image.
This graph shows the weekly (columns) number of deaths reported.
After the first few weeks, the pandemic low for weekly deaths was the week of July 7, 2021, at 1,690 deaths. For cases, the low was 82,186.
For hospitalizations, the low was 9,821.
LA Port Inbound Traffic Down Sharply YoY in February
by Calculated Risk on 3/17/2023 03:16:00 PM
Notes: The expansion to the Panama Canal was completed in 2016 (As I noted several years ago), and some of the traffic that used the ports of Los Angeles and Long Beach is probably going through the canal. This might be impacting TEUs on the West Coast.
Container traffic gives us an idea about the volume of goods being exported and imported - and usually some hints about the trade report since LA area ports handle about 40% of the nation's container port traffic.
The following graphs are for inbound and outbound traffic at the ports of Los Angeles and Long Beach in TEUs (TEUs: 20-foot equivalent units or 20-foot-long cargo container).
To remove the strong seasonal component for inbound traffic, the first graph shows the rolling 12-month average.
 Click on graph for larger image.
On a rolling 12-month basis, inbound traffic decreased 3.4% in February compared to the rolling 12 months ending in January. Outbound traffic decreased 0.8% compared to the rolling 12 months ending the previous month.
The 2nd graph is the monthly data (with a strong seasonal pattern for imports).
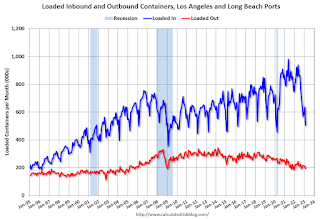 Usually imports peak in the July to October period as retailers import goods for the Christmas holiday, and then decline sharply and bottom in February or March depending on the timing of the Chinese New Year.
 Usually imports peak in the July to October period as retailers import goods for the Christmas holiday, and then decline sharply and bottom in February or March depending on the timing of the Chinese New Year.
Imports were down 38% YoY in February, and exports were down 9% YoY. The volume of containers unloaded last year was much stronger because of all the ships waiting to unload.
It is possible that exports have bottomed after declining for several years (even prior to the pandemic).
Lawler: Early Read on Existing Home Sales in February
by Calculated Risk on 3/17/2023 01:12:00 PM
Today, in the Calculated Risk Real Estate Newsletter:
Lawler: Early Read on Existing Home Sales in February 3rd Look at Local Housing Markets in February
A brief excerpt:
This is the third look at local markets in February. I’m tracking about 40 local housing markets in the US. Some of the 40 markets are states, and some are metropolitan areas. I’ll update these tables throughout the month as additional data is released.There is much more in the article. You can subscribe at https://calculatedrisk.substack.com/
...
California doesn’t report monthly inventory numbers, but they do report the change in months of inventory. Here is the press release from the California Association of Realtors® (C.A.R.): More favorable interest rates perk up California home sales for third straight month in February, C.A.R. reports• Existing, single-family home sales totaled 284,010 in February on a seasonally adjusted annualized rate, up 17.6 percent from January and down 33.2 percent from February 2022....
• February’s statewide median home price was $735,480, down 2.1 percent from January and down 4.8 percent from February 2022.
In February, sales in these markets were down 23.7%. In January, these same markets were down 34.1% YoY Not Seasonally Adjusted (NSA).
This is a significantly smaller YoY decline NSA than in January for these early reporting markets.
This data suggests NAR reported sales will rebound in February. This will still be a significant YoY decline, and the 18th consecutive month with a YoY decline.
...
More local markets to come!

Q1 GDP Tracking: Wide Range
by Calculated Risk on 3/17/2023 10:33:00 AM
From BofA:
On net, since the last weekly publication, this pushed up our 1Q US GDP tracking estimate from 0.7% q/q saar to 0.9% q/q saar and left 4Q unchanged at 2.9% q/q saar. [Mar 17th estimate]From Goldman:
emphasis added
We left our Q1 GDP tracking estimate unchanged at 2.6% (qoq ar). [Mar 16th estimate]And from the Altanta Fed: GDPNow
The GDPNow model estimate for real GDP growth (seasonally adjusted annual rate) in the first quarter of 2023 is 3.2 percent on March 16, unchanged from March 15 after rounding. After this morning's releases from the US Census Bureau and the US Bureau of Labor Statistics, an increase in the nowcast of first-quarter real net exports was offset by a decrease in the nowcast of first-quarter real residential investment growth. [Mar 16th estimate]
Industrial Production Unchanged in February
by Calculated Risk on 3/17/2023 09:21:00 AM
From the Fed: Industrial Production and Capacity Utilization
Industrial production was unchanged in February, and manufacturing output edged up 0.1 percent. The index for mining fell 0.6 percent, while the index for utilities rose 0.5 percent. At 102.6 percent of its 2017 average, total industrial production in February was 0.2 percent below its year-earlier level. Capacity utilization was unchanged in February at 78.0 percent, a rate that is 1.6 percentage points below its long-run (1972–2022) average.
emphasis added
 Click on graph for larger image.
This graph shows Capacity Utilization. This series is up from the record low set in April 2020, and above the level in February 2020 (pre-pandemic).
Capacity utilization at 78.0% is 1.6% below the average from 1972 to 2021. This was below consensus expectations.
Note: y-axis doesn't start at zero to better show the change.
 The second graph shows industrial production since 1967.
Industrial production was unchanged in February at 102.6. This is above the pre-pandemic level.
Industrial production was below consensus expectations and previous months were revised down.
Thursday, March 16, 2023
Friday: Industrial Production
by Calculated Risk on 3/16/2023 09:01:00 PM
 Note: Mortgage rates are from MortgageNewsDaily.com and are for top tier scenarios.
Friday:
• At 9:15 AM ET, The Fed will release Industrial Production and Capacity Utilization for February. The consensus is for a 0.4% increase in Industrial Production, and for Capacity Utilization to increase to 78.5%.
• At 10:00 AM, University of Michigan's Consumer sentiment index (Preliminary for March).
Realtor.com Reports Weekly Active Inventory Up 61% YoY; New Listings Down 16% YoY
by Calculated Risk on 3/16/2023 02:59:00 PM
Realtor.com has monthly and weekly data on the existing home market. Here is their weekly report released today from Chief economist Danielle Hale: Weekly Housing Trends View — Data Week Ending Mar 11, 2023
• Active inventory growth continued to climb with for-sale homes up 61% above one year ago. Inventories of for-sale homes rose, tying last week’s gain, which was the lowest we’ve seen since December. Instead of new sellers driving these increases, longer time on market is pushing the number of homes for sale higher. Of note, active listings at this time last year were at or near long-term lows.
...
• New listings–a measure of sellers putting homes up for sale–were again down, this week by 18% from one year ago. For 36 weeks, fewer homeowners put their homes on the market for sale than at this time one year ago. This week’s gap was smaller than last week’s, but the lack of new sellers is still a drag on home sales.
 Here is a graph of the year-over-year change in inventory according to realtor.com.
 Inventory is still up sharply year-over-year; however, the YoY increase has slowed recently.
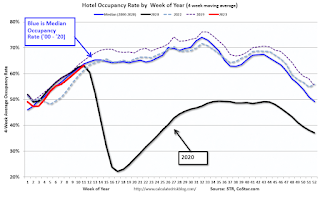
Hotels: Occupancy Rate Down 7.5% Compared to Same Week in 2019
by Calculated Risk on 3/16/2023 02:07:00 PM
Helped by the onset of spring break travel, U.S. hotel performance increased from the previous week, according to STR‘s latest data through March 11.The following graph shows the seasonal pattern for the hotel occupancy rate using the four-week average.
March 5-11, 2023 (percentage change from comparable weeks in 2022, 2019):
• Occupancy: 64.7% (+2.8%, -7.5%)
• Average daily rate (ADR): $158.20 (+8.1%, +16.6%)
• Revenue per available room (RevPAR): $102.38 (+11.1%, +7.8%)
emphasis added
NOTE: Last year, the occupancy rate was close to normal after the first quarter (depressed due to a surge in COVID), so STR will only be comparing to 2022 after Q1.
 Click on graph for larger image.
The red line is for 2023, black is 2020, blue is the median, and dashed light blue is for 2022. Dashed purple is 2019 (STR is comparing to a strong year for hotels).
 Click on graph for larger image.
The red line is for 2023, black is 2020, blue is the median, and dashed light blue is for 2022. Dashed purple is 2019 (STR is comparing to a strong year for hotels).
The 4-week average of the occupancy rate is close to the median rate for the previous 20 years (Blue).
Note: Y-axis doesn't start at zero to better show the seasonal change.
The 4-week average of the occupancy rate will increase seasonally for a couple more weeks and then move more sideways until the Summer.


