 RSS Feed
 by Calculated Risk on 2/04/2023 02:11:00 PM
Saturday, February 04, 2023
Real Estate Newsletter Articles this Week: Case-Shiller: National House Price Index "Continued to Decline"
At the Calculated Risk Real Estate Newsletter this week:
• Case-Shiller: National House Price Index "Continued to Decline" to 7.7% year-over-year increase in November
• Rents Continue to Decline; "Apartment Market Loosens"
• Inflation Adjusted House Prices 3.6% Below Peak
• Lawler: Net Home Orders and Sales Cancellations of Large Publicly-Traded Home Builders
• Lawler: D.R. Horton (DHI) Net Order Price Declined "Roughly" 10% from Peak
This is usually published 4 to 6 times a week and provides more in-depth analysis of the housing market.
You can subscribe at https://calculatedrisk.substack.com/
Most content is available for free (and no Ads), but please subscribe!
Schedule for Week of February 5, 2023
by Calculated Risk on 2/04/2023 08:11:00 AM
This will be light week for economic data.
The key report this week is the December trade deficit.
----- Monday, February 6th -----
No major economic releases scheduled.
----- Tuesday, February 7th -----
8:00 AM ET: Corelogic House Price index for December.
 8:30 AM: Trade Balance report for December from the Census Bureau.
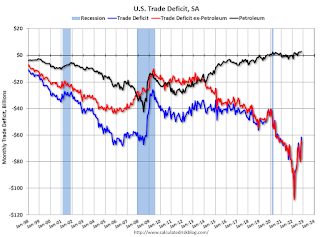
This graph shows the U.S. trade deficit, with and without petroleum, through the most recent report. The blue line is the total deficit, and the black line is the petroleum deficit, and the red line is the trade deficit ex-petroleum products.
The consensus is the trade deficit to be $68.5 billion. The U.S. trade deficit was at $61.5 billion in November.
12:40 PM, Discussion Fed Chair Jerome Powell, Conversation with David Rubenstein, Chairman of the Economic Club of Washington, D.C. at the Economic Club of Washington, D.C.
----- Wednesday, February 8th -----
7:00 AM ET: The Mortgage Bankers Association (MBA) will release the results for the mortgage purchase applications index.
----- Thursday, February 9th -----
8:30 AM: The initial weekly unemployment claims report will be released. The consensus is for 194 thousand initial claims, up from 183 thousand last week.
----- Friday, February 10th -----
10:00 AM: University of Michigan's Consumer sentiment index (Preliminary for February). The consensus is for a reading of 67.0.
No major economic releases scheduled.
8:00 AM ET: Corelogic House Price index for December.
 8:30 AM: Trade Balance report for December from the Census Bureau.
 This graph shows the U.S. trade deficit, with and without petroleum, through the most recent report. The blue line is the total deficit, and the black line is the petroleum deficit, and the red line is the trade deficit ex-petroleum products.
The consensus is the trade deficit to be $68.5 billion. The U.S. trade deficit was at $61.5 billion in November.
12:40 PM, Discussion Fed Chair Jerome Powell, Conversation with David Rubenstein, Chairman of the Economic Club of Washington, D.C. at the Economic Club of Washington, D.C.
7:00 AM ET: The Mortgage Bankers Association (MBA) will release the results for the mortgage purchase applications index.
8:30 AM: The initial weekly unemployment claims report will be released. The consensus is for 194 thousand initial claims, up from 183 thousand last week.
10:00 AM: University of Michigan's Consumer sentiment index (Preliminary for February). The consensus is for a reading of 67.0.
Friday, February 03, 2023
COVID Feb 3, 2023: Update on Cases, Hospitalizations and Deaths
by Calculated Risk on 2/03/2023 09:24:00 PM
 Note: Mortgage rates are from MortgageNewsDaily.com and are for top tier scenarios.
On COVID (focus on hospitalizations and deaths). Data is now weekly.
| COVID Metrics | ||||
|---|---|---|---|---|
| Now | Week Ago | Goal | ||
| New Cases per Week2 | 280,911 | 301,243 | ≤35,0001 | |
| Hospitalized2 | 25,603 | 29,306 | ≤3,0001 | |
| Deaths per Week2 | 3,452 | 3,792 | ≤3501 | |
| 1my goals to stop weekly posts, 2Weekly for Cases, Currently Hospitalized, and Deaths 🚩 Increasing number weekly for Cases, Hospitalized, and Deaths ✅ Goal met. | ||||
 Click on graph for larger image.
This graph shows the weekly (columns) number of deaths reported.
January was the worst month for the previous two years, and January 2023 saw a much smaller increase in deaths.
AAR: January Rail Carloads Increased and Intermodal Decreased Year-over-year
by Calculated Risk on 2/03/2023 04:17:00 PM
From the Association of American Railroads (AAR) Rail Time Indicators. Graphs and excerpts reprinted with permission.
U.S. rail traffic started January 2023 with both discouraging and encouraging aspects.
On the encouraging side, total U.S. carloads rose 2.2% in January 2023. January 2022 was the worst January for total carloads in our records that begin in 1988. Still, growth is better than a decline.
...
On the discouraging side, January 2023 was the worst January for intermodal since 2013, with originations down 8.1% from last year. In recent months, major retailers have cut inventories; consumer spending — especially on goods — has contracted; and truck rates have fallen.
emphasis added
 Click on graph for larger image.
This graph from the Rail Time Indicators report shows the six-week average of U.S. Carloads in 2021, 2022 and 2022:
The good news is total U.S. carloads were up 2.2%, or 19,827 carloads, in January 2023 over January 2022. The bad news is January 2022 was the worst January for total carloads in our records that go back to 1988, so a 2.2% increase — while certainly better than some alternatives — is less impressive than it could be.
 The second graph shows the six-week average (not monthly) of U.S. intermodal in 2021, 2022 and 2023: (using intermodal or shipping containers):
U.S. railroads also originated 919,928 intermodal containers and trailers in January 2023, down 8.1%, or 81,443 units, from January 2022. Intermodal volume averaged 229,982 units per week in January 2023, the fewest for January since 2013. January 2023 was the first time since March 2017 that the number of originated carloads exceeded the number of originated intermodal units on U.S. railroads.
Lawler: Net Home Orders and Sales Cancellations of Large Publicly-Traded Home Builders
by Calculated Risk on 2/03/2023 01:04:00 PM
Today, in the Calculated Risk Real Estate Newsletter: Lawler: Net Home Orders and Sales Cancellations of Large Publicly-Traded Home Builders
A brief excerpt:
Note from Bill McBride: The data below via Tom Lawler illustrates the point I’ve made about the Census Bureau overstating sales when cancellation rates are rising.There is much more in the article. You can subscribe at https://calculatedrisk.substack.com/
...
From housing economist Tom Lawler:
Below is a table of net home orders (gross orders less sales cancellations) of selected publicly-traded home builders for last quarter compared to the comparable quarter of 2021. (Note: sales cancellations from some builders are derived from reported cancellation rates, and may be off due to rounding). Also shown are gross orders, as well as unadjusted new home sales reported by Census.
As the table shows, net orders of these builders last quarter were down 41.3% YOY, sales cancellations were up 58.7%, and gross orders were down 27.5%. Census preliminary estimates of new home sales last quarter, in contrast, were down 19.3% YOY.

Comments on January Employment Report
by Calculated Risk on 2/03/2023 09:44:00 AM
This was a strong report, and the revisions show job growth was stronger over the last year than originally reported. With revisions: The 4.81 million jobs added, 2022 was the 2nd best year for job growth in US history behind only 2021 with 7.27 million.
The headline jobs number in the January employment report was well above expectations, and employment for the previous two months was revised up by 71,000, combined. The participation rate increased, and the unemployment rate decreased to 3.4% - the lowest rate since May 1969 (over 50 years ago!)
Leisure and hospitality gained 128 thousand jobs in January. At the beginning of the pandemic, in March and April of 2020, leisure and hospitality lost 8.2 million jobs, and are now down 495 thousand jobs since February 2020. So, leisure and hospitality has now added back about 94% all of the jobs lost in March and April 2020.
Construction employment increased 25 thousand and is now 276 thousand above the pre-pandemic level.
Manufacturing added 19 thousand jobs and is now 214 thousand above the pre-pandemic level.
In January, the year-over-year employment change was 4.97 million jobs.
Prime (25 to 54 Years Old) Participation
 Since the overall participation rate is impacted by both cyclical (recession) and demographic (aging population, younger people staying in school) reasons, here is the employment-population ratio for the key working age group: 25 to 54 years old.
The 25 to 54 participation rate increased in January to 82.7% from 82.4% in December, and the 25 to 54 employment population ratio increased to 80.2% from 80.1% the previous month.
Both are close to the pre-pandemic levels and indicate almost all of the prime age workers have returned to the labor force.
Average Hourly Wages
 The graph shows the nominal year-over-year change in "Average Hourly Earnings" for all private employees from the Current Employment Statistics (CES).
Average Hourly Wages
 The graph shows the nominal year-over-year change in "Average Hourly Earnings" for all private employees from the Current Employment Statistics (CES).
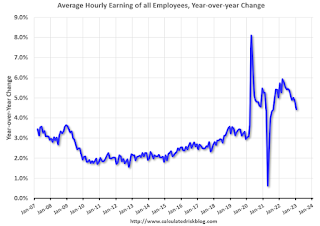
 There was a huge increase at the beginning of the pandemic as lower paid employees were let go, and then the pandemic related spike reversed a year later.
Wage growth has trended down after peaking at 5.9% YoY in March 2022 and was at 4.4% YoY in January, down from 4.6% in December.
Part Time for Economic Reasons
 From the BLS report:
These workers are included in the alternate measure of labor underutilization (U-6) that increased to 6.6% from 6.5% in the previous month. This is down from the record high in April 22.9% and last month was the lowest level on record (seasonally adjusted) (series started in 1994). This measure is below the level in February 2020 (pre-pandemic).
Unemployed over 26 Weeks
 This graph shows the number of workers unemployed for 27 weeks or more.
According to the BLS, there are 1.111 million workers who have been unemployed for more than 26 weeks and still want a job, up from 1.069 million the previous month.
This is at pre-pandemic levels.
Summary:
The headline monthly jobs number was well above expectations and employment for the previous two months was revised up by 71,000, combined. The annual benchmark revision indicated job growth was significantly stronger than originally reported.
Wage growth has trended down after peaking at 5.9% YoY in March 2022 and was at 4.4% YoY in January, down from 4.6% in December.
Part Time for Economic Reasons
 From the BLS report:
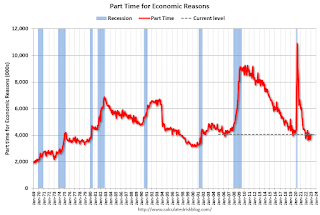
"The number of persons employed part time for economic reasons, at 4.1 million, was little changed in January. These individuals, who would have preferred full-time employment, were working part time because their hours had been reduced or they were unable to find full-time jobs."The number of persons working part time for economic reasons increased in January to 4.050 million from 3.878 million in December. This is at pre-recession levels.
These workers are included in the alternate measure of labor underutilization (U-6) that increased to 6.6% from 6.5% in the previous month. This is down from the record high in April 22.9% and last month was the lowest level on record (seasonally adjusted) (series started in 1994). This measure is below the level in February 2020 (pre-pandemic).
Unemployed over 26 Weeks
 This graph shows the number of workers unemployed for 27 weeks or more.
 According to the BLS, there are 1.111 million workers who have been unemployed for more than 26 weeks and still want a job, up from 1.069 million the previous month.
This is at pre-pandemic levels.
Summary:
The headline monthly jobs number was well above expectations and employment for the previous two months was revised up by 71,000, combined. The annual benchmark revision indicated job growth was significantly stronger than originally reported.
The headline unemployment rate decreased to 3.4%, the lowest rate since 1969.
Overall, this was a strong employment report.
January Employment Report: 517 thousand Jobs, 3.4% Unemployment Rate
by Calculated Risk on 2/03/2023 08:49:00 AM
From the BLS:
Total nonfarm payroll employment rose by 517,000 in January, and the unemployment rate changed little at 3.4 percent, the U.S. Bureau of Labor Statistics reported today. Job growth was widespread, led by gains in leisure and hospitality, professional and business services, and health care. Employment also increased in government, partially reflecting the return of workers from a strike.
...
The change in total nonfarm payroll employment for November was revised up by 34,000, from +256,000 to +290,000, and the change for December was revised up by 37,000, from +223,000 to +260,000. With these revisions, employment gains in November and December combined were 71,000 higher than previously reported.
emphasis added
 Click on graph for larger image.
The first graph shows the job losses from the start of the employment recession, in percentage terms.
The current employment recession was by far the worst recession since WWII in percentage terms.
Total jobs are now 2.70 million above pre-pandemic levels. This is the last update for this graph this employment cycle.
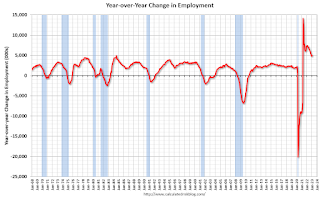 The second graph shows the year-over-year change in total non-farm employment since 1968.
In January, the year-over-year change was 4.97 million jobs. Employment was up significantly year-over-year.
Total payrolls increased by 517 thousand in January. Private payrolls increased by 443 thousand, and public payrolls increased 74 thousand.
Payrolls for November and December were revised up 71 thousand, combined.
The third graph shows the employment population ratio and the participation rate.
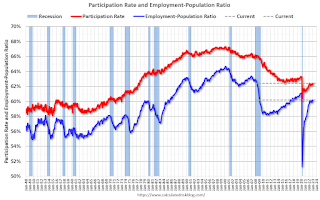 The Labor Force Participation Rate increased to 62.4% in January, from 62.3% in December. This is the percentage of the working age population in the labor force.
The Employment-Population ratio increased to 60.2% from 60.1% (blue line).
I'll post the 25 to 54 age group employment-population ratio graph later.
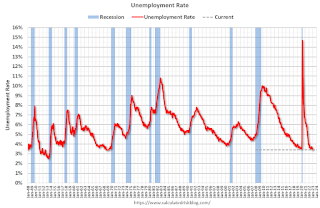 The fourth graph shows the unemployment rate.
The unemployment rate decreased in January to 3.4% from 3.5% in December.
This was well above consensus expectations; and November and December payrolls were revised up by 71,000 combined.
On the annual benchmark revision:I'll have more later ...
 The second graph shows the year-over-year change in total non-farm employment since 1968.
In January, the year-over-year change was 4.97 million jobs. Employment was up significantly year-over-year.
Total payrolls increased by 517 thousand in January. Private payrolls increased by 443 thousand, and public payrolls increased 74 thousand.
Payrolls for November and December were revised up 71 thousand, combined.
The third graph shows the employment population ratio and the participation rate.
 The Labor Force Participation Rate increased to 62.4% in January, from 62.3% in December. This is the percentage of the working age population in the labor force.
 The Employment-Population ratio increased to 60.2% from 60.1% (blue line).
I'll post the 25 to 54 age group employment-population ratio graph later.
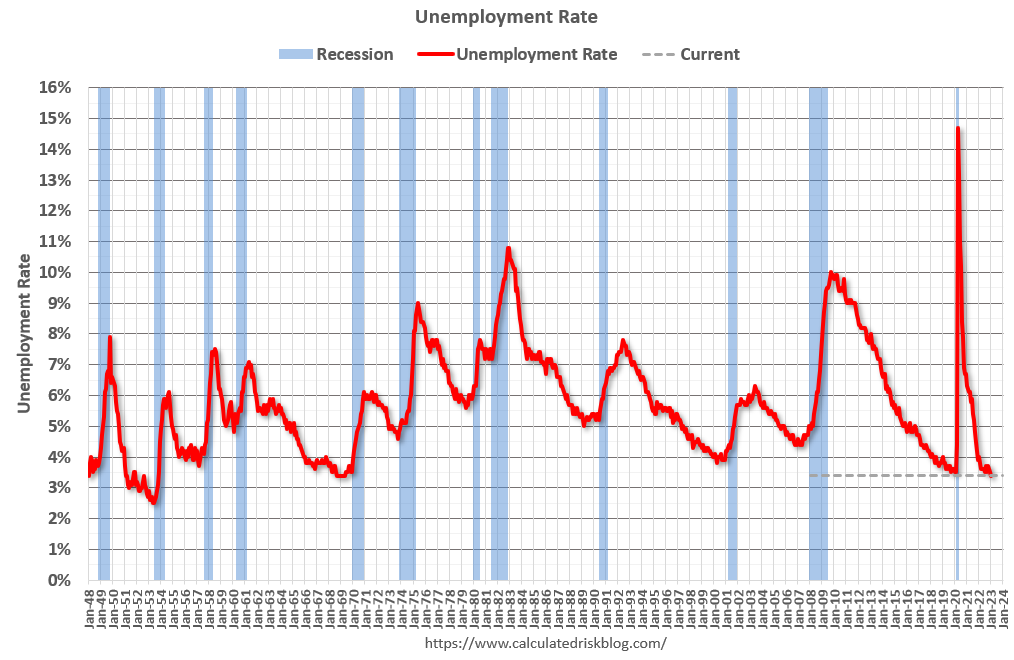 The fourth graph shows the unemployment rate.
 The unemployment rate decreased in January to 3.4% from 3.5% in December.
This was well above consensus expectations; and November and December payrolls were revised up by 71,000 combined.
The total nonfarm employment level for March 2022 was revised upward by 568,000 (+506,000 on a not seasonally adjusted basis, or +0.3 percent). The average not seasonally adjusted benchmark revision (in absolute terms) over the past 10 years is 0.1 percent.
Thursday, February 02, 2023
Friday: Employment Report
by Calculated Risk on 2/02/2023 08:56:00 PM
 Note: Mortgage rates are from MortgageNewsDaily.com and are for top tier scenarios.
Friday:
• At 8:30 AM ET, Employment Report for December. The consensus is for 185,000 jobs added, and for the unemployment rate to increase to 3.6%.
• At 10:00 AM, ISM Services Index for January.
January Employment Preview
by Calculated Risk on 2/02/2023 12:41:00 PM
On Friday at 8:30 AM ET, the BLS will release the employment report for January. The consensus is for 185,000 jobs added, and for the unemployment rate to increase to 3.6%.
From BofA economists:
"Nonfarm payrolls likely rose by 225k in January, little changed from the December increase. Payrolls were likely boosted by the end of the strike by University of California workers in late December. The strike affected 36k workers according to the BLS and likely largely explained the ~24k drop in state education employment in December. These workers should return to payrolls in January."From Goldman Sachs:
"We continue to expect a strong employment report, and we left our nonfarm payroll forecast unchanged at +300k (mom sa)."
 Click on graph for larger image.
• First, as of December there were 1.24 million more jobs than in February 2020 (the month before the pandemic).
This graph shows the job losses from the start of the employment recession, in percentage terms. As of August 2022, the total number of jobs had returned.
• Annual Benchmark Revision: The benchmark revision for 2021 will be released with the January employment report. The above graph doesn't include the preliminary benchmark revision that showed there were 462 thousand more jobs than originally reported in March 2022.
• ADP Report: The ADP employment report showed 106,000 private sector jobs were added in January. This suggests job gains below consensus expectations. ADP chief economist Nela Richardson noted: "In January, we saw the impact of weather-related disruptions on employment during our reference week. Hiring was stronger during other weeks of the month, in line with the strength we saw late last year."
• ISM Surveys: Note that the ISM indexes are diffusion indexes based on the number of firms hiring (not the number of hires). The ISM® manufacturing employment index decreased in January to 50.6%, down from 50.8% last month. This would suggest the number of manufacturing jobs was mostly unchanged in January.
The ISM® services employment index for January has not been released yet.
• Unemployment Claims: The weekly claims report showed a decrease in the number of initial unemployment claims during the reference week (includes the 12th of the month) from 216,000 in December to 192,000 in January. This would usually suggest fewer layoffs in January than in December. In general, weekly claims were below expectations in January.
• COVID: As far as the pandemic, the number of weekly cases during the reference week in January was around 332,000, down from 458,000 in December.
• Weather: As ADP noted, there was severe weather during the reference week. After the release, I'll check the San Francisco Fed estimate of Weather-Adjusted Change in Total Nonfarm Employment.
• Conclusion: This employment report is especially hard to predict. There is a significant seasonal adjustment for January (there are always a large number of jobs lost in January NSA). And there are other factors - severe weather, end of a strike - that will likely impact hiring. My guess is the report will be below consensus.
Inflation Adjusted House Prices 3.6% Below Peak
by Calculated Risk on 2/02/2023 09:45:00 AM
Today, in the Calculated Risk Real Estate Newsletter: Inflation Adjusted House Prices 3.8% Below Peak; Price-to-rent index is 6.1% below recent peak
Excerpt:
It has been 17 years since the bubble peak. In the November Case-Shiller house price index released on Tuesday, the seasonally adjusted National Index (SA), was reported as being 61% above the bubble peak in 2006. However, in real terms, the National index (SA) is about 12% above the bubble peak (and historically there has been an upward slope to real house prices). The composite 20, in real terms, is about 2% above the bubble peak.
Both indexes have declined for six consecutive months in real terms (inflation adjusted).
People usually graph nominal house prices, but it is also important to look at prices in real terms. As an example, if a house price was $200,000 in January 2000, the price would be almost $339,000 today adjusted for inflation (69.5% increase). That is why the second graph below is important - this shows "real" prices. ...
In October 2004, Fed economist John Krainer and researcher Chishen Wei wrote a Fed letter on price to rent ratios: House Prices and Fundamental Value. Kainer and Wei presented a price-to-rent ratio using the OFHEO house price index and the Owners' Equivalent Rent (OER) from the BLS.
Note that OER is lagging behind other measures of rent.
Here is a similar graph using the Case-Shiller National and Composite 20 House Price Indexes. This graph shows the price to rent ratio (January 2000 = 1.0). The price-to-rent ratio had been moving more sideways but picked up significantly following the onset of the pandemic.
On a price-to-rent basis, the Case-Shiller National and Composite 20 indexes declined again in November for the sixth consecutive month. The price-to-rent index for the National index is off 6.1% from the recent peak, and the Composite 20 based index is off 7.7%.

There is much more in the article. You can subscribe at https://calculatedrisk.substack.com/


