by Calculated Risk on 2/03/2023 04:17:00 PM
Friday, February 03, 2023
AAR: January Rail Carloads Increased and Intermodal Decreased Year-over-year
From the Association of American Railroads (AAR) Rail Time Indicators. Graphs and excerpts reprinted with permission.
U.S. rail traffic started January 2023 with both discouraging and encouraging aspects.
On the encouraging side, total U.S. carloads rose 2.2% in January 2023. January 2022 was the worst January for total carloads in our records that begin in 1988. Still, growth is better than a decline.
...
On the discouraging side, January 2023 was the worst January for intermodal since 2013, with originations down 8.1% from last year. In recent months, major retailers have cut inventories; consumer spending — especially on goods — has contracted; and truck rates have fallen.
emphasis added
 Click on graph for larger image.
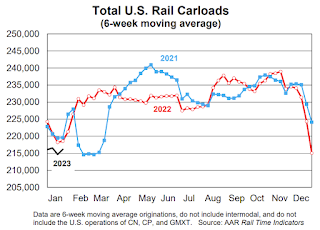
This graph from the Rail Time Indicators report shows the six-week average of U.S. Carloads in 2021, 2022 and 2022:
The good news is total U.S. carloads were up 2.2%, or 19,827 carloads, in January 2023 over January 2022. The bad news is January 2022 was the worst January for total carloads in our records that go back to 1988, so a 2.2% increase — while certainly better than some alternatives — is less impressive than it could be.
 The second graph shows the six-week average (not monthly) of U.S. intermodal in 2021, 2022 and 2023: (using intermodal or shipping containers):
U.S. railroads also originated 919,928 intermodal containers and trailers in January 2023, down 8.1%, or 81,443 units, from January 2022. Intermodal volume averaged 229,982 units per week in January 2023, the fewest for January since 2013. January 2023 was the first time since March 2017 that the number of originated carloads exceeded the number of originated intermodal units on U.S. railroads.


