 RSS Feed
 by Calculated Risk on 1/24/2023 08:33:00 PM
Tuesday, January 24, 2023
Wednesday: MBA Mortgage Applications, Architecture Billings
 Note: Mortgage rates are from MortgageNewsDaily.com and are for top tier scenarios.
Wednesday:
• At 7:00 AM ET, The Mortgage Bankers Association (MBA) will release the results for the mortgage purchase applications index.
• During the day, The AIA's Architecture Billings Index for December (a leading indicator for commercial real estate).
BLS: Alaska and Pennsylvania Set New Record Series Low Unemployment rates in December
by Calculated Risk on 1/24/2023 11:07:00 AM
From the BLS: Regional and State Employment and Unemployment Summary
Unemployment rates were higher in December in 7 states, lower in 5 states, and stable in 38 states and the District of Columbia, the U.S. Bureau of Labor Statistics reported today. Thirty-five states and the District had jobless rate decreases from a year earlier, 4 states had increases, and 11 states had little change.Two states set new series record low unemployment rates in December.
...
Utah had the lowest jobless rate in December, 2.2 percent. The next lowest rates were in North Dakota and South Dakota, 2.3 percent each. The rates in Alaska (4.3 percent) and Pennsylvania (3.9 percent) set new series lows. (All state series begin in 1976.) Nevada had the highest unemployment rate, 5.2 percent.
emphasis added
Final Look at Local Housing Markets in December
by Calculated Risk on 1/24/2023 08:48:00 AM
Today, in the Calculated Risk Real Estate Newsletter: Final Look at Local Housing Markets in December
A brief excerpt:
The big story for December existing home sales was the sharp year-over-year (YoY) decline in sales. Another key story was that new listings were down further YoY in December as many potential sellers are locked into their current home (low mortgage rate). And active inventory increased sharply YoY.There is much more in the article. You can subscribe at https://calculatedrisk.substack.com/
This is the final look at local markets in December. I’m tracking about 40 local housing markets in the US. Some of the 40 markets are states, and some are metropolitan areas. I update these tables throughout each month as additional data is released.
NOTE: Hopefully I’ll be adding more markets next month!
First, here is a table comparing the year-over-year Not Seasonally Adjusted (NSA) declines in sales this year from the National Association of Realtors® (NAR) with the local markets I track. So far, these measures have tracked closely. The NAR reported sales were down 36.3% NSA YoY in December.
...
More local data coming in February for activity in January!
My early expectation is we will see a somewhat smaller YoY sales decline in January, than in December, due to the decrease in mortgage rates in December (January sales are mostly for contracts signed in November and December).

Monday, January 23, 2023
Tuesday: Richmond Fed Mfg
by Calculated Risk on 1/23/2023 09:05:00 PM
 From Matthew Graham at Mortgage News Daily: Mortgage Rates Drift Slightly Higher
After hitting the lowest levels in 4 months at times over the past week, rates have drifted up a bit. There hasn't been much rhyme or reason behind the bounce. ... The week ahead is a bit of a wild card as there are no hotly anticipated events on tap. Some market participants might make a case that the first look at Q4 GDP on Thursday or the PCE inflation on Friday are exceptions to that claim, but they pale in comparison to next week's Fed announcement and Friday's jobs report. [30 year fixed 6.20%]Tuesday:
emphasis added
• At 10:00 AM ET, Richmond Fed Survey of Manufacturing Activity for January.
• Also at 10:00 AM, State Employment and Unemployment (Monthly) for December 2022.
MBA Survey: "Share of Mortgage Loans in Forbearance Remains Flat at 0.70% in December"
by Calculated Risk on 1/23/2023 04:00:00 PM
Note: This is as of December 31st.
From the MBA: Share of Mortgage Loans in Forbearance Remains Flat at 0.70% in December
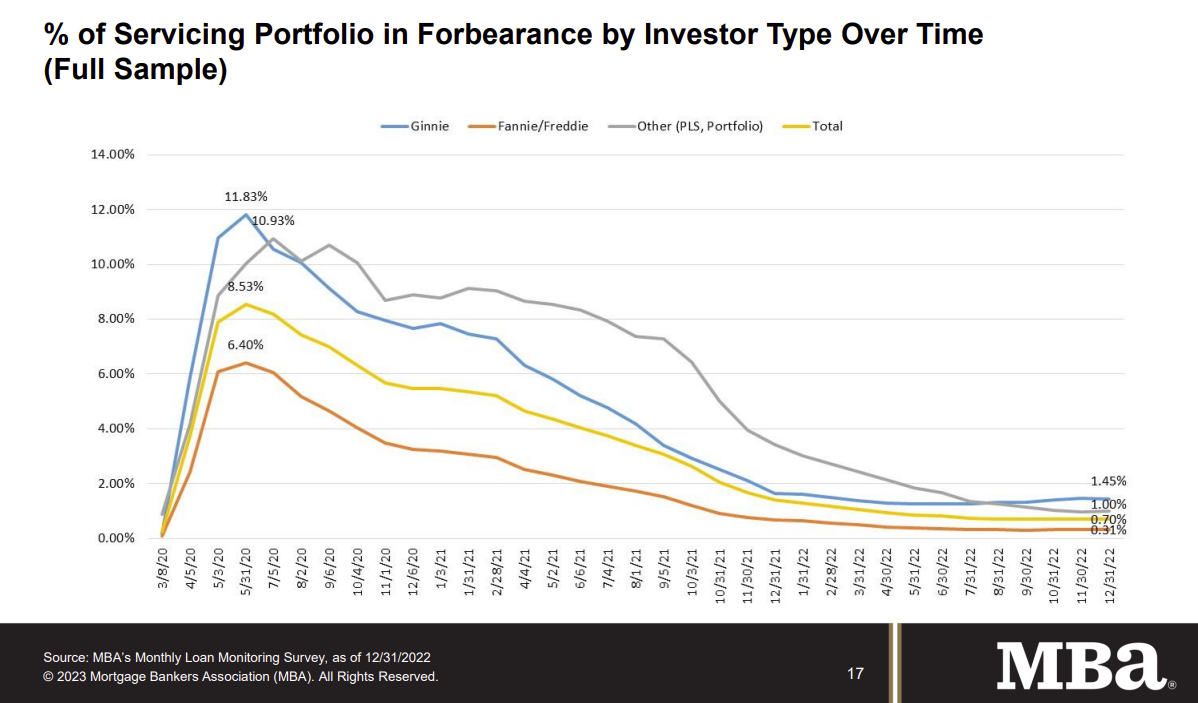
The Mortgage Bankers Association’s (MBA) monthly Loan Monitoring Survey revealed that the total number of loans now in forbearance remained flat relative to the prior month at 0.70% as of December 31, 2022. According to MBA’s estimate, 350,000 homeowners are in forbearance plans.
The share of Fannie Mae and Freddie Mac loans in forbearance decreased 1 basis point to 0.31%. Ginnie Mae loans in forbearance decreased 1 basis point to 1.45%, and the forbearance share for portfolio loans and private-label securities (PLS) increased 3 basis points to 1.00%.
“For three consecutive months, the forbearance rate has remained flat — an indicator that we may have reached a floor on further improvements,” said Marina Walsh, CMB, MBA’s Vice President of Industry Analysis. “New forbearance requests and re-entries continue to trickle in at about the same pace as forbearance exits. The overall performance of servicing portfolios was also flat compared to the previous month, but there was some deterioration in the performance of Ginnie Mae loans.”
Added Walsh, “Forbearance remains an option for struggling homeowners and its usage may continue, especially if unemployment increases as expected. MBA is forecasting for the unemployment rate to reach 5.2 percent in the second half of 2023, up from its current level of 3.5 percent.”
emphasis added
 Click on graph for larger image.
This graph shows the percent of portfolio in forbearance by investor type over time.
The share of forbearance plans had been decreasing, although the percent in forbearance was unchanged in November and December.
At the end of December, there were about 350,000 homeowners in forbearance plans.
LA Port Inbound Traffic Down 20% YoY in December
by Calculated Risk on 1/23/2023 01:18:00 PM
Notes: The expansion to the Panama Canal was completed in 2016 (As I noted several years ago), and some of the traffic that used the ports of Los Angeles and Long Beach is probably going through the canal. This might be impacting TEUs on the West Coast.
Container traffic gives us an idea about the volume of goods being exported and imported - and usually some hints about the trade report since LA area ports handle about 40% of the nation's container port traffic.
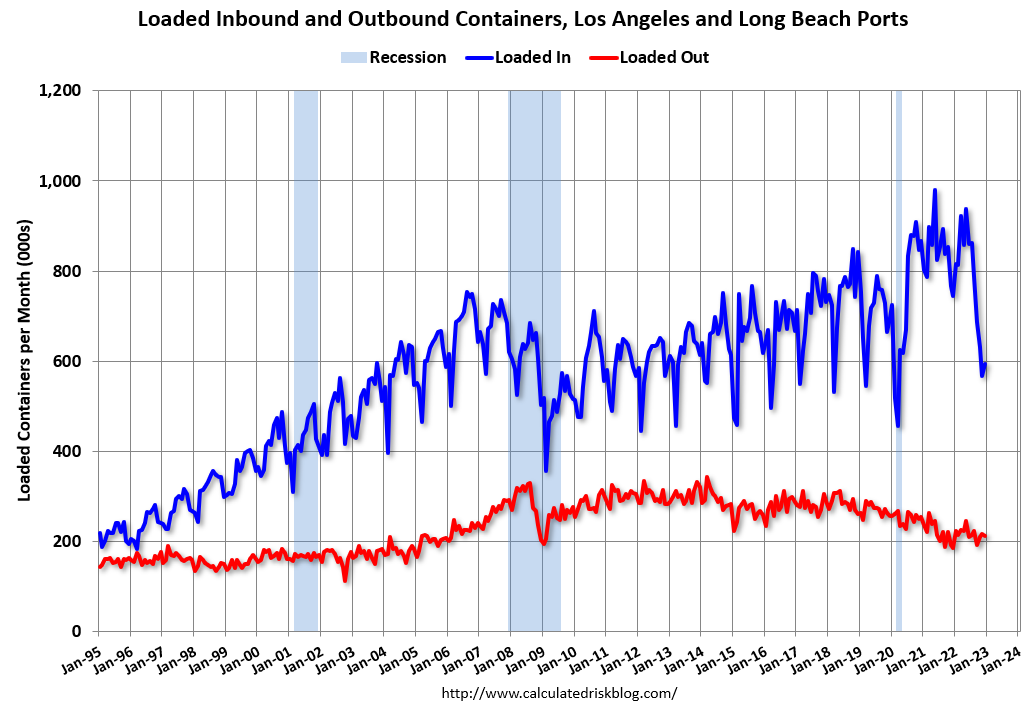
The following graphs are for inbound and outbound traffic at the ports of Los Angeles and Long Beach in TEUs (TEUs: 20-foot equivalent units or 20-foot-long cargo container).
To remove the strong seasonal component for inbound traffic, the first graph shows the rolling 12-month average.
 Click on graph for larger image.
On a rolling 12-month basis, inbound traffic decreased 1.6% in December compared to the rolling 12 months ending in November. Outbound traffic increased 1.1% compared to the rolling 12 months ending the previous month.
The 2nd graph is the monthly data (with a strong seasonal pattern for imports).
 Usually imports peak in the July to October period as retailers import goods for the Christmas holiday, and then decline sharply and bottom in February or March depending on the timing of the Chinese New Year.
 Usually imports peak in the July to October period as retailers import goods for the Christmas holiday, and then decline sharply and bottom in February or March depending on the timing of the Chinese New Year.
Imports were down 20% YoY in December, and exports were up 15% YoY.
It is possible that exports have bottomed after declining for several years (even prior to the pandemic).
1.51 million Total Housing Completions in 2022 including Manufactured Homes; Most Since 2007
by Calculated Risk on 1/23/2023 09:36:00 AM
Today, in the CalculatedRisk Real Estate Newsletter: 1.51 million Total Housing Completions in 2022 including Manufactured Homes; Most Since 2007
Excerpt:
Although total housing starts decreased 3.0% in 2022 compared to 2021, completions increased year-over-year. Construction delays impacted completions in 2022, and that left a record number of housing units under construction. However, there still were 1.507 million total completions and placements in 2021, the most since 2007.There is much more in the article. You can subscribe at https://calculatedrisk.substack.com/ Please subscribe!
Not counting Manufactured homes, there are 1.392 million completions in 2022, up from 1.341 million in 2021, and also the most since 2007.
This graph shows total housing completions and placements since 1968 through 2022. Note that the net addition to the housing stock is less because of demolitions and destruction of older housing units. The housing start report last week indicated 1,021.9 thousand single family completions in 2022, 10.0 thousand in 2-to-4 units, and 360.4 thousand in 5+ units.

Housing January 23rd Weekly Update: Inventory Decreased Slightly Week-over-week
by Calculated Risk on 1/23/2023 08:30:00 AM
Altos reports inventory was down 0.1% week-over-week. Usually inventory bottoms in February; in 2022, inventory bottomed in early March. It is possible that inventory is already near a bottom for the year!
Here are the same week inventory changes for the last five years:
2023: -0.6K
2022: -6.8K
2021: -8.2K
2020: +2.1K
2019: +10.3K
 Click on graph for larger image.
This inventory graph is courtesy of Altos Research.
As of January 20th, inventory was at 472 thousand (7-day average), compared to 473 thousand the prior week.

The red line is for 2023. The black line is for 2019. Note that inventory is up from the previous two years (the record low was in 2022), but still well below normal levels.
Inventory was up 70.5% compared to the same week in 2022, and down 42.8% compared to the same week in 2019.
A key will be when inventory starts increasing in 2023 - so far inventory has essentially been flat for the first three weeks of 2023.
Mike Simonsen discusses this data regularly on Youtube.
Sunday, January 22, 2023
Sunday Night Futures
by Calculated Risk on 1/22/2023 06:43:00 PM
Weekend:
• Schedule for Week of January 22, 2023
Monday:
• No major economic releases are scheduled.
From CNBC: Pre-Market Data and Bloomberg futures S&P 500 and DOW futures are down slightly (fair value).
Oil prices were up over the last week with WTI futures at $81.64 per barrel and Brent at $87.63 per barrel. A year ago, WTI was at $85, and Brent was at $90 - so WTI oil prices are DOWN 5% year-over-year.
Here is a graph from Gasbuddy.com for nationwide gasoline prices. Nationally prices are at $3.41 per gallon. A year ago, prices were at $3.30 per gallon, so gasoline prices are up $0.11 per gallon year-over-year.
The Normal Seasonal Pattern for Median House Prices
by Calculated Risk on 1/22/2023 09:24:00 AM
Earlier, in the CalculatedRisk Real Estate Newsletter on December existing home sales, NAR: Existing-Home Sales Decreased to 4.02 million SAAR in December, I mentioned that the median price was down more than normal seasonally.
Below is a table of the seasonal pattern over the last several years.
Seasonally prices typically peak in June (closed sales for contracts signed mostly in April and May).
And seasonally prices usually bottom the following January (contracts signed in November and December). I've included the decline from the peak for December for each year to compare to 2022.
| 2018 | 2019 | 2020 | 2021 | 2022 | |
|---|---|---|---|---|---|
| Peak Month | June | June | Oct | June | June |
| December | -7.0% | -3.8% | -0.7% | -2.2% | -11.3% |
| January | -8.9% | -6.7% | -1.2% | -3.4% | N/A |
In 2020, prices increased late into the year and only decline slightly seasonally (the start of the pandemic buying boom), and in 2021, median prices only declined about 3% from peak to bottom.
But the decline this year, 11.3% so far, is larger than in the pre-pandemic years. And we will probably see a further decline in January and maybe in February - putting median prices down year-over-year soon.


