 RSS Feed
 by Calculated Risk on 12/14/2022 09:29:00 AM
Wednesday, December 14, 2022
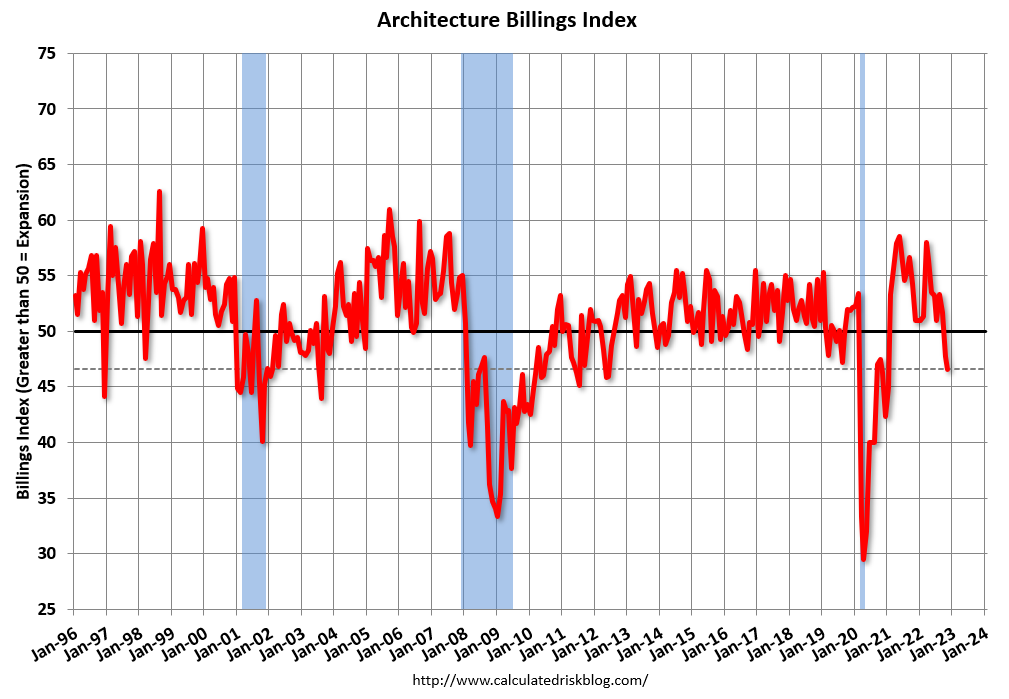
AIA: Architecture Billings Index Declines Further in November
Note: This index is a leading indicator primarily for new Commercial Real Estate (CRE) investment.
From the AIA: Demand for design services continues to slow
Demand for design services from architecture firms continued to decrease in November, according to a new report from The American Institute of Architects (AIA).
The pace of decline during November accelerated from October, posting an Architecture Billings Index (ABI) score of 46.6 from 47.7 (any score below 50 indicates a decline in firm billings). The pace of inquiries into new projects slowed, but remained positive with a score of 52.0, however new design contracts remained in negative territory with a score of 46.9.
“Given the slowdown in new project work, many architecture firms will rely on their near record levels of backlogs to support revenue,” said AIA Chief Economist, Kermit Baker, Hon. AIA, PhD. “Still, firm leaders remain largely optimistic about future business trends. Almost two-thirds of architecture firms project that 2023 will be either a good year or great year for their firm.”
...
• Regional averages: South (50.5); Midwest (47.6); West (45.8); Northeast (42.4)
• Sector index breakdown: mixed practice (51.5); institutional (47.7); multi-family residential (46.1); commercial/industrial (44.2)
emphasis added
 Click on graph for larger image.
This graph shows the Architecture Billings Index since 1996. The index was at 46.6 in November, down from 47.7 in October. Anything below 50 indicates contraction in demand for architects' services.
Note: This includes commercial and industrial facilities like hotels and office buildings, multi-family residential, as well as schools, hospitals and other institutions.
This index had been positive for 20 consecutive months but indicated a decline the last two months. This index usually leads CRE investment by 9 to 12 months, so this index suggests a pickup in CRE investment in early 2023, but if the weakness persists - a slowdown in CRE investment later in 2023.
Note that multi-family billing turned down in September and has been negative for three consecutive months, and if that continues, we will see a downturn in multi-family starts sometime in 2023.
MBA: Mortgage Applications Increase in Latest Weekly Survey
by Calculated Risk on 12/14/2022 07:00:00 AM
From the MBA: Mortgage Applications Decrease in Latest MBA Weekly Survey
Mortgage applications increased 3.2 percent from one week earlier, according to data from the Mortgage Bankers Association’s (MBA) Weekly Mortgage Applications Survey for the week ending December 9, 2022.
... The Refinance Index increased 3 percent from the previous week and was 85 percent lower than the same week one year ago. The seasonally adjusted Purchase Index increased 4 percent from one week earlier. The unadjusted Purchase Index decreased 1 percent compared with the previous week and was 38 percent lower than the same week one year ago.
“Mortgage rates increased slightly after a month of declines, as financial markets reacted to mixed signals regarding inflation and the Federal Reserve’s next policy moves. The 30-year fixed rate inched to 6.42 percent, which is still close to the lowest rate in a month,” said Joel Kan, MBA’s Vice President and Deputy Chief Economist. “Overall applications increased, driven by increases in purchase and refinance activity. However, with rates more than three percentage points higher than a year ago, both purchase and refinance applications are still well behind last year’s pace.”
Added Kan, “The ongoing moderation in home-price growth, along with further declines in mortgage rates, may encourage more buyers to return to the market in the coming months.”
...
The average contract interest rate for 30-year fixed-rate mortgages with conforming loan balances ($647,200 or less) increased to 6.42 percent from 6.41 percent, with points increasing to 0.64 from 0.63 (including the origination fee) for 80 percent loan-to-value ratio (LTV) loans.
emphasis added
 Click on graph for larger image.
The first graph shows the refinance index since 1990.
With higher mortgage rates, the refinance index has declined sharply this year.
The refinance index is up slightly from the low in November 2022 (an extreme low).
The second graph shows the MBA mortgage purchase index
 According to the MBA, purchase activity is down 38% year-over-year unadjusted.
The purchase index is at the pandemic low and up from the low in October 2022.
Note: Red is a four-week average (blue is weekly).
Note: Red is a four-week average (blue is weekly).
Tuesday, December 13, 2022
Wednesday: FOMC Statement and Press Conference
by Calculated Risk on 12/13/2022 09:01:00 PM
 Note: Mortgage rates are from MortgageNewsDaily.com and are for top tier scenarios.
Wednesday:
• At 7:00 AM ET, The Mortgage Bankers Association (MBA) will release the results for the mortgage purchase applications index.
• During the day, The AIA's Architecture Billings Index for November (a leading indicator for commercial real estate).
• At 2:00 PM, FOMC Meeting Announcement. The FOMC is expected to announce a 50 bp hike in the Fed Funds rate.
• At 2:00 PM, FOMC Forecasts This will include the Federal Open Market Committee (FOMC) participants' projections of the appropriate target federal funds rate along with the quarterly economic projections.
• At 2:30 PM, Fed Chair Jerome Powell holds a press briefing following the FOMC announcement.
CoreLogic: 1.1 million Homeowners with Negative Equity in Q3 2022
by Calculated Risk on 12/13/2022 02:38:00 PM
Note: This was released last Friday. From CoreLogic: CoreLogic: US Home Equity Gains Rose Annually in Q3 but Fell Sharply From Q2
CoreLogic® ... today released the Homeowner Equity Report (HER) for the third quarter of 2022. The report shows that U.S. homeowners with mortgages (which account for roughly 63% of all properties) saw equity increase by 15.8% year over year, representing a collective gain of $2.2 trillion, for an average of $34,300 per borrower, since the third quarter of 2021.
Nationwide, annual home equity gains began to slow in the third quarter of 2022, with the average borrower netting $34,300, compared with the nearly $60,000 year-over-year gain recorded in the second quarter. Slowing prices also caused an additional 43,000 properties to fall underwater. The quarter-over-quarter decline in equity is partially due to cooling home price growth across the country, as annual appreciation fell from about 18% in June to just slightly more than 10% in October. As home price gains are projected to relax into single digits for the rest of 2022, then possibly move into negative territory by the spring of 2023, equity increases will likely decline accordingly in some parts of the country.
“At 43.6%, the average U.S. loan-to-value (LTV) ratio is only slightly higher than in the past two quarters and still significantly lower than the 71.3% LTV seen moving into the Great Recession in the first quarter of 2010,” said Selma Hepp, interim lead of the Office of the Chief Economist at CoreLogic. “Therefore, today’s homeowners are in a much better position to weather the current housing slowdown and a potential recession than they were 12 years ago.”
“Weakening housing demand and the resulting decline in home prices since the spring’s peak reduced annual home equity gains and pushed an additional number of properties underwater in the third quarter,” said Hepp. “Nevertheless, while these negative impacts are concentrated in Western states such as California, homeowners with a mortgage there still average more than $580,000 in home equity.”
Negative equity, also referred to as underwater or upside-down mortgages, applies to borrowers who owe more on their mortgages than their homes are currently worth. As of the third quarter of 2022, the quarterly and annual changes in negative equity were:
• Quarterly change: From the second quarter of 2022 to the third quarter of 2022, the total number of mortgaged homes in negative equity increased by 4% to 1.1 million homes or 1.9% of all mortgaged properties.
• Annual change: In the third quarter of 2021, 1.2 million homes, or 2.2% of all mortgaged properties, were in negative equity. This number declined by 9.8% in the third quarter of 2022, to 1.1 million homes or 1.9% of all mortgage properties.
emphasis added
 Click on graph for larger image.
This graph from CoreLogic compares Q3 2022 to Q2 2022 equity distribution by LTV. There are still a few properties with LTV over 125%. But most homeowners have a significant amount of equity. This is a very different picture than at the start of the housing bust when many homeowners had little equity.
On a year-over-year basis, the number of homeowners with negative equity has declined from 1.2 million to 1.1 million.
Housing, Inflation and Why the Fed Should Consider a Pause
by Calculated Risk on 12/13/2022 09:38:00 AM
Today, in the Calculated Risk Real Estate Newsletter: Housing, Inflation and Why the Fed Should Consider a Pause
A brief excerpt:
Expectations are the FOMC will announce a 50bp rate increase in the federal funds rate tomorrow and increase the "terminal rate" to 5-5.25%.There is more in the article. You can subscribe at https://calculatedrisk.substack.com/
However, it appears the Fed is missing the recent sharp slowdown in household formation. The surge in household formation during the pandemic was unrelated to monetary policy (it was mostly due to work-from-home and the pickup in divorces). And the recent slowdown in household formation is also unrelated to monetary policy.
This “dramatic shift” in household formation is leading to Rents Falling Faster than "Seasonality Alone". Since rents are falling - and will likely continue to fall - it probably makes sense to look at inflation ex-shelter for monetary policy over the next several months.
This graph shows the year-over-year change in Core CPI ex-Shelter (blue), and the one month change annualized (red). The year-over-year change was at 5.2% in November, down from 5.9% in October. And the annualized one-month change was negative in both October and November! Core CPI ex-shelter fell at 1.5% annual rate in November.

BLS: CPI increased 0.1% in November; Core CPI increased 0.2%
by Calculated Risk on 12/13/2022 08:31:00 AM
The Consumer Price Index for All Urban Consumers (CPI-U) rose 0.1 percent in November on a seasonally adjusted basis, after increasing 0.4 percent in October, the U.S. Bureau of Labor Statistics reported today. Over the last 12 months, the all items index increased 7.1 percent before seasonal adjustment.Both CPI and core CPI were below expectations. I'll post a graph later today after the Cleveland Fed releases the median and trimmed-mean CPI.
The index for shelter was by far the largest contributor to the monthly all items increase, more than offsetting decreases in energy indexes. The food index increased 0.5 percent over the month with the food at home index also rising 0.5 percent. The energy index decreased 1.6 percent over the month as the gasoline index, the natural gas index, and the electricity index all declined.
The index for all items less food and energy rose 0.2 percent in November, after rising 0.3 percent in October. The indexes for shelter, communication, recreation, motor vehicle insurance, education, and apparel were among those that increased over the month. Indexes which declined in November include the used cars and trucks, medical care, and airline fares indexes.
The all items index increased 7.1 percent for the 12 months ending November; this was the smallest 12-month increase since the period ending December 2021. The all items less food and energy index rose 6.0 percent over the last 12 months. The energy index increased 13.1 percent for the 12 months ending November, and the food index increased 10.6 percent over the last year; all of these increases were smaller than for the period ending October.
emphasis added
Monday, December 12, 2022
Tuesday: CPI
by Calculated Risk on 12/12/2022 08:08:00 PM
 From Matthew Graham at Mortgage News Daily: Have We Mentioned CPI and The Fed?
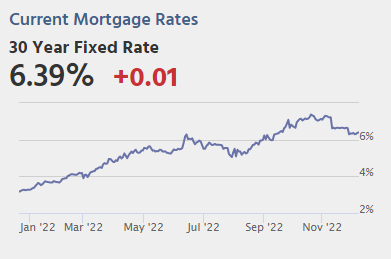
It's been more than a month since the last CPI report sent mortgage rates lower at the fastest single-day pace on record. Since then, apart from one interesting reaction to Powell's speech two weeks ago, the main order of business has been to wait for the next CPI report and the Fed announcement that would follow a day later. As the new week begins, we're a mere 24 hours away. That makes today a placeholder of the highest order. Volatility is possible, especially after the 1pm 10yr Treasury auction, but it pales in comparison to what tomorrow may bring. [30 year fixed 6.39%]Tuesday:
emphasis added
• At 6:00 AM ET, NFIB Small Business Optimism Index for November.
• At 8:30 AM, The Consumer Price Index for November from the BLS. The consensus is for a 0.3% increase in CPI, and a 0.3% increase in core CPI. The consensus is for CPI to be up 7.3% year-over-year and core CPI to be up 6.1% YoY.
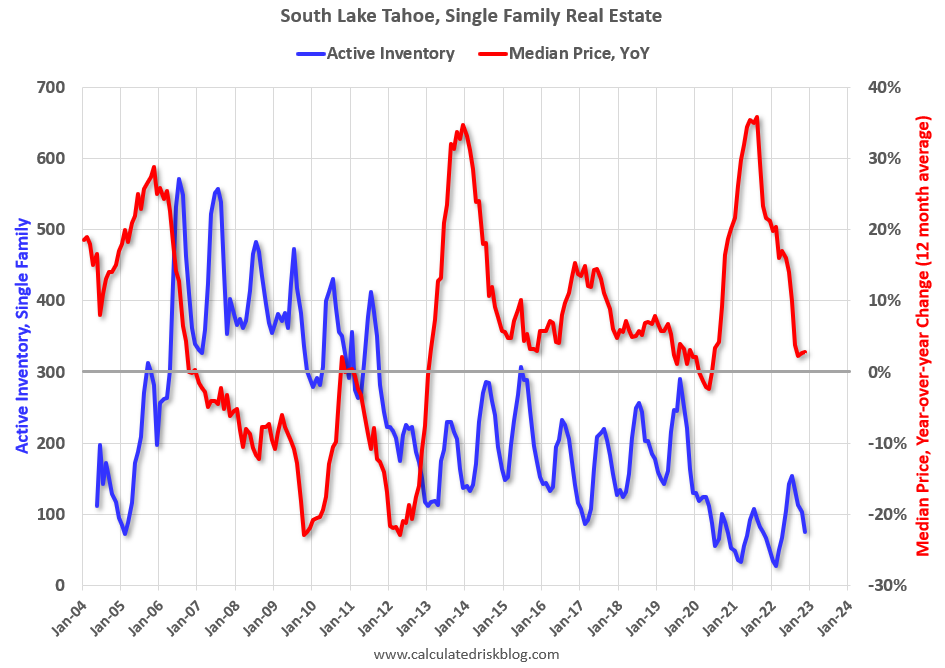
Second Home Market: South Lake Tahoe in November
by Calculated Risk on 12/12/2022 02:18:00 PM
With the pandemic, there was a surge in 2nd home buying.
I'm looking at data for some second home markets - and I'm tracking those markets to see if there is an impact from lending changes, rising mortgage rates or the easing of the pandemic.
This graph is for South Lake Tahoe since 2004 through November 2022, and shows inventory (blue), and the year-over-year (YoY) change in the median price (12-month average).
Note: The median price is a 12-month average, and is distorted by the mix, but this is the available data.
 Click on graph for larger image.
Following the housing bubble, prices declined for several years in South Lake Tahoe, with the median price falling about 50% from the bubble peak.
Currently inventory is still very low, but still up almost 3-fold from the record low set in February 2022, and up 12% year-over-year. Prices are up 2.9% YoY (and the YoY change has been mostly trending down).
It is possible that the YoY change will turn negative soon - even with inventory at historically fairly low levels.
2nd Look at Local Housing Markets in November; Another step down in sales in November
by Calculated Risk on 12/12/2022 11:41:00 AM
Today, in the Calculated Risk Real Estate Newsletter: 2nd Look at Local Housing Markets in November
A brief excerpt:
This is the second look at local markets in November. I’m tracking about 35 local housing markets in the US. Some of the 35 markets are states, and some are metropolitan areas. I’ll update these tables throughout the month as additional data is released.There is much more in the article. You can subscribe at https://calculatedrisk.substack.com/
Closed sales in November were mostly for contracts signed in September and October. Mortgage rates moved higher in September, and 30-year mortgage rates were over 7% for most of October (no points), and that likely impacted closed sales in November and December.
...
Here is a summary of active listings for these housing markets in November.
Inventory in these markets were down 35% YoY in January and are now up 87% YoY! So, this is a significant change from earlier this year, and a larger YoY inventory increase than in October (up 75% YoY).
...
Many more local markets to come!

Housing December 12th Weekly Update: Inventory Decreased 2.5% Week-over-week
by Calculated Risk on 12/12/2022 09:19:00 AM
Active inventory decreased last week. Here are the same week inventory changes for the last four years (usually inventory declines seasonally through the Winter):
2022: -13.9K
2021: -11.7K
2020: -12.4K
2019: -12.4K
Altos reports inventory is down 2.6% week-over-week and down 7.2% from the peak on October 28th.
 Click on graph for larger image.
This inventory graph is courtesy of Altos Research.
 Click on graph for larger image.
This inventory graph is courtesy of Altos Research.
As of December 9th, inventory was at 535 thousand (7-day average), compared to 549 thousand the prior week.
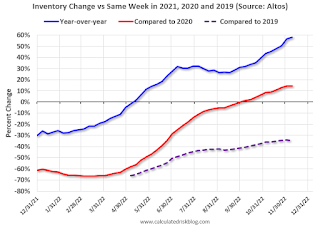
Compared to the same week in 2021, inventory is up 58.0% from 339 thousand, and compared to the same week in 2020 inventory is up 14.3% from 468 thousand. However, compared to 3 years ago (2019), inventory is down 34.8% from 822 thousand.
Here are the inventory milestones I’ve been watching for with the Altos data:
1. The seasonal bottom (happened on March 4, 2022, for Altos) ✅
2. Inventory up year-over-year (happened on May 20, 2022, for Altos) ✅
3. Inventory up compared to 2020 (happened on October 7, 2022, for Altos) ✅
4. Inventory up compared to 2019 (currently down 34.1%).
Mike Simonsen discusses this data regularly on Youtube.
1. The seasonal bottom (happened on March 4, 2022, for Altos) ✅
2. Inventory up year-over-year (happened on May 20, 2022, for Altos) ✅
3. Inventory up compared to 2020 (happened on October 7, 2022, for Altos) ✅
4. Inventory up compared to 2019 (currently down 34.1%).

Here is a graph of the inventory change vs 2021 (milestone 2 above), 2020 (milestone 3) and 2019 (milestone 4). The blue line is the year-over-year data, the red line is compared to two years ago, and dashed purple is compared to 2019.
A key will be if inventory declines slower than usual during the winter months.
Mike Simonsen discusses this data regularly on Youtube.


