 RSS Feed
 by Calculated Risk on 12/12/2022 09:19:00 AM
Monday, December 12, 2022
Housing December 12th Weekly Update: Inventory Decreased 2.5% Week-over-week
Active inventory decreased last week. Here are the same week inventory changes for the last four years (usually inventory declines seasonally through the Winter):
2022: -13.9K
2021: -11.7K
2020: -12.4K
2019: -12.4K
Altos reports inventory is down 2.6% week-over-week and down 7.2% from the peak on October 28th.
 Click on graph for larger image.
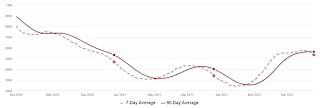
This inventory graph is courtesy of Altos Research.
 Click on graph for larger image.
This inventory graph is courtesy of Altos Research.
As of December 9th, inventory was at 535 thousand (7-day average), compared to 549 thousand the prior week.
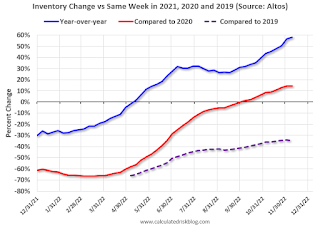
Compared to the same week in 2021, inventory is up 58.0% from 339 thousand, and compared to the same week in 2020 inventory is up 14.3% from 468 thousand. However, compared to 3 years ago (2019), inventory is down 34.8% from 822 thousand.
Here are the inventory milestones I’ve been watching for with the Altos data:
1. The seasonal bottom (happened on March 4, 2022, for Altos) ✅
2. Inventory up year-over-year (happened on May 20, 2022, for Altos) ✅
3. Inventory up compared to 2020 (happened on October 7, 2022, for Altos) ✅
4. Inventory up compared to 2019 (currently down 34.1%).
Mike Simonsen discusses this data regularly on Youtube.
1. The seasonal bottom (happened on March 4, 2022, for Altos) ✅
2. Inventory up year-over-year (happened on May 20, 2022, for Altos) ✅
3. Inventory up compared to 2020 (happened on October 7, 2022, for Altos) ✅
4. Inventory up compared to 2019 (currently down 34.1%).

Here is a graph of the inventory change vs 2021 (milestone 2 above), 2020 (milestone 3) and 2019 (milestone 4). The blue line is the year-over-year data, the red line is compared to two years ago, and dashed purple is compared to 2019.
A key will be if inventory declines slower than usual during the winter months.
Mike Simonsen discusses this data regularly on Youtube.


