 RSS Feed
 by Calculated Risk on 12/07/2022 07:00:00 AM
Wednesday, December 07, 2022
MBA: Mortgage Applications Decrease in Latest Weekly Survey
From the MBA: Mortgage Applications Decrease in Latest MBA Weekly Survey
Mortgage applications decreased 1.9 percent from one week earlier, according to data from the Mortgage Bankers Association’s (MBA) Weekly Mortgage Applications Survey for the week ending December 2, 2022. Last week’s results include an adjustment for the observance of the Thanksgiving holiday.
... The Refinance Index increased 5 percent from the previous week and was 86 percent lower than the same week one year ago. The seasonally adjusted Purchase Index decreased 3 percent from one week earlier. The unadjusted Purchase Index increased 31 percent compared with the previous week and was 40 percent lower than the same week one year ago.
“Mortgage applications decreased 2 percent compared to the Thanksgiving holiday-adjusted results from the previous week, even as mortgage rates continued to trend lower. Rates decreased for most loan products, with the 30-year fixed declining 8 basis points to 6.41 percent after reaching 7.16 percent in October,” said Joel Kan, MBA’s Vice President and Deputy Chief Economist. “The 30-year fixed rate was 73 basis points lower than a month ago – but was still more than three percentage points higher than in December 2021. Additionally, the pace of refinancing remained around 80 percent lower than a year ago.”
Added Kan, “Purchase activity slowed last week, with a drop in conventional purchase applications partially offset by an increase in FHA and USDA loan applications. The average loan size for purchase applications decreased to $387,300 – its lowest level since January 2021. The decrease was consistent with slightly stronger government applications and a rapidly cooling home-price environment.”
...
The average contract interest rate for 30-year fixed-rate mortgages with conforming loan balances ($647,200 or less) decreased to 6.41 percent from 6.49 percent, with points decreasing to 0.63 from 0.68 (including the origination fee) for 80 percent loan-to-value ratio (LTV) loans.
emphasis added
 Click on graph for larger image.
The first graph shows the refinance index since 1990.
With higher mortgage rates, the refinance index has declined sharply this year.
The refinance index is near the lowest level since the year 2000.
The second graph shows the MBA mortgage purchase index
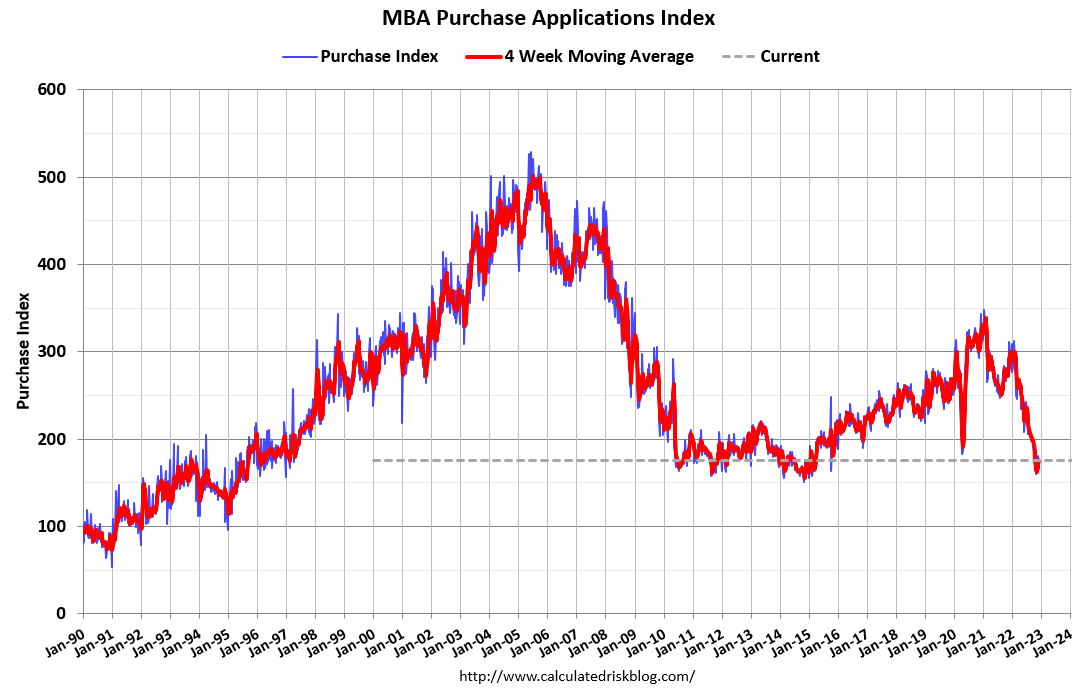 According to the MBA, purchase activity is down 40% year-over-year unadjusted.
The purchase index is 4% below the pandemic low and up slightly from the lowest level since 2015.
Note: Red is a four-week average (blue is weekly).
Note: Red is a four-week average (blue is weekly).
Tuesday, December 06, 2022
FDIC: Problem Banks Increased to 42 in Q3 2022
by Calculated Risk on 12/06/2022 06:23:00 PM
The FDIC released the Quarterly Banking Profile for Q3 2022 last week:
Net Income Increased Quarter Over Quarter and Year Over Year: Quarterly net income totaled $71.7 billion in third quarter 2022, an increase of $7.3 billion (11.3 percent) from the second quarter.
...
Asset Quality Metrics Were Favorable Overall Despite Growth in Early Delinquencies: Loans that were 90 days or more past due or in nonaccrual status (i.e., noncurrent loans) continued to decline and the noncurrent rate was down 3 basis points to 0.72 percent from second quarter 2022. The noncurrent rate for total loans is at the lowest level since second quarter 2006. Total net charge-offs increased 6 basis points from a year ago to 0.26 percent, driven by higher credit card and auto loan net charge offs. Early delinquencies (i.e., loans past due 30-89 days) increased 3 basis points from last quarter and 7 basis points from the year-ago quarter to 0.51 percent. Both the quarterly and annual increases were driven by an increase in past due credit cards, C&I, and auto loans.
emphasis added
 Click on graph for larger image.
The FDIC reported the number of problem banks increased to 42.
The number of banks on the FDIC’s “Problem Bank List” increased by two from second quarter to 42. Total assets of problem banks declined $5.7 billion to $163.8 billion.7 No banks failed in the third quarter.This graph from the FDIC shows the number of problem banks and assets at problem institutions.
Note: The number of assets for problem banks increased significantly back in 2018 when Deutsche Bank Trust Company Americas was added to the list. An even larger bank was added to the list last year, although the identity of the bank is unclear.
Update: Framing Lumber Prices Close to Pre-Pandemic Levels
by Calculated Risk on 12/06/2022 12:26:00 PM
Here is another monthly update on framing lumber prices.
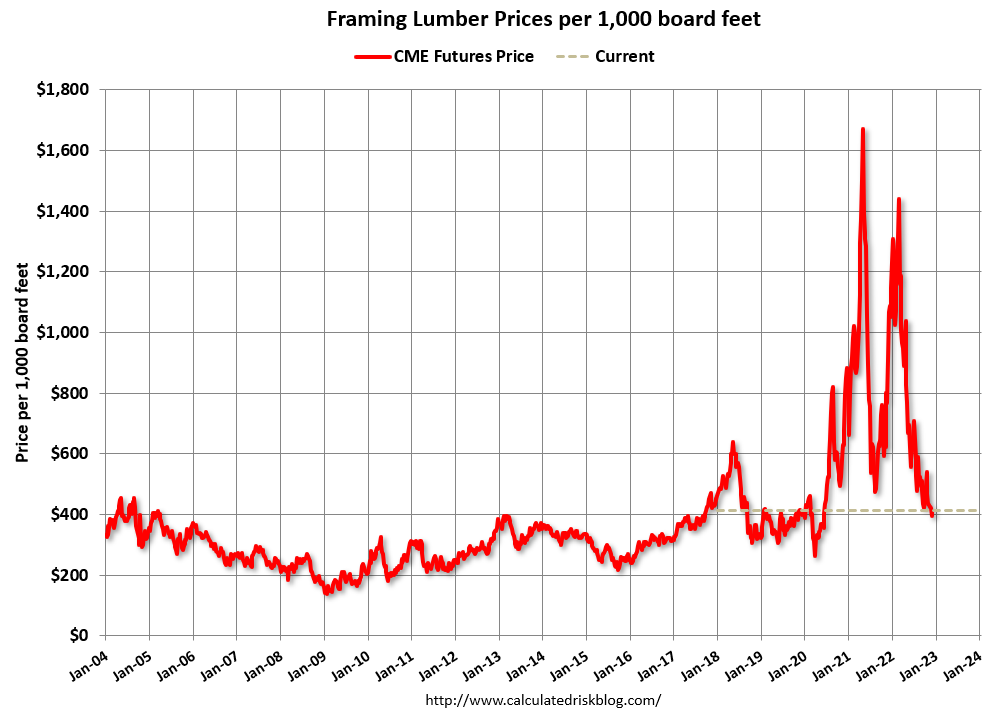
This graph shows CME random length framing futures through December 6th.
Lumber was at $413 per 1000 board feet this morning.
This is down from the peak of $1,733, and down 54% from $907 a year ago.
Prices are close to the pre-pandemic levels of around $400.
 Click on graph for larger image.
It is unlikely we will see a runup in prices as happened at the end of last year due to the housing slowdown.
Prices are close to the pre-pandemic levels of around $400.
 Click on graph for larger image.
There is somewhat of a seasonal demand for lumber, and lumber prices usually peak in April or May, although prices peaked much earlier this year.
It is unlikely we will see a runup in prices as happened at the end of last year due to the housing slowdown.
There was this press release yesterday announcing production cuts "due to very weak market conditions":
Canfor Corporation (TSX:CFP) is announcing a temporary reduction in Canadian production due to very weak market conditions. The production will be reduced through curtailments at all solid wood facilities in B.C. and Alberta. This will remove approximately 150 million board feet in December and January. The curtailments will start to be implemented on December 19, 2022 and will range from one to four weeks across its Canadian operations. The Company will continue to adjust operating rates to align with market conditions and anticipates that the majority of its BC facilities will operate below full capacity in the New Year.
Q3 Update: Delinquencies, Foreclosures and REO
by Calculated Risk on 12/06/2022 09:27:00 AM
Today, in the Calculated Risk Real Estate Newsletter: Q3 Update: Delinquencies, Foreclosures and REO
A brief excerpt:
Last year, I pointed out that with the end of the foreclosure moratoriums, combined with the expiration of a large number of forbearance plans, we would see an increase in REOs in late 2022 and into 2023. However, this would NOT lead to a surge in foreclosures and significantly impact house prices (as happened following the housing bubble) since lending has been solid and most homeowners have substantial equity in their homes.There is much more in the article. You can subscribe at https://calculatedrisk.substack.com/
...
Here is some data on REOs through Q3 2022 …
...
This graph shows the nominal dollar value of Residential REO for FDIC insured institutions. Note: The FDIC reports the dollar value and not the total number of REOs.
The dollar value of 1-4 family residential Real Estate Owned (REOs, foreclosure houses) increased from $784 million in Q2 2022 to $818 million in Q3 2022. This is increasing, but still very low.
...
The bottom line is there will be an increase in foreclosures over the next year (from record low levels), but it will not be a huge wave of foreclosures as happened following the housing bubble. The distressed sales during the housing bust led to cascading price declines, and that will not happen this time.

Trade Deficit increased to $78.2 Billion in October
by Calculated Risk on 12/06/2022 08:44:00 AM
From the Department of Commerce reported:
The U.S. Census Bureau and the U.S. Bureau of Economic Analysis announced today that the goods and services deficit was $78.2 billion in October, up $4.0 billion from $74.1 billion in September, revised.
October exports were $256.6 billion, $1.9 billion less than September exports. October imports were $334.8 billion, $2.2 billion more than September imports.
emphasis added
 Click on graph for larger image.
Exports decreased and imports increased in October.
Exports are up 14% year-over-year; imports are also up 14% year-over-year.
Both imports and exports decreased sharply due to COVID-19 and have now bounced back.
The second graph shows the U.S. trade deficit, with and without petroleum.
 The blue line is the total deficit, and the black line is the petroleum deficit, and the red line is the trade deficit ex-petroleum products.
Note that net, exports of petroleum products are slightly positive.
The trade deficit with China decreased to $28.9 billion in October, from $31.3 billion a year ago.
The trade deficit was slightly smaller than the consensus forecast.
CoreLogic: House Prices up 10.1% YoY in October; Declined 0.1% MoM in October NSA
by Calculated Risk on 12/06/2022 08:00:00 AM
Notes: This CoreLogic House Price Index report is for October. The recent Case-Shiller index release was for September. The CoreLogic HPI is a three-month weighted average and is not seasonally adjusted (NSA).
From CoreLogic: US Annual Home Price Growth Slows to Half of Spring 2022 Peak in October, CoreLogic Reports
CoreLogic® ... today released the CoreLogic Home Price Index (HPI™) and HPI Forecast™ for October 2022.
Year-over-year home price growth remained in double digits in October, at 10.1%, but continued to cool and was the lowest recorded since early 2021. Several factors are contributing to slowing appreciation: low inventory due to seller preferences to keep affordable mortgage rates that they have already locked in, homebuyer loss of purchase power and current economic uncertainty. Annual U.S. price growth is expected to taper off in the coming months, perhaps moving into negative territory by spring 2023, but then slowly ticking back into single digits as the year progresses.
“Following the recent mortgage rate surge above 7%, real estate activity and consumer sentiment regarding the housing market took a nosedive,” said Selma Hepp, interim lead of the Office of the Chief Economist at CoreLogic. “Home price growth continued to approach single digits in October, and it will move in that direction for the rest of the year and into 2023.”
...
U.S. home prices (including distressed sales) increased 10.1% year over year in October 2022 compared to October 2021. On a month-over-month basis, home prices declined by 0.1% compared to September 2022.
emphasis added
Monday, December 05, 2022
Tuesday: Trade Deficit
by Calculated Risk on 12/05/2022 08:00:00 PM
 From Matthew Graham at Mortgage News Daily: Mortgage Rates Start Lower, But Finish Higher
In addition to Fed anxiety, there was stronger economic data again this morning with a key report on the services sector coming in near the highest levels since earlier this year (a big reversal considering the previous month came in at the lowest levels in more than 2 years).Tuesday:
Strong economic data implies higher rates, all other things being equal. The bond market traded accordingly. By the end of the day, we'd lost enough ground that most mortgage lenders recalled their initial offerings and "re-priced" with higher rates/fees. The net effect was that Monday's rates ended up being close to Friday morning's after having been moderately lower to start the day. [30 year fixed 6.33%]
emphasis added
• At 8:00 AM: Corelogic House Price index for October.
• At 8:30 AM: Trade Balance report for October from the Census Bureau. The consensus is the trade deficit to be $79.1 billion. The U.S. trade deficit was at $73.3 billion in September.
Q4 GDP Tracking: Around 1.5%
by Calculated Risk on 12/05/2022 02:07:00 PM
From BofA:
Overall, today's data pushed up our 4Q US GDP tracking by one-tenth to 1.4% q/q saar. [Dec 5th estimate]From Goldman:
emphasis added
We left our Q4 GDP tracking estimate unchanged on net at +1.4% (qoq ar). [Dec 5th estimate]And from the Altanta Fed: GDPNow
The GDPNow model estimate for real GDP growth (seasonally adjusted annual rate) in the fourth quarter of 2022 is 2.8 percent on December 1, down from 4.3 percent on November 23. [Dec 1st estimate]
Black Knight Mortgage Monitor: Home Prices Declined in October; Down 3.2% since June
by Calculated Risk on 12/05/2022 11:06:00 AM
Today, in the Calculated Risk Real Estate Newsletter: Black Knight Mortgage Monitor: Home Prices Declined in October; Down 3.2% since June
A brief excerpt:
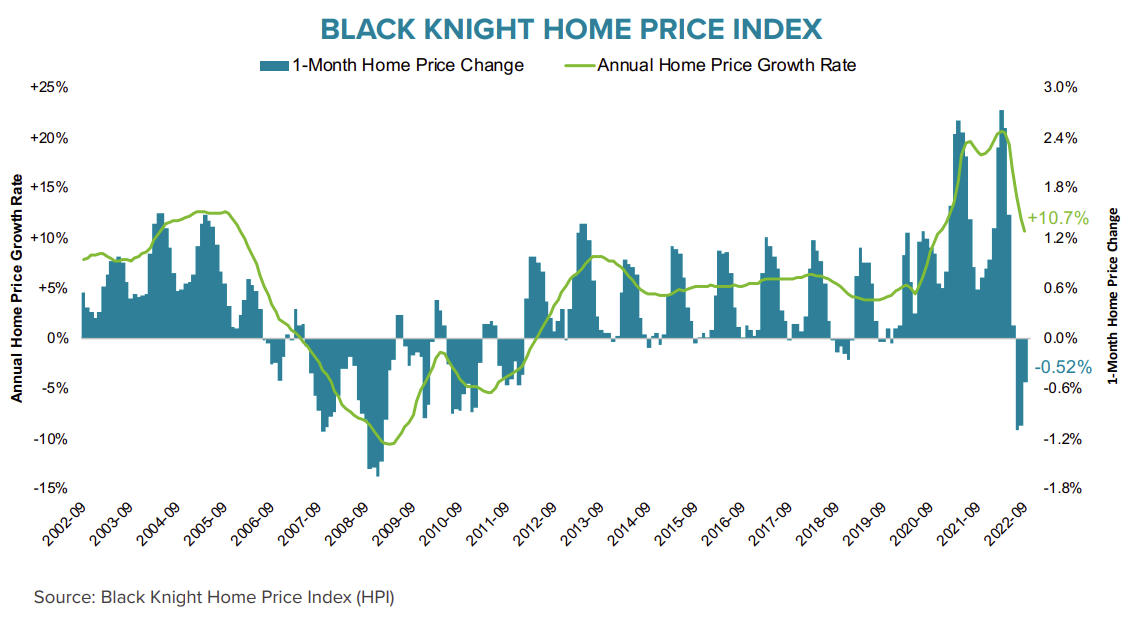
Here is a graph of the Black Knight HPI. The index is still up 9.3% year-over-year but declined for the fourth straight month in October and is now 3.2% off the peak in June.There is much more in the article. You can subscribe at https://calculatedrisk.substack.com/
• While near multi-decade low affordability would suggest home prices should be seeing strong declines, stalling inventory levels are holding home prices higher than current demand levels would suggest they should be
• Home prices fell 0.43% in October (-0.13% on a seasonally-adjusted basis), the smallest such decline – both actual and seasonally adjusted – since home prices peaked in June
• Likewise, home price growth cooled for the seventh consecutive month, to 9.3% in October from 10.6% the prior month, the lowest annual rate in >2 years
• The median home price nationally is now down 3.2% (-1.5% on a seasonally-adjusted basis) from its June peak but tight inventory has slowed the rate of decline in recent months
ISM® Services Index Increased to 56.5% in November
by Calculated Risk on 12/05/2022 10:13:00 AM
(Posted with permission). The ISM® Services index was at 56.5%, up from 54.4% last month. The employment index increased to 51.5%, from 49.1%. Note: Above 50 indicates expansion, below 50 in contraction.
From the Institute for Supply Management: Services PMI® at 56.5% November 2022 Services ISM® Report On Business®
Economic activity in the services sector grew in November for the 30th month in a row — with the Services PMI® registering 56.5 percent — say the nation's purchasing and supply executives in the latest Services ISM® Report On Business®.The PMI was higher than expected and the employment index was above 50.
The report was issued today by Anthony Nieves, CPSM, C.P.M., A.P.P., CFPM, Chair of the Institute for Supply Management® (ISM®) Services Business Survey Committee: “In November, the Services PMI® registered 56.5 percent, 2.1 percentage points higher than October’s reading of 54.4 percent. The Business Activity Index registered 64.7 percent, a substantial increase of 9 percentage points compared to the reading of 55.7 percent in October. The New Orders Index figure of 56 percent is 0.5 percentage point lower than the October reading of 56.5 percent.
emphasis added


