 RSS Feed
 by Calculated Risk on 12/02/2022 08:44:00 AM
Friday, December 02, 2022
November Employment Report: 263 thousand Jobs, 3.7% Unemployment Rate
From the BLS:
Total nonfarm payroll employment increased by 263,000 in November, and the unemployment rate was unchanged at 3.7 percent, the U.S. Bureau of Labor Statistics reported today. Notable job gains occurred in leisure and hospitality, health care, and government. Employment declined in retail trade and in transportation and warehousing.
...
The change in total nonfarm payroll employment for September was revised down by 46,000, from +315,000 to +269,000, and the change for October was revised up by 23,000, from +261,000 to +284,000. With these revisions, employment gains in September and October combined were 23,000 lower than previously reported.
emphasis added
 Click on graph for larger image.
The first graph shows the job losses from the start of the employment recession, in percentage terms.
The current employment recession was by far the worst recession since WWII in percentage terms.
However, as of August 2022, the total number of jobs had returned and are now 1.044 million above pre-pandemic levels. I'll post this graph through the January 2023 report (includes the annual revision).
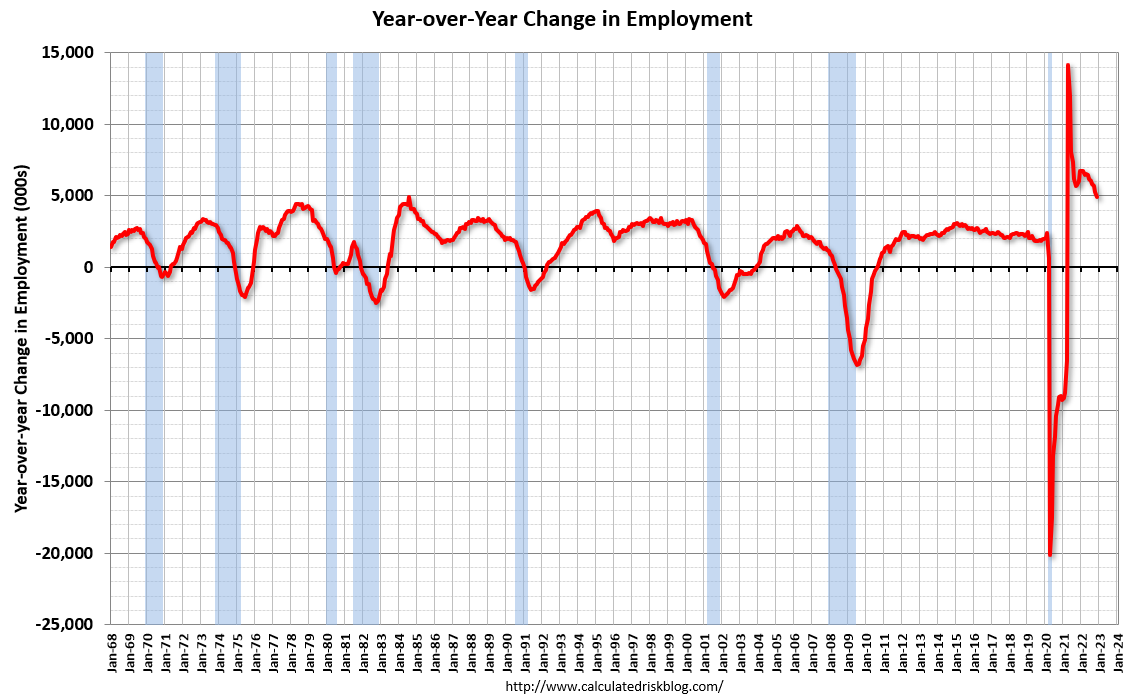
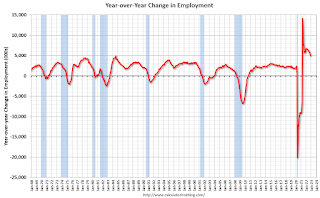 The second graph shows the year-over-year change in total non-farm employment since 1968.
In November, the year-over-year change was 4.90 million jobs. Employment was up significantly year-over-year.
Total payrolls increased by 263 thousand in November. Private payrolls increased by 221 thousand, and public payrolls increased 42 thousand.
Payrolls for September and October were revised down 23 thousand, combined.
The third graph shows the employment population ratio and the participation rate.
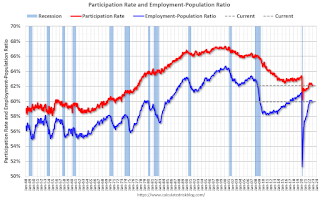 The Labor Force Participation Rate decreased to 62.1% in November, from 62.2% in October. This is the percentage of the working age population in the labor force.
The Employment-Population ratio decreased to 59.9% from 60.0% (blue line).
I'll post the 25 to 54 age group employment-population ratio graph later.
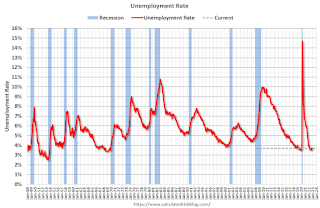 The fourth graph shows the unemployment rate.
The unemployment rate was unchanged in November at 3.7% from 3.7% in October.
This was above consensus expectations; however, September and October payrolls were revised down by 23,000 combined.
 The second graph shows the year-over-year change in total non-farm employment since 1968.
In November, the year-over-year change was 4.90 million jobs. Employment was up significantly year-over-year.
Total payrolls increased by 263 thousand in November. Private payrolls increased by 221 thousand, and public payrolls increased 42 thousand.
Payrolls for September and October were revised down 23 thousand, combined.
The third graph shows the employment population ratio and the participation rate.
 The Labor Force Participation Rate decreased to 62.1% in November, from 62.2% in October. This is the percentage of the working age population in the labor force.
 The Employment-Population ratio decreased to 59.9% from 60.0% (blue line).
I'll post the 25 to 54 age group employment-population ratio graph later.
 The fourth graph shows the unemployment rate.
 The unemployment rate was unchanged in November at 3.7% from 3.7% in October.
This was above consensus expectations; however, September and October payrolls were revised down by 23,000 combined.
I'll have more later ...
Thursday, December 01, 2022
Friday: Employment Report
by Calculated Risk on 12/01/2022 09:08:00 PM
 Mortgage rates are down a full percentage point in just over 3 weeks.
Note: Mortgage rates are from MortgageNewsDaily.com and are for top tier scenarios.
My November Employment Preview
Friday:
• At 8:30 AM ET, Employment Report for November. The consensus is for 200,000 jobs added, and for the unemployment rate to be unchanged at 3.7%.
Vehicles Sales Declined to 14.14 million SAAR in November
by Calculated Risk on 12/01/2022 07:24:00 PM
Wards Auto released their estimate of light vehicle sales for November. Wards Auto estimates sales of 14.14 million SAAR in November 2022 (Seasonally Adjusted Annual Rate), down 5.1% from the October sales rate, and up 7.9% from November 2021.
 Click on graph for larger image.
This graph shows light vehicle sales since 2006 from the BEA (blue) and Wards Auto's estimate for November (red).
The impact of COVID-19 was significant, and April 2020 was the worst month. After April 2020, sales increased, and were close to sales in 2019 (the year before the pandemic). However, sales decreased late last year due to supply issues. It appears the "supply chain bottom" was in September 2021.
 The second graph shows light vehicle sales since the BEA started keeping data in 1967.
 November Employment Preview
by Calculated Risk on 12/01/2022 06:08:00 PM
On Friday at 8:30 AM ET, the BLS will release the employment report for November. The consensus is for 200,000 jobs added, and for the unemployment rate to be unchanged at 3.7%.
 Click on graph for larger image.
• First, as of October there are 804 thousand more jobs than in February 2020 (the month before the pandemic).
This graph shows the job losses from the start of the employment recession, in percentage terms. As of August 2022, the total number of jobs had returned.
This doesn't include the preliminary benchmark revision that showed there were 462 thousand more jobs than originally reported in March 2022.
• A few brief excerpts from a note by Goldman Sachs economist Spencer Hill:
We estimate nonfarm payrolls rose by 175k in November (mom sa), below consensus of +200k and a slowdown from the +261k pace in October. ... We estimate the unemployment rate was unchanged at 3.7%• ADP Report: The ADP employment report showed 127,000 private sector jobs were added in November. This is the fourth release of ADP's new methodology, and this suggests job gains below consensus expectations.
emphasis added
• ISM Surveys: Note that the ISM services are diffusion indexes based on the number of firms hiring (not the number of hires). The ISM® manufacturing employment index decreased in November to 48.4%, down from 50.0% last month. This would suggest 30,000 jobs lost in manufacturing.
The ISM® services employment index for November has not been released yet.
• Unemployment Claims: The weekly claims report showed an increase in the number of initial unemployment claims during the reference week (includes the 12th of the month) from 214,000 in October to 223,000 in November. This would usually suggest above the same number of layoffs in October as in September. In general, weekly claims were slightly higher than expectations in November.
• COVID: As far as the pandemic, the number of weekly cases during the reference week in November was around 282,000, up slightly from 265,000 in October.
• Conclusion: The consensus is for job growth to slow to 200,000 jobs added in November. The ADP report was below expectations, and weekly claims were slightly negative. My guess is the report will be below consensus.
Fannie Mae: Mortgage Serious Delinquency Rate Decreased in October
by Calculated Risk on 12/01/2022 03:09:00 PM
Fannie Mae reported that the Single-Family Serious Delinquency decreased to 0.67% in October from 0.69% in September. The serious delinquency rate is down from 1.46% in October 2021. This is close to pre-pandemic levels.
These are mortgage loans that are "three monthly payments or more past due or in foreclosure".
The Fannie Mae serious delinquency rate peaked in February 2010 at 5.59% following the housing bubble and peaked at 3.32% in August 2020 during the pandemic.
 Click on graph for larger image
By vintage, for loans made in 2004 or earlier (1% of portfolio), 2.34% are seriously delinquent (down from 2.41% in September).
For loans made in 2005 through 2008 (1% of portfolio), 3.71% are seriously delinquent (down from 3.83%),
For recent loans, originated in 2009 through 2021 (98% of portfolio), 0.53% are seriously delinquent (down from 0.55%). So, Fannie is still working through a handful of poor performing loans from the bubble years.
Mortgages in forbearance were counted as delinquent in this monthly report, but they were not reported to the credit bureaus.
Freddie Mac reported earlier.
Mortgages in forbearance were counted as delinquent in this monthly report, but they were not reported to the credit bureaus.
Freddie Mac reported earlier.
Rents Falling Faster than "Seasonality Alone"
by Calculated Risk on 12/01/2022 12:16:00 PM
Today, in the Calculated Risk Real Estate Newsletter: Rents Falling Faster than "Seasonality Alone"
A brief excerpt:
Here is a graph of the year-over-year (YoY) change for these measures since January 2015. All of these measures are through October 2022 (Apartment List through November 2022).There is much more in the article. You can subscribe at https://calculatedrisk.substack.com/
Note that new lease measures (Zillow, Apartment List) dipped early in the pandemic, whereas the BLS measures were steady. Then new leases took off, and the BLS measures are picking up.
...
The Zillow measure is up 9.6% YoY in October, down from 10.8% YoY in September. This is down from a peak of 17.1% YoY in February.
The ApartmentList measure is up 4.5% YoY as of November, down from 5.6% in October. This is down from the peak of 18.1% YoY last December.
Rents are still increasing YoY, and we should expect this to continue to spill over into measures of inflation. The Owners’ Equivalent Rent (OER) was up 6.9% YoY in October, from 6.7% YoY in September - and will likely increase further in the coming months even as rents slow sharply.
...
My suspicion is rent increases will slow further over the coming months as the pace of household formation slows, and more supply comes on the market. Housing economist Tom Lawler recently wrote: "An actual decline in rents next year would be a reasonable base case". This is important for monetary policy.

Construction Spending Decreased 0.3% in October
by Calculated Risk on 12/01/2022 10:19:00 AM
From the Census Bureau reported that overall construction spending increased:
Construction spending during October 2022 was estimated at a seasonally adjusted annual rate of $1,794.9 billion, 0.3 percent below the revised September estimate of $1,800.1 billion. The October figure is 9.2 percent above the October 2021 estimate of $1,644.3 billion.Private spending decreased and public spending increased:
emphasis added
Spending on private construction was at a seasonally adjusted annual rate of $1,420.4 billion, 0.5 percent below the revised September estimate of $1,427.6 billion. ...
In October, the estimated seasonally adjusted annual rate of public construction spending was $374.6 billion, 0.6 percent above the revised September estimate of $372.5 billion.
 Click on graph for larger image.
This graph shows private residential and nonresidential construction spending, and public spending, since 1993. Note: nominal dollars, not inflation adjusted.
Residential (red) spending is 6.1% below the recent peak.
Non-residential (blue) spending is 0.8% below the recent peak.
Public construction spending is at a new peak.
 The second graph shows the year-over-year change in construction spending.
On a year-over-year basis, private residential construction spending is up 8.6%. Non-residential spending is up 9.5% year-over-year. Public spending is up 10.0% year-over-year.
This was at consensus expectations of a 0.3% decrease in spending; however, construction spending for the previous two months combined were revised down.
ISM® Manufacturing index Declined to 49.0% in November
by Calculated Risk on 12/01/2022 10:04:00 AM
(Posted with permission). The ISM manufacturing index indicated contraction. The PMI® was at 49.0% in November, down from 50.2% in October. The employment index was at 48.4%, down from 50.0% last month, and the new orders index was at 47.2%, down from 49.2%.
From ISM: Manufacturing PMI® at 49% November 2022 Manufacturing ISM® Report On Business®
Economic activity in the manufacturing sector contracted in November for the first time since May 2020 after 29 consecutive months of growth, say the nation's supply executives in the latest Manufacturing ISM® Report On Business®.This suggests manufacturing contracted in November. This was below the consensus forecast. Note that prices are falling.
The report was issued today by Timothy R. Fiore, CPSM, C.P.M., Chair of the Institute for Supply Management® (ISM®) Manufacturing Business Survey Committee:
“The November Manufacturing PMI® registered 49 percent, 1.2 percentage points lower than the 50.2 percent recorded in October. Regarding the overall economy, this figure indicates expansion for the 30th month in a row after contraction in April and May 2020. The Manufacturing PMI® figure is the lowest since May 2020, when it registered 43.5 percent. The New Orders Index remained in contraction territory at 47.2 percent, 2 percentage points lower than the 49.2 percent recorded in October. The Production Index reading of 51.5 percent is a 0.8-percentage point decrease compared to October’s figure of 52.3 percent. The Prices Index registered 43 percent, down 3.6 percentage points compared to the October figure of 46.6 percent; this is the index’s lowest reading since May 2020 (40.8 percent). The Backlog of Orders Index registered 40 percent, 5.3 percentage points lower than the October reading of 45.3 percent. The Employment Index returned to contraction territory (48.4 percent, down 1.6 percentage points) after being unchanged in October at 50 percent. The Supplier Deliveries Index reading of 47.2 percent is 0.4 percentage point higher than the October figure of 46.8 percent. Except for last month, the Supplier Deliveries Index hasn’t been at this level since February 2012 (47 percent). The Inventories Index registered 50.9 percent, 1.6 percentage points lower than the October reading of 52.5 percent. The New Export Orders Index reading of 48.4 percent is up 1.9 percentage points compared to October’s figure of 46.5 percent. The Imports Index dropped into contraction territory at 46.6 percent, 4.2 percentage points below the October reading of 50.8 percent.”
emphasis added
Personal Income increased 0.7% in October; Spending increased 0.8%
by Calculated Risk on 12/01/2022 08:42:00 AM
The BEA released the Personal Income and Outlays report for October:
Personal income increased $155.3 billion (0.7 percent) in October, according to estimates released today by the Bureau of Economic Analysis. Disposable personal income (DPI) increased $132.9 billion (0.7 percent) and personal consumption expenditures (PCE) increased $147.9 billion (0.8 percent).The October PCE price index increased 6.0 percent year-over-year (YoY), down from 6.3 percent YoY in September.
The PCE price index increased 0.3 percent. Excluding food and energy, the PCE price index increased 0.2 percent. Real DPI increased 0.4 percent in October and Real PCE increased 0.5 percent; goods increased 1.1 percent and services increased 0.2 percent.
emphasis added
The PCE price index, excluding food and energy, increased 5.0 percent YoY, down from 5.2 percent in September.
The following graph shows real Personal Consumption Expenditures (PCE) through October 2022 (2012 dollars). Note that the y-axis doesn't start at zero to better show the change.
 Click on graph for larger image.
The dashed red lines are the quarterly levels for real PCE.
Personal income was above expectations, and the increase in PCE was at expectations.
Inflation was slightly below expectations.
Weekly Initial Unemployment Claims decrease to 225,000
by Calculated Risk on 12/01/2022 08:34:00 AM
The DOL reported:
In the week ending November 26, the advance figure for seasonally adjusted initial claims was 225,000, a decrease of 16,000 from the previous week's revised level. The previous week's level was revised up by 1,000 from 240,000 to 241,000. The 4-week moving average was 228,750, an increase of 1,750 from the previous week's revised average. The previous week's average was revised up by 250 from 226,750 to 227,000.The following graph shows the 4-week moving average of weekly claims since 1971.
emphasis added
 Click on graph for larger image.
The dashed line on the graph is the current 4-week average. The four-week average of weekly unemployment claims increased to 228,750.
The previous week was revised up.
Weekly claims were lower than the consensus forecast.


