 RSS Feed
 by Calculated Risk on 11/15/2022 09:21:00 AM
Tuesday, November 15, 2022
CoreLogic: Annual Single-Family Rent Growth Decelerates
From CoreLogic: Annual Single-Family Rent Growth Decelerates for Fifth Consecutive Month and Seasonal Patterns Return
Consistent evidence of a single-family rental market cooldown follows nearly two years of above-trend rental price hikes. Single-family rent growth in September 2022 slowed for the fifth consecutive month to 10.2% from a high of 13.9% in April 2022. Additionally, rent growth this September was slightly below that of September 2021. The rent increase slowdown comes as inflation stretches tenants’ pocketbooks.
“Annual single-family rent growth decelerated for the fifth consecutive month in September but remained at more than twice the pre-pandemic growth rate,” said Molly Boesel, principal economist at CoreLogic. “High mortgage interest rates may be causing potential homebuyers to hit pause and remain renters, keeping pressure on rent prices. However, the monthly rent change was negative in September, resuming the typical seasonal pattern for the first time since 2019, which could signal the beginning of rent price growth normalization.”
 Click on graph for larger image.
This graph from CoreLogic shows the YoY change in single-family rents.
Year-over-year rent growth slowed to 10.2% in September - and the month-over-month change was negative in September.
Monday, November 14, 2022
Tuesday: PPI, NY Fed Mfg, Q3 Household Debt and Credit
by Calculated Risk on 11/14/2022 08:01:00 PM
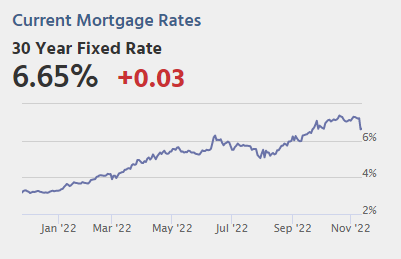 From Matthew Graham at Mortgage News Daily: Mortgage Rates Roughly Unchanged After Last Week's Huge Drop
If you're just getting caught up, last Thursday was one for the record books--at least when it comes to the daily records that exist going back to 2009. No other day has seen as big of a drop in the average 30yr fixed mortgage rate (0.60%).Tuesday:
The bonds that dictate mortgage rates lost quite a bit of ground today, but that didn't translate to any meaningful damage. This speaks to the 'uncertainty premium' that oftentimes prevents lenders from dropping rates as much as the market might suggest at the end of any given week. It's usually more noticeable before 3-day weekends, but was easily lost in the shuffle given the scope of the movement. ... [30 year fixed 6.65%]
emphasis added
• At 8:30 AM ET, The Producer Price Index for October from the BLS. The consensus is for a 0.5% increase in PPI, and a 0.4% increase in core PPI.
• Also, at 8:30 AM, The New York Fed Empire State manufacturing survey for November. The consensus is for a reading of -7.0, up from -9.1.
• At 11:00 AM: NY Fed, Q3 Quarterly Report on Household Debt and Credit
2nd Look at Local Housing Markets in October
by Calculated Risk on 11/14/2022 12:23:00 PM
Today, in the Calculated Risk Real Estate Newsletter: 2nd Look at Local Housing Markets in October
A brief excerpt:
This is the second look at local markets in October. I’m tracking about 35 local housing markets in the US. Some of the 35 markets are states, and some are metropolitan areas. I’ll update these tables throughout the month as additional data is released.There is much more in the article. You can subscribe at https://calculatedrisk.substack.com/
Closed sales in October were mostly for contracts signed in August and September. Mortgage rates moved higher in September, and that impacted closed sales in October.
The further sharp increase in mortgage rates in October - with the 30-year mortgage over 7% - will impact closed sales in November and December.
...
In October, sales were down 29.2%. In September, these same markets were down 24.1% YoY Not Seasonally Adjusted (NSA).
Note that in October 2022, there were the same number of selling days as in October 2021, so the SA decline will be similar to the NSA decline. And this suggests another step down in sales!
Many more local markets to come!

Housing November 14th Weekly Update: Inventory Decreased Slightly Week-over-week
by Calculated Risk on 11/14/2022 09:00:00 AM
Active inventory decreased slightly. Here are the same week inventory changes for the last four years (usually inventory declines seasonally through the Winter):
2022: -3.5K (smaller than usual decrease in inventory)
2021: -6.9K
2020: -5.1K
2019: -6.3K
Altos reports inventory is down 0.6% week-over-week.
 Click on graph for larger image.
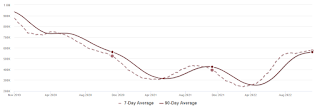
This inventory graph is courtesy of Altos Research.
 Click on graph for larger image.
This inventory graph is courtesy of Altos Research.
As of November 11th, inventory was at 572 thousand (7-day average), compared to 575 thousand the prior week.
Compared to the same week in 2021, inventory is up 45.1% from 394 thousand, and compared to the same week in 2020 inventory is up 8.9% from 525 thousand. Compared to 3 years ago (2019), inventory is down 35.9% from 892 thousand.
Here are the inventory milestones I’ve been watching for with the Altos data:
1. The seasonal bottom (happened on March 4, 2022, for Altos) ✅
2. Inventory up year-over-year (happened on May 20, 2022, for Altos) ✅
3. Inventory up compared to 2020 (happened on October 7, 2022, for Altos) ✅
4. Inventory up compared to 2019 (currently down 35.9%).
1. The seasonal bottom (happened on March 4, 2022, for Altos) ✅
2. Inventory up year-over-year (happened on May 20, 2022, for Altos) ✅
3. Inventory up compared to 2020 (happened on October 7, 2022, for Altos) ✅
4. Inventory up compared to 2019 (currently down 35.9%).
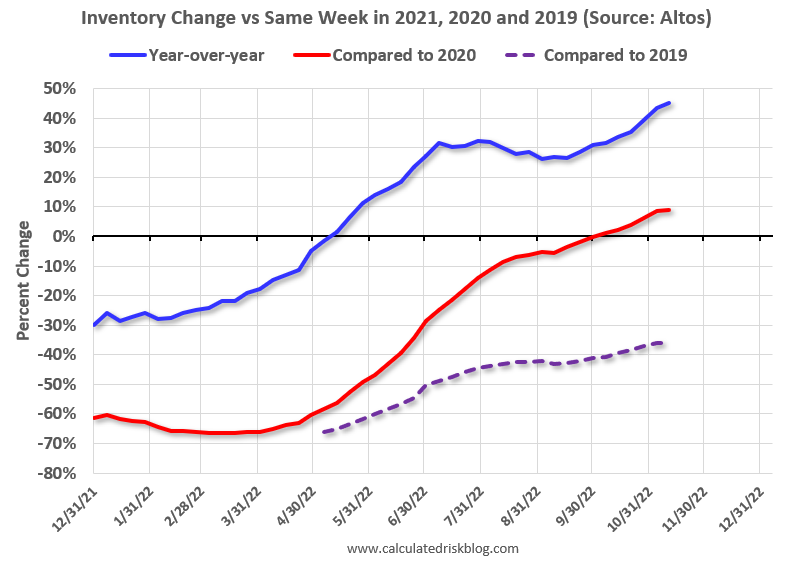
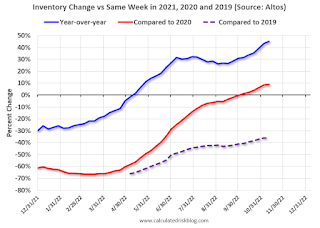
Here is a graph of the inventory change vs 2021 (milestone 2 above), 2020 (milestone 3) and 2019 (milestone 4).
The blue line is the year-over-year data, the red line is compared to two years ago, and dashed purple is compared to 2019.
A key will be if inventory declines slower than usual during the winter months.
Mike Simonsen discusses this data regularly on Youtube.
Four High Frequency Indicators for the Economy
by Calculated Risk on 11/14/2022 08:29:00 AM
These indicators are mostly for travel and entertainment. It was interesting to watch these sectors recover as the pandemic impact subsided.
The TSA is providing daily travel numbers.
This data is as of November 13th.
 Click on graph for larger image.
This data shows the 7-day average of daily total traveler throughput from the TSA for 2019 (Light Blue), 2020 (Black), 2021 (Blue) and 2022 (Red).
The dashed line is the percent of 2019 for the seven-day average.
The 7-day average is 5.5% below the same week in 2019 (94.5% of 2019). (Dashed line)
Air travel - as a percent of 2019 - has picked up recently.
----- Movie Tickets: Box Office Mojo -----
 This data shows domestic box office for each week and the median for the years 2016 through 2019 (dashed light blue).
 This data shows domestic box office for each week and the median for the years 2016 through 2019 (dashed light blue).
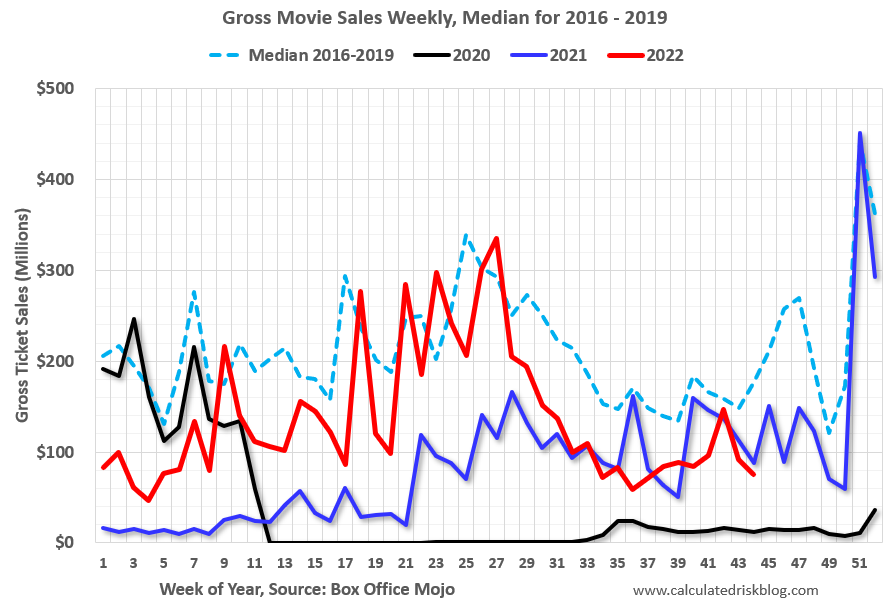
 Black is 2020, Blue is 2021 and Red is 2022.
The data is from BoxOfficeMojo through November 10th.
Note that the data is usually noisy week-to-week and depends on when blockbusters are released.
Movie ticket sales were at $75 million last week, down about 58% from the median for the week.
Note that the data is usually noisy week-to-week and depends on when blockbusters are released.
Movie ticket sales were at $75 million last week, down about 58% from the median for the week.
 This graph shows the seasonal pattern for the hotel occupancy rate using the four-week average.
 The red line is for 2022, black is 2020, blue is the median, and dashed light blue is for 2021. Dashed purple is 2019 (STR is comparing to a strong year for hotels).
This data is through Nov 5th. The occupancy rate was down 9.2% compared to the same week in 2019.
The 4-week average of the occupancy rate is above the median rate for the previous 20 years (Blue) and close to 2019 levels.
Notes: Y-axis doesn't start at zero to better show the seasonal change.
Notes: Y-axis doesn't start at zero to better show the seasonal change.

This graph, based on weekly data from the U.S. Energy Information Administration (EIA), shows gasoline supplied compared to the same week of 2019.
Blue is for 2020. Purple is for 2021, and Red is for 2022.
As of November 4th, gasoline supplied was down 1.5% compared to the same week in 2019.
Recently gasoline supplied has been running below 2019 and 2021 levels - and sometimes below 2020.
Sunday, November 13, 2022
Sunday Night Futures
by Calculated Risk on 11/13/2022 08:13:00 PM
Weekend:
• Schedule for Week of November 13, 2022
Monday:
• No major economic releases scheduled.
From CNBC: Pre-Market Data and Bloomberg futures S&P 500 are down 11 and DOW futures are down 70 (fair value).
Oil prices were down over the last week with WTI futures at $88.96 per barrel and Brent at $5.99 per barrel. A year ago, WTI was at $81, and Brent was at $83 - so WTI oil prices are up 10% year-over-year.
Here is a graph from Gasbuddy.com for nationwide gasoline prices. Nationally prices are at $3.78 per gallon. A year ago, prices were at $3.40 per gallon, so gasoline prices are up $0.38 per gallon year-over-year.
Heavy Truck Sales Up 13% Year-over-year
by Calculated Risk on 11/13/2022 11:01:00 AM
The BEA released their estimate of vehicle sales for October earlier.
This graph shows heavy truck sales since 1967 using data from the BEA. The dashed line is the October 2022 seasonally adjusted annual sales rate (SAAR).
Heavy truck sales really collapsed during the great recession, falling to a low of 180 thousand SAAR in May 2009. Then heavy truck sales increased to a new all-time high of 570 thousand SAAR in April 2019.
 Click on graph for larger image.
Note: "Heavy trucks - trucks more than 14,000 pounds gross vehicle weight."
Heavy truck sales declined sharply at the beginning of the pandemic, falling to a low of 308 thousand SAAR in May 2020.
Heavy truck sales were at 499 thousand SAAR in October, up from 475 thousand in September, and up from 438 thousand SAAR in October 2021.
Usually, heavy truck sales decline sharply prior to a recession. Sales were solid in October.
Saturday, November 12, 2022
Real Estate Newsletter Articles this Week: Current State of the Housing Market; Overview for mid-November
by Calculated Risk on 11/12/2022 02:11:00 PM
At the Calculated Risk Real Estate Newsletter this week:
• Current State of the Housing Market; Overview for mid-November
• Housing and Inflation
• Homebuilder Comments in October: "As negative as I've seen"
• New Home Cancellations increased Sharply in Q3
• https://calculatedrisk.substack.com/p/new-home-cancellations-increased-5b3
• Black Knight Mortgage Monitor: Home Prices Declined in September; Down 2.6% since June
This is usually published 4 to 6 times a week and provides more in-depth analysis of the housing market.
You can subscribe at https://calculatedrisk.substack.com/
Most content is available for free (and no Ads), but please subscribe!
Schedule for Week of November 13, 2022
by Calculated Risk on 11/12/2022 08:11:00 AM
The key economic reports this week are October Retail Sales, Housing Starts and Existing Home sales.
For manufacturing, October industrial production, and the November New York, Philly and Kansas City Fed surveys, will be released this week.
No major economic releases scheduled.
8:30 AM: The Producer Price Index for October from the BLS. The consensus is for a 0.5% increase in PPI, and a 0.4% increase in core PPI.
8:30 AM: The New York Fed Empire State manufacturing survey for November. The consensus is for a reading of -7.0, up from -9.1.
11:00 AM: NY Fed: Q3 Quarterly Report on Household Debt and Credit
7:00 AM ET: The Mortgage Bankers Association (MBA) will release the results for the mortgage purchase applications index.
 8:30 AM ET: Retail sales for October will be released.
The consensus is for a 0.9% increase in retail sales.
This graph shows retail sales since 1992. This is monthly retail sales and food service, seasonally adjusted (total and ex-gasoline).
 9:15 AM: The Fed will release Industrial Production and Capacity Utilization for October.
This graph shows industrial production since 1967.
The consensus is for a 0.2% increase in Industrial Production, and for Capacity Utilization to increase to 80.4%.
10:00 AM: The November NAHB homebuilder survey. The consensus is for a reading of 36, down from 38. Any number below 50 indicates that more builders view sales conditions as poor than good.
During the day: The AIA's Architecture Billings Index for October (a leading indicator for commercial real estate).
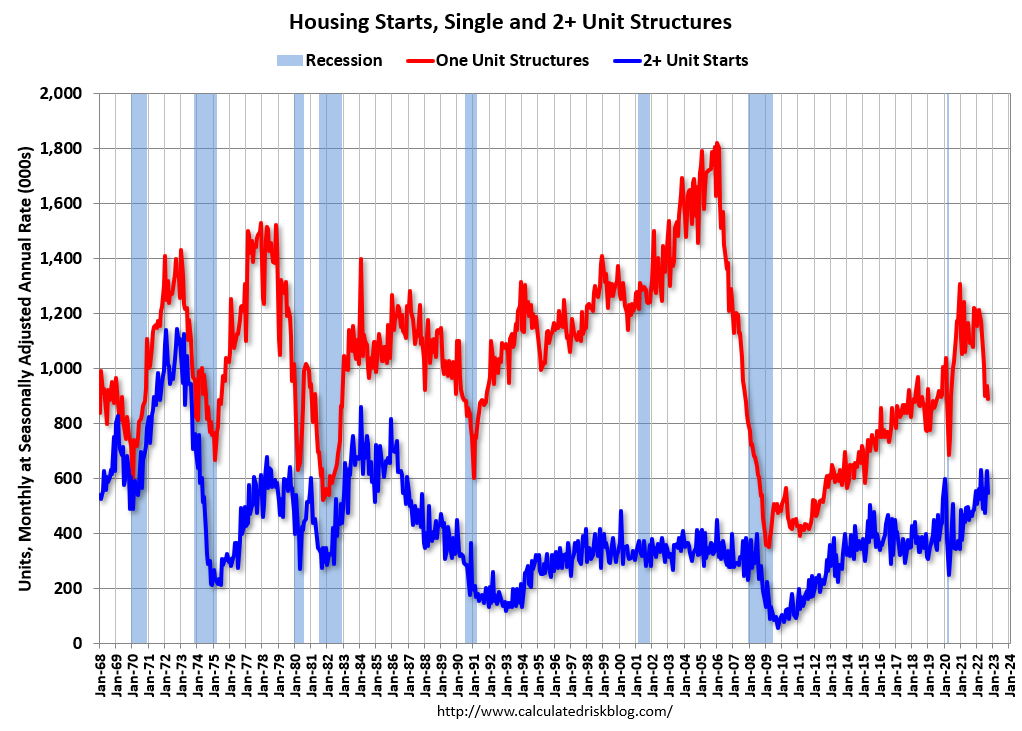 8:30 AM: Housing Starts for October.
 This graph shows single and total housing starts since 1968.
The consensus is for 1.410 million SAAR, down from 1.439 million SAAR.
8:30 AM: The initial weekly unemployment claims report will be released. The consensus is for 230 thousand initial claims, up from 225 thousand last week.
8:30 AM: the Philly Fed manufacturing survey for November. The consensus is for a reading of -8.0, up from -8.7.
11:00 AM: the Kansas City Fed manufacturing survey for November.
 10:00 AM: Existing Home Sales for October from the National Association of Realtors (NAR). The consensus is for 4.39 million SAAR, down from 4.71 million in September.
The graph shows existing home sales from 1994 through the report last month.
10:00 AM: State Employment and Unemployment (Monthly) for October 2022
Friday, November 11, 2022
COVID Nov 11, 2022: Update on Cases, Hospitalizations and Deaths
by Calculated Risk on 11/11/2022 06:14:00 PM
NOTE: COVID stats are updated on Fridays.
On COVID (focus on hospitalizations and deaths). Data has switched to weekly.
Weekly deaths bottomed in July 2021 at 1,666.
| COVID Metrics | ||||
|---|---|---|---|---|
| Now | Week Ago | Goal | ||
| New Cases per Week2🚩 | 288,989 | 273,021 | ≤35,0001 | |
| Hospitalized2 | 21,259 | 21,299 | ≤3,0001 | |
| Deaths per Week2 | 2,344 | 2,489 | ≤3501 | |
| 1my goals to stop weekly posts, 2Weekly for Cases, Currently Hospitalized, and Deaths 🚩 Increasing number weekly for Cases, Hospitalized, and Deaths ✅ Goal met. | ||||
 Click on graph for larger image.
This graph shows the weekly (columns) number of deaths reported.


