 RSS Feed
 by Calculated Risk on 11/09/2022 01:25:00 PM
Wednesday, November 09, 2022
Second Home Market: South Lake Tahoe in October
With the pandemic, there was a surge in 2nd home buying.
I'm looking at data for some second home markets - and I'm tracking those markets to see if there is an impact from lending changes, rising mortgage rates or the easing of the pandemic.
This graph is for South Lake Tahoe since 2004 through October 2022, and shows inventory (blue), and the year-over-year (YoY) change in the median price (12-month average).
Note: The median price is distorted by the mix, but this is the available data.

Following the housing bubble, prices declined for several years in South Lake Tahoe, with the median price falling about 50% from the bubble peak.
Currently inventory is still very low, but still up almost 4-fold from the record low set in February 2022, and up 37% year-over-year. Prices are up 2.6% YoY (and the YoY change has been trending down).
It is possible that the YoY change will turn negative soon - even with inventory at historically fairly low levels.
New Home Cancellations increased Sharply in Q3
by Calculated Risk on 11/09/2022 10:29:00 AM
Today, in the Calculated Risk Real Estate Newsletter: New Home Cancellations increased Sharply in Q3
A brief excerpt:
First, a few quotes from some homebuilders:There is much more in the article. You can subscribe at https://calculatedrisk.substack.com/"During most of the year, demand for our homes was strong. Beginning in June and continuing through today, we have seen a moderation in housing demand caused by significant increases in mortgage interest rates and general economic uncertainty.” [Donald R. Horton, Chairman of the Board, said] …The Company’s cancellation rate (cancelled sales orders divided by gross sales orders) for the fourth quarter of fiscal 2022 was 32% compared to 19% in the prior year quarter. D.R. Horton
“In response to the significant shift in market conditions in 2022, we have slowed the pace of our housing starts, have increased sales incentives, and are taking additional pricing actions in many of our communities.” Pulte Group
New Orders decreased 15%, while the average sales price of New Orders increased 3% in the third quarter of 2022 compared to the third quarter of 2021. New Orders were negatively impacted in each of our reportable segments by the significant increase in mortgage interest rates during the quarter, which resulted in a decline in affordability and in turn, led to lower absorption rates and to an increase in the cancellation rate quarter over quarter. NVR
emphasis addedHere is a table of selected public builders and the currently reported cancellation rate (I’m still gathering data).
Disclaimer: the cancellation rates are from SEC filings only, and while deemed to be reliable is not guaranteed.
In general, cancellation rates doubled or tripled in the most recent quarter compared to 2021.

MBA: Mortgage Applications Decrease in Latest Weekly Survey
by Calculated Risk on 11/09/2022 07:00:00 AM
From the MBA: Mortgage Applications Decrease in Latest MBA Weekly Survey
— Mortgage applications decreased 0.1 percent from one week earlier, according to data from the Mortgage Bankers Association’s (MBA) Weekly Mortgage Applications Survey for the week ending November 4, 2022.
... The Refinance Index decreased 4 percent from the previous week and was 87 percent lower than the same week one year ago. The seasonally adjusted Purchase Index increased 1 percent from one week earlier. The unadjusted Purchase Index decreased 1 percent compared with the previous week and was 41 percent lower than the same week one year ago.
“Mortgage rates edged higher last week following news that the Federal Reserve will continue raising short-term rates to combat high inflation. The 30-year fixed rate remained above 7 percent for the third consecutive week, with increases for most loan types,” said Joel Kan, MBA’s Vice President and Deputy Chief Economist. “Purchase applications increased for the first time after six weeks of declines but remained close to 2015 lows, as homebuyers remained sidelined by higher rates and ongoing economic uncertainty. Refinances continued to fall, with the index hitting its lowest level since August 2000.”
...
The average contract interest rate for 30-year fixed-rate mortgages with conforming loan balances ($647,200 or less) increased to 7.14 percent from 7.06 percent, with points increasing to 0.77 from 0.73 (including the origination fee) for 80 percent loan-to-value ratio (LTV) loans.
emphasis added
 Click on graph for larger image.
The first graph shows the refinance index since 1990.
With higher mortgage rates, the refinance index has declined sharply this year.
The refinance index is at the lowest level since the year 2000.
The second graph shows the MBA mortgage purchase index
 According to the MBA, purchase activity is down 41% year-over-year unadjusted.
The purchase index is 11% below the pandemic low and near the lowest level since 2015.
Note: Red is a four-week average (blue is weekly).
Note: Red is a four-week average (blue is weekly).
Tuesday, November 08, 2022
CPI Preview and Owners' equivalent rent
by Calculated Risk on 11/08/2022 03:31:00 PM
On Thursday, the BLS will release inflation data for October. The consensus is for a 0.7% increase in CPI, and a 0.5% increase in core CPI. The consensus is for CPI to be up 8.0% year-over-year and core CPI to be up 6.6% YoY.
Here is a preview from Goldman Sachs economists Manuel Abecasis and Spencer Hill:
We expect a below-consensus 0.44% increase in core CPI in October (vs. 0.5% consensus), which would lower the year-on-year rate to 6.46% (vs. 6.5% consensus). We expect moderate increases in both food and energy prices to raise headline CPI by 0.49% (vs. 0.6% consensus), which would lower the year-on-year rate to 7.8% (vs. 7.9% consensus).Recently we've seen used car prices down over 10% YoY, and framing lumber prices down 33% YoY. One of the keys will be rent, especially Owners' equivalent rent (OER). In Goldman's note, they echoed Fed Chair Powell's comment about rents have "some significant rate increases coming":
[W]e expect shelter inflation to run hot (rent +0.78%, OER + 0.75%)—even though alternative web-based measures of new tenant rent growth have slowed—because continuing tenant rent levels still have a long way to catch up to new tenant market rates.However, Rental housing economist Jay Parsons argues rental data will "cool faster than the Fed expects:
emphasis added
 Click on graph for larger image.
Here's the data to show real-life rent inflation will cool faster than the Fed suggested last week-- and not just for asking rents:
We’ve plunged back to long-term average in “loss to lease” – meaning the runway for renewal lease rents will significantly narrow going forward...
“Loss to lease” is the gap between today’s market asking rents and the average in-place (embedded) rent (aka “contract rent,” which is what the CPI attempts to measure). As a general rule of thumb: The larger the loss to lease, the larger the renewal increase...
Here is a dissertation from economist Adam Ozimek showing a significant lag in CPI measured rents: Sticky Rents and the CPI for Owner-Occupied Housing Rent inflation will be a key for the Fed.
CHRISTOPHER RUGABER. Thank you, Chris Rugaber at Associated Press. Just to go back to housing for a minute, you mentioned the impact that rate increases have had on housing, home sales are down 25 percent in the past year, and so forth, but none of this is really showing up in, as you know, in the government's inflation measures. And as we go forward, private real-time data is clearly showing these hits to housing. Are you going to need to put a greater weigh on that in order to ascertain things like whether there's over tightening going on or will you still focus as much on the more lagging government indicators?
CHAIR POWELL. So this is an interesting subject. So I start by saying I guess that the measure that's in the CPI and the PCE, it captures rents for all tenants, not just the new, not just new leases. And that makes sense actually because that, for that reason, that conceptually that is, that's sort of the right target for monetary policy. And the same thing is true for owners' equivalent rent which comes off of, it's a re-weighting of tenant rents. The private measures are of course good at picking up the, at the margin, the new leases and they tell you a couple things; one thing is, once you, I think right now, if you look at the pattern of that series of the new leases, it's very pro-cyclical, so rents went up much more than the CPI and PCE rents did. And now they're coming down faster. So but what you're, the implication is that there are still as people, as non-new leases rollover and expire, right? You still, they're still in the pipeline, there's still some significant rate increases coming. Okay? But at some point, once you get through that, the new leases are going to tell you, what they're telling you is there will come a point at which rent inflation will start to come down. But that point is well out from where we are now. So we're well-aware of that of course and we look at it. And we've, but I would say that in terms of the right way to think about inflation really is to look at the measure that we do look at, but considering that we also know that at some point you'll see rents coming down.
emphasis added
Leading Index for Commercial Real Estate Increases in October
by Calculated Risk on 11/08/2022 01:16:00 PM
From Dodge Data Analytics: Dodge Momentum Index Continues to Climb in October
he Dodge Momentum Index (DMI), issued by Dodge Construction Network, improved 9.6% (2000=100) in October to 199.7 from the revised September reading of 182.2. During the month, the DMI continued its steady ascent, with the commercial component rising 13%, and the institutional component ticking up 2.9%.
Commercial planning was bolstered by a solid increase in office and hotel projects. The institutional component was varied, experiencing growth in recreational and education projects, countered by a decline in the number of healthcare and public planning projects. On a year-over-year basis, the DMI was 28% higher than in October 2021, the commercial component was up 29%, and institutional planning was 25% higher.
...
“The sustained upward trajectory in the Momentum Index shows optimism from owners and developers that projects will continue to move forward, even with rising concerns of an economic recession,” said Sarah Martin, senior economist for Dodge Construction Network. “Specific nonresidential segments, such as data centers and life science laboratories, have thrived in 2022 and continue to support strength in planning activity. As we move into next year, however, labor and supply shortages, high material costs and high interest rates will likely temper planning activity back to a more moderate pace.”
emphasis added
 Click on graph for larger image.
This graph shows the Dodge Momentum Index since 2002. The index was at 199.7 in October, up from 182.2 in September.
According to Dodge, this index leads "construction spending for nonresidential buildings by a full year". This index suggests a solid pickup in commercial real estate construction into 2023.
Update: Framing Lumber Prices Close to Pre-Pandemic Levels
by Calculated Risk on 11/08/2022 11:19:00 AM
Here is another monthly update on framing lumber prices.
This graph shows CME random length framing futures through November 8th.
Lumber was at $447 per 1000 board feet this morning.
This is down from the peak of $1,733, and down 33% from $663 a year ago.
Prices are close to the pre-pandemic levels of around $400.
 Click on graph for larger image.
It is unlikely we will see a runup in prices as happened at the end of last year due to the housing slowdown.
Prices are close to the pre-pandemic levels of around $400.
 Click on graph for larger image.
There is somewhat of a seasonal demand for lumber, and lumber prices usually peak in April or May, although prices peaked much earlier this year.
It is unlikely we will see a runup in prices as happened at the end of last year due to the housing slowdown.
1st Look at Local Housing Markets in October
by Calculated Risk on 11/08/2022 08:53:00 AM
Today, in the Calculated Risk Real Estate Newsletter: 1st Look at Local Housing Markets in October
A brief excerpt:
This is the first look at local markets in October. I’m tracking about 35 local housing markets in the US. Some of the 35 markets are states, and some are metropolitan areas. I’ll update these tables throughout the month as additional data is released.There is much more in the article. You can subscribe at https://calculatedrisk.substack.com/
Closed sales in October were mostly for contracts signed in August and September. Mortgage rates moved higher in September, and that impacted closed sales in October.
The further sharp increase in mortgage rates in October - with the 30-year mortgage over 7% - will impact closed sales in November and December.
...
In October, sales were down 38.0%. In September, these same markets were down 28.5% YoY Not Seasonally Adjusted (NSA).
Note that in October 2022, there were the same number of selling days as in October 2021, so the SA decline will be similar to the NSA decline. And this suggests another significant step down in sales!
Many more local markets to come!

Monday, November 07, 2022
Tuesday: Small Business Survey
by Calculated Risk on 11/07/2022 09:00:00 PM
 From Matthew Graham at Mortgage News Daily: New Issuance Keeping Pressure on Bonds Ahead of CPI
CPI-watching is all the more interesting these days due to the extreme prevalence of one particular month-over-month reading. Core monthly inflation came in at 0.6% no fewer than 8 times since the start of the pandemic, and 5 of those have been in 2022. No other level has been even half as prevalent. In annualized term, 0.6% represents a 7.2% core inflation rate--well over the current 6.6% level. The 2 most recent reports both came in at 0.6%, making it even more of a line in the sand--one that can help us identify a turning point. ... [30 year fixed 7.25%]Tuesday:
emphasis added
• At 6:00 AM ET, NFIB Small Business Optimism Index for October.
Fed Survey: Banks reported Tighter Standards, Weaker Demand for Most Loan Types; Stronger Demand for HELOCs
by Calculated Risk on 11/07/2022 05:06:00 PM
From the Federal Reserve: The October 2022 Senior Loan Officer Opinion Survey on Bank Lending Practices
The October 2022 Senior Loan Officer Opinion Survey on Bank Lending Practices (SLOOS) addressed changes in the standards and terms on, and demand for, bank loans to businesses and households over the past three months, which generally correspond to the third quarter of 2022.
Regarding loans to businesses, survey respondents reported, on balance, tighter standards and weaker demand for commercial and industrial (C&I) loans to firms of all sizes over the third quarter. Meanwhile, banks reported tighter standards and weaker demand for all commercial real estate (CRE) loan categories.
For loans to households, lending standards tightened or remained basically unchanged across all categories of residential real estate (RRE) loans and demand weakened for all such loans. In addition, banks reported tighter standards and stronger demand for home equity lines of credit (HELOCs). Standards tightened for credit card loans and other consumer loans while standards for auto loans remained unchanged. Meanwhile, demand strengthened for credit card loans, was unchanged for other consumer loans, and weakened for auto loans.
emphasis added
 Click on graph for larger image.
This graph on Residential Real Estate demand is from the Senior Loan Officer Survey Charts.
This shows that demand has declined sharply.
The left graph is 1990 to 2014. The right graph is 2015 to Q3 2022.
Housing November 7th Weekly Update: Inventory Decreased Slightly Week-over-week
by Calculated Risk on 11/07/2022 12:09:00 PM
Active inventory decreased slightly. Here are the same week inventory changes for the last four years (usually inventory is declining sharply at this time of year):
2022: -2.2K (smaller than usual decrease in inventory)
2021: -13.0K
2020: -13.4K
2019: -20.7K
Inventory bottomed seasonally at the beginning of March 2022 and is now up 138% since then. Altos reports inventory is down 0.4% week-over-week.
 Click on graph for larger image.
This inventory graph is courtesy of Altos Research.
 Click on graph for larger image.
This inventory graph is courtesy of Altos Research.
As of November 4th, inventory was at 575 thousand (7-day average), compared to 577 thousand the prior week.
Compared to the same week in 2021, inventory is up 43.5% from 401 thousand, and compared to the same week in 2020 inventory is up 8.5% from 530 thousand. Compared to 3 years ago (2019), inventory is down 36.0% from 898 thousand.
Here are the inventory milestones I’ve been watching for with the Altos data:
1. The seasonal bottom (happened on March 4, 2022, for Altos) ✅
2. Inventory up year-over-year (happened on May 20, 2022, for Altos) ✅
3. Inventory up compared to 2020 (happened on October 7, 2022, for Altos) ✅
4. Inventory up compared to 2019 (currently down 36.0%).
1. The seasonal bottom (happened on March 4, 2022, for Altos) ✅
2. Inventory up year-over-year (happened on May 20, 2022, for Altos) ✅
3. Inventory up compared to 2020 (happened on October 7, 2022, for Altos) ✅
4. Inventory up compared to 2019 (currently down 36.0%).

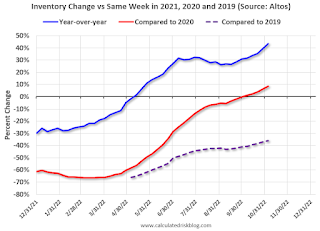
Here is a graph of the inventory change vs 2021 (milestone 2 above), 2020 (milestone 3) and 2019 (milestone 4).
The blue line is the year-over-year data, the red line is compared to two years ago, and dashed purple is compared to 2019.
A key will be if inventory declines slowly during the winter months.
Mike Simonsen discusses this data regularly on Youtube.


