 RSS Feed
 by Calculated Risk on 9/09/2022 04:55:00 PM
Friday, September 09, 2022
AAR: August Rail Carloads Up Year-over-year, Intermodal Down
From the Association of American Railroads (AAR) Rail Time Indicators. Graphs and excerpts reprinted with permission.
If you were expecting August rail traffic to provide a definitive statement regarding the state of the economy, well, get used to disappointment. As in June and July, rail traffic in August was relatively evenly balanced between categories with carload gains and those with declines.
emphasis added
 Click on graph for larger image.
This graph from the Rail Time Indicators report shows the six-week average of U.S. Carloads in 2020, 2021 and 2022:
U.S. railroads originated an average of 237,978 total carloads per week in August 2022. That’s the best weekly average for any month since May 2021 and up 2.3% over August 2021. The 2.3% gain was the biggest year-over-year gain since February 2022 (which isn’t a fair comparison because rail traffic in February 2021 was decimated by severe winter storms).
 The second graph shows the six-week average (not monthly) of U.S. intermodal in 2020, 2021 and 2022: (using intermodal or shipping containers):
Intermodal originations (which are not included in carloads) averaged 267,124 units per week in August 2022, down 1.2% from August 2021. August was the 12th decline in the past 13 months (February 2022 was the exception) but 1.2% is the smallest percentage decline in those 13 months. The weekly average in August 2022 was the third highest in the eight months so far this year. For the year to date through August, intermodal was down 5.1% from last year’s record, up 7.4% over 2020, and down 0.9% from 2019.
Q3 GDP Tracking: Just Over 1%
by Calculated Risk on 9/09/2022 02:14:00 PM
From BofA:
We updated our 3Q US GDP (Gross Domestic Product) [1.1% q/q saar] tracking estimate from July trade data, where the narrowing of the trade deficit to $70.6bn was broadly in line with our expectation, although the goods deficit was revised slightly higher from the advance estimate. Net trade is poised to make a substantial contribution to growth in 3Q. [September 9th estimate]From Goldman:
emphasis added
We left our Q3 GDP tracking estimate unchanged at +1.1% (qoq ar). [September 9th estimate]And from the Altanta Fed: GDPNow
The GDPNow model estimate for real GDP growth (seasonally adjusted annual rate) in the third quarter of 2022 is 1.3 percent on September 9, down from 1.4 percent on September 7. After this morning's wholesale trade report from the US Census Bureau, the nowcast of third-quarter real gross private domestic investment growth decreased from -5.8 percent to -6.1 percent. [September 9th estimate]
Fed's Flow of Funds: Household Net Worth Decreased $6.1 Trillion in Q2
by Calculated Risk on 9/09/2022 12:41:00 PM
The Federal Reserve released the Q2 2022 Flow of Funds report today: Financial Accounts of the United States.
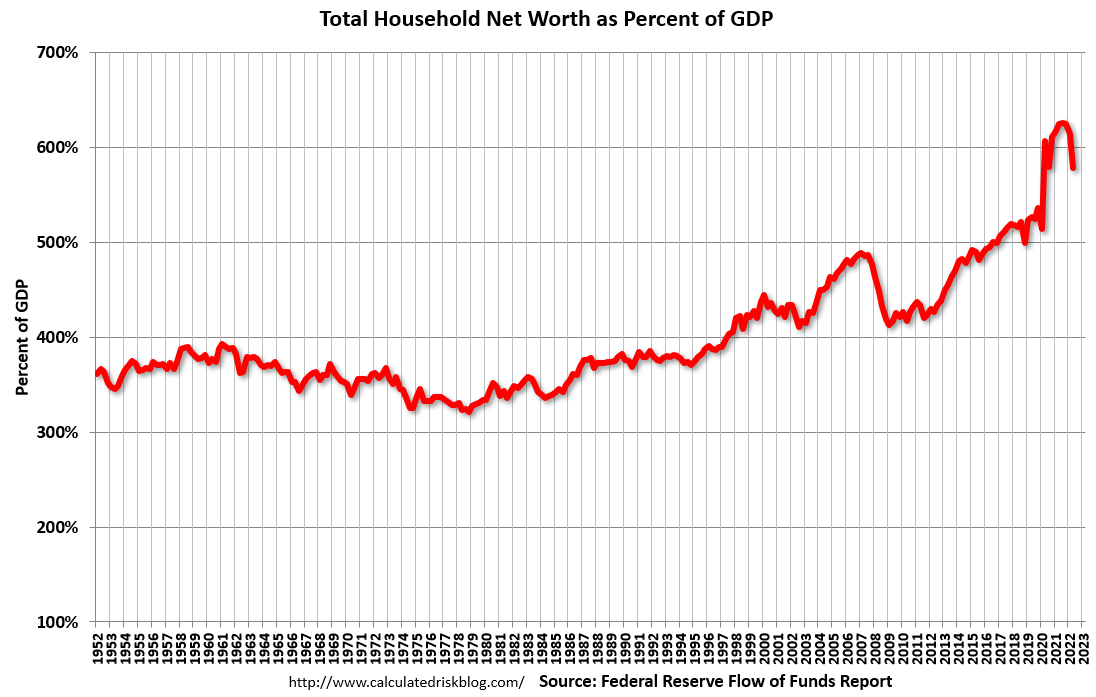
The net worth of households and nonprofits fell to $143.8 trillion during the second quarter of 2022. The value of directly and indirectly held corporate equities decreased $7.7 trillion and the value of real estate increased $1.4 trillion
...
Household debt increased 7.4 percent at an annual rate in the second quarter of 2022. Consumer credit grew at an annual rate of 8.5 percent, while mortgage debt (excluding charge-offs) grew at an annual rate of 8.8 percent.
 Click on graph for larger image.
The first graph shows Households and Nonprofit net worth as a percent of GDP.
Net worth as a percent of GDP is down from the all-time high in Q4.
This includes real estate and financial assets (stocks, bonds, pension reserves, deposits, etc) net of liabilities (mostly mortgages). Note that this does NOT include public debt obligations.
 The second graph shows homeowner percent equity since 1952.
Household percent equity (as measured by the Fed) collapsed when house prices fell sharply in 2007 and 2008.
In Q2 2022, household percent equity (of household real estate) was at 70.5% - up from 70.1% in Q1, 2022. This is the highest percent equity since the early 1980s.
Note: This includes households with no mortage debt.
 The third graph shows household real estate assets and mortgage debt as a percent of GDP. Note this graph was impacted by the sharp decline in Q2 2020 GDP.
Mortgage debt increased by $263 billion in Q2.
Mortgage debt is up $1.46 trillion from the peak during the housing bubble, but, as a percent of GDP is at 48.9% - up slightly from Q1 - and down from a peak of 73.3% of GDP during the housing bust.
The value of real estate, as a percent of GDP, increased in Q2, and is well above the average of the last 30 years.
 The second graph shows homeowner percent equity since 1952.
 Household percent equity (as measured by the Fed) collapsed when house prices fell sharply in 2007 and 2008.
In Q2 2022, household percent equity (of household real estate) was at 70.5% - up from 70.1% in Q1, 2022. This is the highest percent equity since the early 1980s.
Note: This includes households with no mortage debt.
 The third graph shows household real estate assets and mortgage debt as a percent of GDP. Note this graph was impacted by the sharp decline in Q2 2020 GDP.
Mortgage debt increased by $263 billion in Q2.
Mortgage debt is up $1.46 trillion from the peak during the housing bubble, but, as a percent of GDP is at 48.9% - up slightly from Q1 - and down from a peak of 73.3% of GDP during the housing bust.
The value of real estate, as a percent of GDP, increased in Q2, and is well above the average of the last 30 years.
1st Look at Local Housing Markets in August, Sales and New Listings Down Sharpy Year-over-year
by Calculated Risk on 9/09/2022 08:26:00 AM
Today, in the Calculated Risk Real Estate Newsletter: 1st Look at Local Housing Markets in August
A brief excerpt:
This is the first look at local markets in August. I’m tracking about 35 local housing markets in the US. Some of the 35 markets are states, and some are metropolitan areas. I’ll update these tables throughout the month as additional data is released.There is much more in the article. You can subscribe at https://calculatedrisk.substack.com/
We are seeing a sharp decline in closed sales, and inventory is up significantly year-over-year. Also, new listings are down as the sellers’ strike continues. The increase in inventory so far has been due to softer demand - likely because of higher mortgage rates.
In August, sales were down 26.1%. In July, these same markets were down 31.3% YoY.
Note that in August 2022, there was one more selling day than in August 2021, so the SA decline in August sales will be larger than the NSA decline. The opposite was true in July (one more selling day in July 2021 than in July 2022). So, seasonally adjusted, this is probably close to the same YoY decline as in July.
Many more local markets to come!

Thursday, September 08, 2022
Friday: Q2 Flow of Funds
by Calculated Risk on 9/08/2022 07:42:00 PM
Friday:
• At 12:00 PM ET, Q2 Flow of Funds Accounts of the United States from the Federal Reserve.
On COVID (focus on hospitalizations and deaths):
| COVID Metrics | ||||
|---|---|---|---|---|
| Now | Week Ago | Goal | ||
| New Cases per Day2 | 70,488 | 86,852 | ≤5,0001 | |
| Hospitalized2 | 29,359 | 31,574 | ≤3,0001 | |
| Deaths per Day2 | 313 | 436 | ≤501 | |
| 1my goals to stop daily posts, 27-day average for Cases, Currently Hospitalized, and Deaths 🚩 Increasing 7-day average week-over-week for Cases, Hospitalized, and Deaths ✅ Goal met. | ||||
 Click on graph for larger image.
This graph shows the daily (columns) and 7-day average (line) of deaths reported.
Average daily deaths bottomed in July 2021 at 214 per day.
Leading Index for Commercial Real Estate "Dips" in August
by Calculated Risk on 9/08/2022 05:32:00 PM
From Dodge Data Analytics: Dodge Momentum Index Dips in August
The Dodge Momentum Index (DMI) ticked down by 1.2% in August to 171.9 from the revised July figure of 174.0.
The Momentum Index, issued by Dodge Construction Network, is a monthly measure of the initial report for nonresidential building projects in planning, shown to lead construction spending for nonresidential buildings by a full year. In August, the commercial component of the Momentum Index rose 1%, while the institutional component fell 5.6%.
Commercial planning in August was led by an increase in hotel projects, while fewer healthcare projects drove the institutional component lower. Compared to August 2021, the Momentum Index was up 14%. The commercial component was 16% higher, and the institutional component was 10% higher than a year ago.
emphasis added
 Click on graph for larger image.
This graph shows the Dodge Momentum Index since 2002. The index was at 171.9 in August, down from 174.0 in July.
According to Dodge, this index leads "construction spending for nonresidential buildings by a full year". This index suggests a solid pickup in commercial real estate construction at the end of this year and into 2023.
FDIC: Problem Banks Unchanged, Residential REO Decreased Slightly in Q2 2022
by Calculated Risk on 9/08/2022 12:39:00 PM
The FDIC released the Quarterly Banking Profile for Q2 2022 this morning:
Quarterly net income totaled $64.4 billion in second quarter 2022, a reduction of $6.0 billion (8.5 percent) from the same quarter a year ago.
...
Loans and leases that are 30-89 days past due (past-due loan balances) increased from the year-ago quarter (up $11.4 billion, or 25.0 percent). Past-due consumer loans drove the increase from the year-ago quarter. The increase in past-due loan balances lifted the past due rate 6 basis points from the year-ago quarter to 0.48 percent. The past-due rate remained unchanged from the previous quarter, however, as loan growth outpaced the quarterly growth in past due loans. Despite the recent increase, the past-due rate remains below the pre-pandemic average of 0.66 percent.
emphasis added
 Click on graph for larger image.
The FDIC reported the number of problem banks was unchanged at 40.
The number of FDIC-insured institutions declined from 4,796 in first quarter 2022 to 4,771. In second quarter, 6 banks opened and 28 institutions merged with other FDIC-insured institutions. The number of banks on the FDIC’s “Problem Bank List” remained unchanged from first quarter at 40, the lowest level since QBP data collection began in 1984. Total assets of problem banks declined $2.7 billion to $170.4 billion. No banks failed in the second quarter.This graph from the FDIC shows the number of problem banks and assets at problem institutions.
Note: The number of assets for problem banks increased significantly back in 2018 when Deutsche Bank Trust Company Americas was added to the list. An even larger bank was added to the list last year, although the identity of the bank is unclear.
 The dollar value of 1-4 family residential Real Estate Owned (REOs, foreclosure houses) decreased slightly from $788 million in Q1 2022 to $784 million in Q2 2022.
 This graph shows the nominal dollar value of Residential REO for FDIC insured institutions. Note: The FDIC reports the dollar value and not the total number of REOs.
"Wholesale Used-Vehicle Prices Decline Substantially in August"
by Calculated Risk on 9/08/2022 10:41:00 AM
From Manheim Consulting today: Wholesale Used-Vehicle Prices Decline Substantially in August
Wholesale used-vehicle prices (on a mix, mileage, and seasonally adjusted basis) decreased 4.0% in August from July. The Manheim Used Vehicle Value Index declined to 210.8 but is up 8.4% from a year ago. The non-adjusted price change in August was a decline of 2.6% compared to July, leaving the unadjusted average price up 5.9% year over year.
emphasis added
 Click on graph for larger image.
This index from Manheim Consulting is based on all completed sales transactions at Manheim’s U.S. auctions.
The Manheim index suggests used car prices decreased in August and are up 8.4% year-over-year (YoY).
The YoY change is mostly getting smaller. This index was up 45% YoY in January. It is likely this index will be down YoY in September.
Homebuilder Comments in August: Increased Incentives Helping Sales, "Construction cycle time has improved"
by Calculated Risk on 9/08/2022 09:17:00 AM
Today, in the Calculated Risk Real Estate Newsletter: Homebuilder Comments in August: Increased Incentives Helping Sales
A brief excerpt:
Here are some interesting homebuilder comments from around the country. In August, builders have cut prices and increased incentives. And cycle times are improving with less demand.There many more comments in the article. You can subscribe at https://calculatedrisk.substack.com/
Homebuilder comments courtesy of Rick Palacios Jr., Director of Research at John Burns Real Estate Consulting (a must follow for housing on twitter!):
#Austin builder: “A lot of spec inventory to work through. August was a very poor month for sales across the board. Cancellations spiked from July and buyers showed no sense of urgency.”
#Baltimore builder: “Jumbo loan rates below 5% are helping buyers move forward in that segment.”
#Boise builder: “Construction cycle time has improved over the last 30 days.”
#Charlotte builder: “Sales were fairly strong in August. Increased incentives to help with closing costs and a buy down rate appear to be helping.”
#Cleveland builder: “Build cycle times have been improving over the last 4 or 5 months. Appointments have completely dropped off and traffic is very sparse at the models.”
Weekly Initial Unemployment Claims decrease to 222,000
by Calculated Risk on 9/08/2022 08:33:00 AM
The DOL reported:
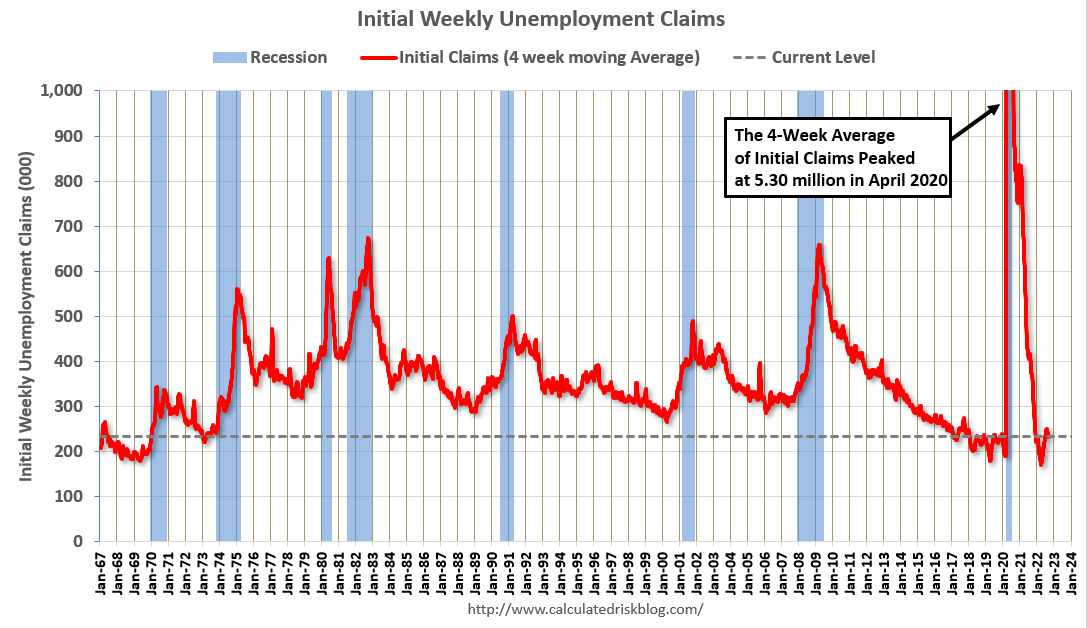
In the week ending September 3, the advance figure for seasonally adjusted initial claims was 222,000, a decrease of 6,000 from the previous week's revised level. The previous week's level was revised down by 4,000 from 232,000 to 228,000. The 4-week moving average was 233,000, a decrease of 7,500 from the previous week's revised average. The previous week's average was revised down by 1,000 from 241,500 to 240,500.The following graph shows the 4-week moving average of weekly claims since 1971.
emphasis added
 Click on graph for larger image.
The dashed line on the graph is the current 4-week average. The four-week average of weekly unemployment claims decreased to 233,000.
The previous week was revised down.
Weekly claims were below the consensus forecast.


