 RSS Feed
 by Calculated Risk on 7/31/2022 09:02:00 PM
Sunday, July 31, 2022
Monday: ISM Mfg, Construction Spending
Weekend:
• Schedule for Week of July 31, 2022
Monday:
• (likely, might be Tuesday) At 8:00 AM ET, Corelogic House Price index for June
• 10:00 AM, ISM Manufacturing Index for July. The consensus is for the ISM to be at 52.0, down from 53.0 in June.
• 10:00 AM, Construction Spending for June. The consensus is for a 0.2% increase in construction spending.
• 2:00 PM, Senior Loan Officer Opinion Survey on Bank Lending Practices for July.
From CNBC: Pre-Market Data and Bloomberg futures S&P 500 are down 15 and DOW futures are down 112 (fair value).
Oil prices were mixed over the last week with WTI futures at $98.62 per barrel and Brent at $103.97 per barrel. A year ago, WTI was at $74, and Brent was at $78 - so WTI oil prices are up 33% year-over-year.
Here is a graph from Gasbuddy.com for nationwide gasoline prices. Nationally prices are at $4.18 per gallon. A year ago, prices were at $3.16 per gallon, so gasoline prices are up $1.02 per gallon year-over-year.
30-Year Mortgage Rates Decrease to 5.13%
by Calculated Risk on 7/31/2022 10:51:00 AM
After reaching 6.28% on June 14th, 30-year mortgage rates decreased to 5.13% on Friday according to Mortgagenewsdaily.com. The 10-year Treasury yield has fallen to 2.66%, likely due to the weaker economy.
 Here is a graph from Mortgagenewsdaily.com that shows the 30-year mortgage rate since 2017.
Although mortgage rates have fallen sharply over the last 6 weeks, rates are still much higher than earlier this year.
Last year, in July 2021, 30-year mortgage rates average 2.87% according to the Freddie Mac PMMS. So, rates are up 79% year-over-year!
Saturday, July 30, 2022
Real Estate Newsletter Articles this Week
by Calculated Risk on 7/30/2022 02:11:00 PM
At the Calculated Risk Real Estate Newsletter this week:
• New Home Sales Decrease Sharply, Record Months of Unsold Inventory Under Construction
• Case-Shiller National Index up 19.7% Year-over-year in May
• Will Housing Inventory Follow the Normal Seasonal Pattern?
• Real House Prices and Price-to-Rent Ratio in May
• Median vs Repeat Sales Index House Prices
• Rent Increases Up Sharply Year-over-year, Pace Continues to Slow
This is usually published 4 to 6 times a week and provides more in-depth analysis of the housing market.
You can subscribe at https://calculatedrisk.substack.com/
Most content is available for free (and no Ads), but please subscribe!
Schedule for Week of July 31, 2022
by Calculated Risk on 7/30/2022 08:11:00 AM
The key report this week is the July employment report.
Other key reports include ISM manufacturing and services indexes, July vehicle sales, and the Trade deficit for June.
8:00 AM ET: Corelogic House Price index for June
10:00 AM: ISM Manufacturing Index for July. The consensus is for the ISM to be at 52.0, down from 53.0 in June.
10:00 AM: Construction Spending for June. The consensus is for a 0.2% increase in construction spending.
2:00 PM: Senior Loan Officer Opinion Survey on Bank Lending Practices for July.
 10:00 AM ET: Job Openings and Labor Turnover Survey for June from the BLS.
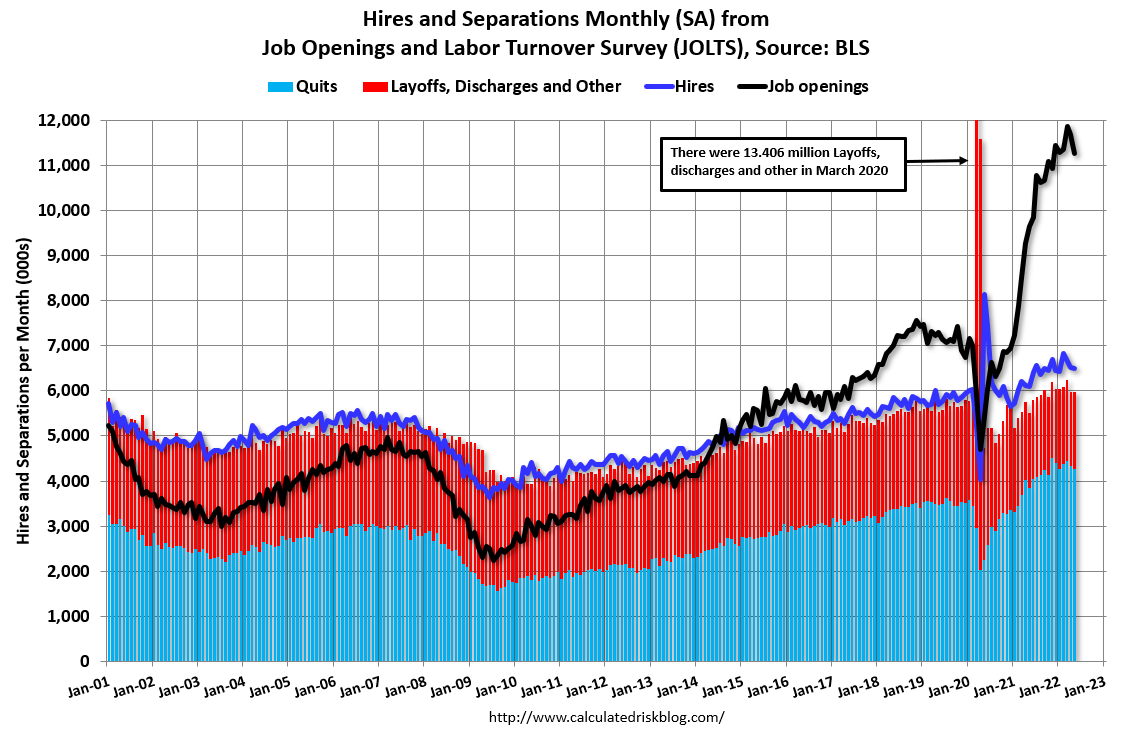
 This graph shows job openings (yellow line), hires (purple), Layoff, Discharges and other (red column), and Quits (light blue column) from the JOLTS.
Jobs openings decreased in May to 11.254 million from 11.681 million in April.
The number of job openings (yellow) were up 17% year-over-year and Quits were up 11% year-over-year.
10:00 AM: the Q2 2022 Housing Vacancies and Homeownership from the Census Bureau.
11:00 AM: NY Fed: Q2 Quarterly Report on Household Debt and Credit
 All Day: Light vehicle sales for July from the BEA. The consensus is for light vehicle sales to be 13.5 million SAAR in July, up from 13.0 million in June (Seasonally Adjusted Annual Rate).
This graph shows light vehicle sales since the BEA started keeping data in 1967. The dashed line is the sales rate for last month.
7:00 AM ET: The Mortgage Bankers Association (MBA) will release the results for the mortgage purchase applications index.
10:00 AM: the ISM Services Index for July. The consensus is for a reading of 53.5, down from 55.3.
 8:30 AM: Trade Balance report for June from the Census Bureau.
 This graph shows the U.S. trade deficit, with and without petroleum, through the most recent report. The blue line is the total deficit, and the black line is the petroleum deficit, and the red line is the trade deficit ex-petroleum products.
The consensus is the trade deficit to be $80.1 billion. The U.S. trade deficit was at $85.5 Billion the previous month.
8:30 AM: The initial weekly unemployment claims report will be released. The consensus is for 265 thousand up from 256 thousand last week.
 8:30 AM: Employment Report for July. The consensus is for 250,000 jobs added, and for the unemployment rate to be unchanged at 3.6%.
There were 372,000 jobs added in June, and the unemployment rate was at 3.6%.
This graph shows the job losses from the start of the employment recession, in percentage terms.
The current employment recession was by far the worst recession since WWII in percentage terms. However, the current employment recession, 28 months after the onset, has recovered quicker than the previous two recessions.
Friday, July 29, 2022
COVID July 29, 2022, Update on Cases, Hospitalizations and Deaths
by Calculated Risk on 7/29/2022 09:01:00 PM
On COVID (focus on hospitalizations and deaths):
Hospitalizations have almost quadrupled from the lows in April 2022.
 Click on graph for larger image.
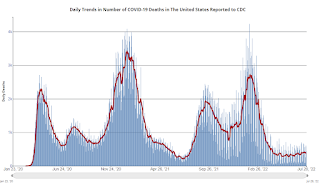
This graph shows the daily (columns) and 7-day average (line) of deaths reported.
| COVID Metrics | ||||
|---|---|---|---|---|
| Now | Week Ago | Goal | ||
| New Cases per Day2 | 125,355 | 128,981 | ≤5,0001 | |
| Hospitalized2🚩 | 37,013 | 35,853 | ≤3,0001 | |
| Deaths per Day2 | 373 | 396 | ≤501 | |
| 1my goals to stop daily posts, 27-day average for Cases, Currently Hospitalized, and Deaths 🚩 Increasing 7-day average week-over-week for Cases, Hospitalized, and Deaths ✅ Goal met. | ||||
 Click on graph for larger image.
This graph shows the daily (columns) and 7-day average (line) of deaths reported.
Average daily deaths bottomed in July 2021 at 214 per day.
Fannie Mae: Mortgage Serious Delinquency Rate Decreased in June
by Calculated Risk on 7/29/2022 05:39:00 PM
Fannie Mae reported that the Single-Family Serious Delinquency decreased to 0.81% in June from 0.87% in May. The serious delinquency rate is down from 2.08% in June 2021. This is almost back to pre-pandemic levels.
These are mortgage loans that are "three monthly payments or more past due or in foreclosure".
The Fannie Mae serious delinquency rate peaked in February 2010 at 5.59% following the housing bubble and peaked at 3.32% in August 2020 during the pandemic.
 Click on graph for larger image
By vintage, for loans made in 2004 or earlier (1% of portfolio), 2.75% are seriously delinquent (down from 2.86% in May).
For loans made in 2005 through 2008 (1% of portfolio), 4.45% are seriously delinquent (down from 4.67%),
For recent loans, originated in 2009 through 2021 (97% of portfolio), 0.63% are seriously delinquent (down from 0.69%). So, Fannie is still working through a few poor performing loans from the bubble years.
Mortgages in forbearance are counted as delinquent in this monthly report, but they will not be reported to the credit bureaus.
The pandemic related increase in delinquencies was very different from the increase in delinquencies following the housing bubble. Lending standards had been fairly solid over the previous decade, and most of these homeowners had equity in their homes - and the vast majority of these homeowners have been able to restructure their loans once they were employed.
Freddie Mac reported earlier.
Rent Increases Up Sharply Year-over-year, Pace Continues to Slow
by Calculated Risk on 7/29/2022 12:35:00 PM
Today, in the Calculated Risk Real Estate Newsletter: Rent Increases Up Sharply Year-over-year, Pace Continues to Slow
A brief excerpt:
Here is a graph of the year-over-year (YoY) change for these measures since January 2015. All of these measures are through June 2022 (Apartment List through July 2022).There is much more in the article. You can subscribe at https://calculatedrisk.substack.com/
Note that new lease measures (Zillow, Apartment List) dipped early in the pandemic, whereas the BLS measures were steady. Then new leases took off, and the BLS measures are picking up.
...
The Zillow measure is up 14.8% YoY in June, down from 16.0% YoY in May. This is down from a peak of 17.2% YoY in February.
The ApartmentList measure is up 12.4% YoY as of July, down from 14.1% in June. This is down from the peak of 18.0% YoY last December.
Clearly rents are still increasing, and we should expect this to continue to spill over into measures of inflation in 2022. The Owners’ Equivalent Rent (OER) was up 5.5% YoY in June, from 5.1% YoY in May - and will likely increase further in the coming months.
My suspicion is rent increases will slow over the coming months as the pace of household formation slows, and more supply comes on the market.

Q2 2022 GDP Details on Residential and Commercial Real Estate
by Calculated Risk on 7/29/2022 11:16:00 AM
The BEA released the underlying details for the Q2 advance GDP report this morning.
The BEA reported that investment in non-residential structures decreased at a 11.7% annual pace in Q2.
Investment in petroleum and natural gas structures increased in Q2 compared to Q1 and was up 31% year-over-year.
 Click on graph for larger image.
The first graph shows investment in offices, malls and lodging as a percent of GDP.
Investment in offices (blue) increased slightly in Q2 and was up 5.7% year-over-year. (Still declining as a percent of GDP).
Investment in multimerchandise shopping structures (malls) peaked in 2007 and was up about 10% year-over-year in Q2 - from a very low level. The vacancy rate for malls is still very high, so investment will probably stay low for some time.
Lodging investment increased slightly in Q2 compared to Q1, and lodging investment was down 2% year-over-year.
All three sectors - offices, malls, and hotels - were hurt significantly by the pandemic.
 The second graph is for Residential investment components as a percent of GDP. According to the Bureau of Economic Analysis, RI includes new single-family structures, multifamily structures, home improvement, Brokers’ commissions and other ownership transfer costs, and a few minor categories (dormitories, manufactured homes).
Even though investment in single family structures has increased from the bottom, single family investment is just approaching normal levels as a percent of GDP.
Investment in single family structures was $473 billion (SAAR) (about 1.9% of GDP), and up 17% year-over-year.
Investment in multi-family structures was unchanged in Q2 from Q1.
Investment in home improvement was at a $347 billion Seasonally Adjusted Annual Rate (SAAR) in Q2 (about 1.4% of GDP). Home improvement spending was strong during the pandemic.
Note that Brokers' commissions (black) increased sharply last year as existing home sales increased in the second half of 2020 but was down in Q2 2022. Brokers' commissions were unchanged year-over-year in Q4 (down as a percent of GDP).
Hotels: Occupancy Rate Down 6.0% Compared to Same Week in 2019
by Calculated Risk on 7/29/2022 10:26:00 AM
U.S. hotel performance increased from the previous week, according to STR‘s latest data through July 23.The following graph shows the seasonal pattern for the hotel occupancy rate using the four-week average.
July 17-23, 2022 (percentage change from comparable week in 2019*):
• Occupancy: 72.8% (-6.0%)
• Average daily rate (ADR): $158.79 (+16.4%)
• Revenue per available room (RevPAR): $115.59 (+9.3%)
*Due to the pandemic impact, STR is measuring recovery against comparable time periods from 2019.
emphasis added
 Click on graph for larger image.
The red line is for 2022, black is 2020, blue is the median, and dashed light blue is for 2021. Dashed purple is 2019 (STR is comparing to a strong year for hotels).
The 4-week average of the occupancy rate is just below the median rate for the previous 20 years (Blue).
Note: Y-axis doesn't start at zero to better show the seasonal change.
The 4-week average of the occupancy rate will peak in seasonally in a few weeks.
Personal Income increased 0.6% in June; Spending increased 1.1%
by Calculated Risk on 7/29/2022 08:37:00 AM
The BEA released the Personal Income and Outlays report for June:
Personal income increased $133.5 billion (0.6 percent) in June, according to estimates released today by the Bureau of Economic Analysis. Disposable personal income (DPI) increased $120.4 billion (0.7 percent) and personal consumption expenditures (PCE) increased $181.1 billion (1.1 percent).The June PCE price index increased 6.8 percent year-over-year (YoY), up from 6.3 percent YoY in May.
The PCE price index increased 1.0 percent. Excluding food and energy, the PCE price index increased 0.6 percent. Real DPI decreased 0.3 percent in June and real PCE increased 0.1 percent; goods increased 0.1 percent and services increased 0.1 percent.
emphasis added
The PCE price index, excluding food and energy, increased 4.8 percent YoY, up from 4.7 percent in May.
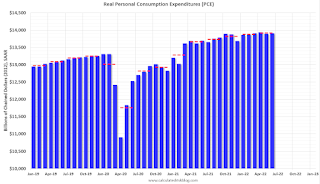
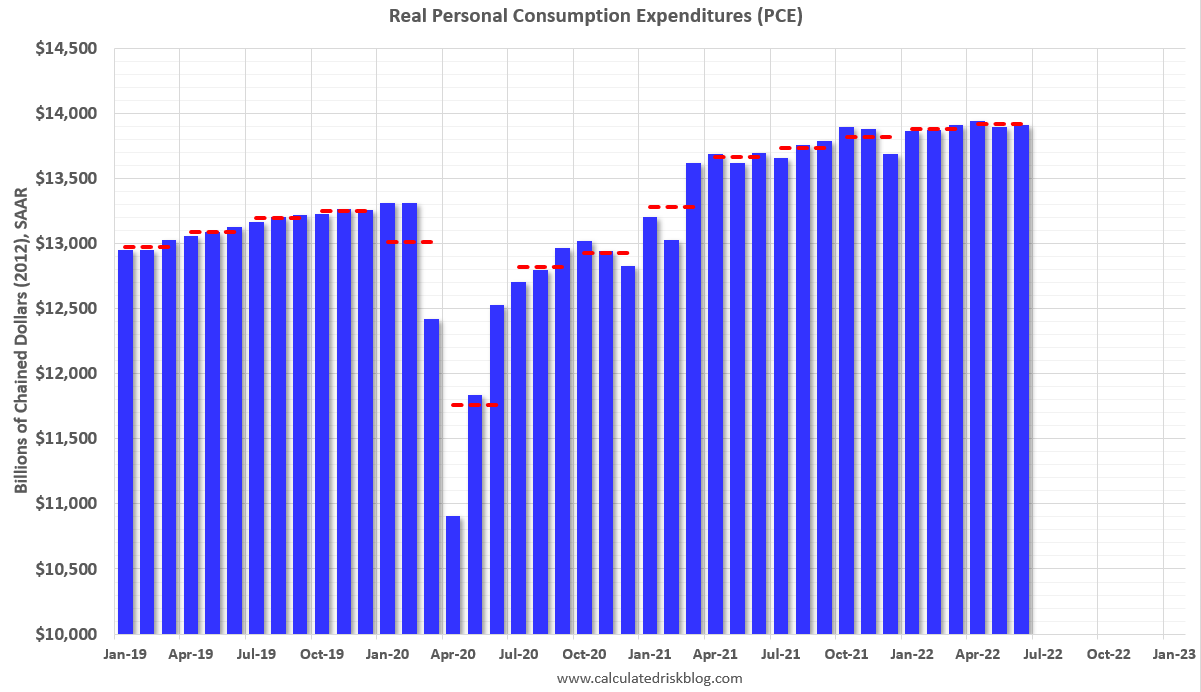
The following graph shows real Personal Consumption Expenditures (PCE) through June 2022 (2012 dollars). Note that the y-axis doesn't start at zero to better show the change.
 Click on graph for larger image.
The dashed red lines are the quarterly levels for real PCE.
Personal income and the increase in PCE were both above expectations.
Inflation was above expectations.


