 RSS Feed
 by Calculated Risk on 7/27/2022 10:07:00 AM
Wednesday, July 27, 2022
NAR: Pending Home Sales Decreased 8.6% in June
From the NAR: Pending Home Sales Fell 8.6% in June
Pending home sales decreased in June, following a slight increase in May, according to the National Association of REALTORS®. All four major regions posted month-over-month and year-over-year pullbacks, the largest of which occurred in the West.This was well below expectations for this index. Note: Contract signings usually lead sales by about 45 to 60 days, so this would usually be for closed sales in July and August.
The Pending Home Sales Index (PHSI), a forward-looking indicator of home sales based on contract signings, dipped 8.6% to 91.0 in June. Year-over-year, transactions shrank 20.0%. An index of 100 is equal to the level of contract activity in 2001.
"Contract signings to buy a home will keep tumbling down as long as mortgage rates keep climbing, as has happened this year to date," said NAR Chief Economist Lawrence Yun. "There are indications that mortgage rates may be topping or very close to a cyclical high in July. If so, pending contracts should also begin to stabilize."
According to NAR, buying a home in June was about 80% more expensive than in June 2019. Nearly a quarter of buyers who purchased a home three years ago would be unable to do so now because they no longer earn the qualifying income to buy a median-priced home today.
...
The Northeast PHSI slid 6.7% compared to last month to 80.9, down 17.6% from June 2021. The Midwest index dropped 3.8% to 93.7 in June, a 13.4% decline from a year ago.
The South PHSI slipped 8.9% to 108.3 in June, a decrease of 19.2% from the previous year. The West index slumped 15.9% in June to 68.7, down 30.9% from June 2021.
emphasis added
MBA: Mortgage Applications Decrease in Latest Weekly Survey
by Calculated Risk on 7/27/2022 07:00:00 AM
From the MBA: Mortgage Applications Decrease in Latest MBA Weekly Survey
Mortgage applications decreased 1.8 percent from one week earlier, according to data from the Mortgage Bankers Association’s (MBA) Weekly Mortgage Applications Survey for the week ending July 22, 2022.
... The Refinance Index decreased 4 percent from the previous week and was 83 percent lower than the same week one year ago. The seasonally adjusted Purchase Index decreased 1 percent from one week earlier. The unadjusted Purchase Index decreased 0.4 percent compared with the previous week and was 18 percent lower than the same week one year ago.
“Mortgage applications declined for the fourth consecutive week to the lowest level of activity since February 2000. Increased economic uncertainty and prevalent affordability challenges are dissuading households from entering the market, leading to declining purchase activity that is close to lows last seen at the onset of the pandemic,” said Joel Kan, MBA’s Associate Vice President of Economic and Industry Forecasting. “Weakening purchase applications trends in recent months have been consistent with data showing a slowdown in sales for newly constructed homes and existing homes. A potential silver lining for the housing market is that stabilizing mortgage rates and increases in for-sale inventory may bring some buyers back to the market during the second half of the year.”
Added Kan, “With mortgage rates remaining well over 5 percent, refinance applications are now 83 percent below last year’s pace.”
...
The average contract interest rate for 30-year fixed-rate mortgages with conforming loan balances ($647,200 or less) decreased to 5.74 percent from 5.82 percent, with points decreasing to 0.61 from 0.65 (including the origination fee) for 80 percent loan-to-value ratio (LTV) loans.
emphasis added
 Click on graph for larger image.
The first graph shows the refinance index since 1990.
With higher mortgage rates, the refinance index has declined sharply over the last several months.
The refinance index is at the lowest level since the year 2000.
The second graph shows the MBA mortgage purchase index
 According to the MBA, purchase activity is down 18% year-over-year unadjusted.
The purchase index is now only 13% above the pandemic low.
Note: Red is a four-week average (blue is weekly).
Note: Red is a four-week average (blue is weekly).
Tuesday, July 26, 2022
Wednesday: FOMC Statement, Durable Goods, Pending Home Sales
by Calculated Risk on 7/26/2022 09:02:00 PM
Wednesday:
• At 7:00 AM ET, The Mortgage Bankers Association (MBA) will release the results for the mortgage purchase applications index.
• At 8:30 AM, Durable Goods Orders for June from the Census Bureau. The consensus is for a 0.5% decrease in durable goods orders.
• At 10:00 AM, Pending Home Sales Index for June. The consensus is for a 3.7% decrease in the index.
• At 2:00 PM, FOMC Meeting Announcement. The FOMC is expected to raise rates 75 bps, increasing the target range for the federal funds rate to 2‑1/4 to 2-1/2 percent.
• At 2:30 PM, Fed Chair Jerome Powell holds a press briefing following the FOMC announcement.
On COVID (focus on hospitalizations and deaths):
Hospitalizations have almost quadrupled from the lows in April 2022.
 Click on graph for larger image.
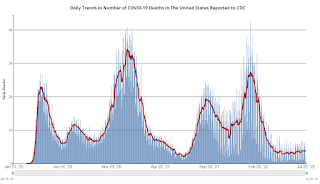
This graph shows the daily (columns) and 7-day average (line) of deaths reported.
| COVID Metrics | ||||
|---|---|---|---|---|
| Now | Week Ago | Goal | ||
| New Cases per Day2 | 124,549 | 127,314 | ≤5,0001 | |
| Hospitalized2🚩 | 36,312 | 34,737 | ≤3,0001 | |
| Deaths per Day2 | 367 | 384 | ≤501 | |
| 1my goals to stop daily posts, 27-day average for Cases, Currently Hospitalized, and Deaths 🚩 Increasing 7-day average week-over-week for Cases, Hospitalized, and Deaths ✅ Goal met. | ||||
 Click on graph for larger image.
This graph shows the daily (columns) and 7-day average (line) of deaths reported.
Average daily deaths bottomed in July 2021 at 214 per day.
July Vehicle Sales Forecast: Increase to 13.3 million SAAR
by Calculated Risk on 7/26/2022 04:42:00 PM
From WardsAuto: Not a Surge but July U.S. Light-Vehicle Sales Tracking Above Past Two Months (pay content). Brief excerpt:
"Wards Intelligence partner LMC Automotive is pegging the entire year at 14.3 million units, meaning the second-half SAAR will have to total 14.8 million units, up from first-half 2022’s 13.7 million ..."
 Click on graph for larger image.
This graph shows actual sales from the BEA (Blue), and Wards forecast for July (Red).
The Wards forecast of 13.3 million SAAR, would be up about 2% from last month, and down 9% from a year ago (sales were starting to weaken in mid-2021, due to supply chain issues).
Vehicle sales is usually a transmission mechanism for Federal Open Market Committee (FOMC) policy (far behind housing). However, this time, vehicle sales have been suppressed by supply chain issues, and will probably not be significantly impacted by higher interest rates.
Freddie Mac: Mortgage Serious Delinquency Rate decreased in June
by Calculated Risk on 7/26/2022 02:59:00 PM
Freddie Mac reported that the Single-Family serious delinquency rate in June was 0.76%, down from 0.80% May. Freddie's rate is down year-over-year from 1.86% in June 2021.
Freddie's serious delinquency rate peaked in February 2010 at 4.20% following the housing bubble and peaked at 3.17% in August 2020 during the pandemic.
These are mortgage loans that are "three monthly payments or more past due or in foreclosure".
 Click on graph for larger image
Mortgages in forbearance are being counted as delinquent in this monthly report but are not reported to the credit bureaus.
This is very different from the increase in delinquencies following the housing bubble. Lending standards have been fairly solid over the last decade, and most of these homeowners have equity in their homes - and they will be able to restructure their loans once (if) they are employed.
The serious delinquency rate was at 0.60% just prior to the pandemic - almost back.
New Home Sales Decrease Sharply, Record Months of Unsold Inventory Under Construction
by Calculated Risk on 7/26/2022 11:48:00 AM
Today, in the Calculated Risk Real Estate Newsletter: New Home Sales Decrease Sharply, Record Months of Unsold Inventory Under Construction
Brief excerpt:
The next graph shows the months of supply by stage of construction. “Months of supply” is inventory at each stage, divided by the sales rate.You can subscribe at https://calculatedrisk.substack.com/.
There are just over 0.83 months of completed supply (red line). This is about two-thirds of the normal level.
The inventory of new homes under construction is at 6.22 months (blue line) - well above the normal level. This elevated level of homes under construction is due to supply chain constraints. This is the all-time record; above the previous record set in 1980.
And a record 110 thousand homes have not been started - about 2.24 months of supply (grey line) - more than double the normal level. Homebuilders are probably waiting to start some homes until they have a firmer grasp on prices and demand.

New Home Sales Decrease Sharply to 590,000 Annual Rate in June
by Calculated Risk on 7/26/2022 10:09:00 AM
The Census Bureau reports New Home Sales in June were at a seasonally adjusted annual rate (SAAR) of 590 thousand.
The previous three months were revised down significantly.
Sales of new single‐family houses in June 2022 were at a seasonally adjusted annual rate of 590,000, according to estimates released jointly today by the U.S. Census Bureau and the Department of Housing and Urban Development. This is 8.1 percent below the revised May rate of 642,000 and is 17.4 percent below the June 2021 estimate of 714,000.
emphasis added
 Click on graph for larger image.
The first graph shows New Home Sales vs. recessions since 1963. The dashed line is the current sales rate.
New home sales are now below pre-pandemic levels.
The second graph shows New Home Months of Supply.
 The months of supply increased in June to 9.3 months from 8.4 months in May.
 The all-time record high was 12.1 months of supply in January 2009. The all-time record low was 3.5 months, most recently in October 2020.
This is well above the top of the normal range (about 4 to 6 months of supply is normal).
"The seasonally‐adjusted estimate of new houses for sale at the end of June was 457,000. This represents a supply of 9.3 months at the current sales rate."
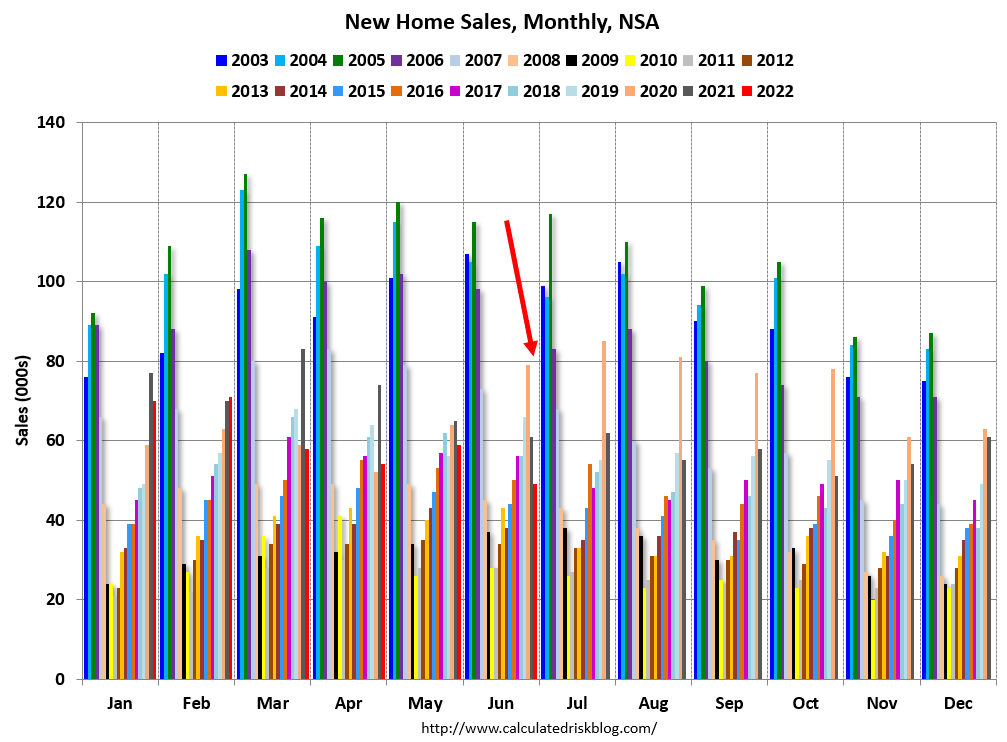 The last graph shows sales NSA (monthly sales, not seasonally adjusted annual rate).
In June 2022 (red column), 49 thousand new homes were sold (NSA). Last year, 61 thousand homes were sold in June.
The all-time high for June was 115 thousand in 2005, and the all-time low for June was 28 thousand in 2010 and in 2011.
This was well below expectations, and sales in the three previous months were revised down significantly. I'll have more later today.
Comments on May Case-Shiller and FHFA House Price Increases
by Calculated Risk on 7/26/2022 09:41:00 AM
Today, in the Calculated Risk Real Estate Newsletter: Case-Shiller National Index up 19.7% Year-over-year in May
Excerpt:
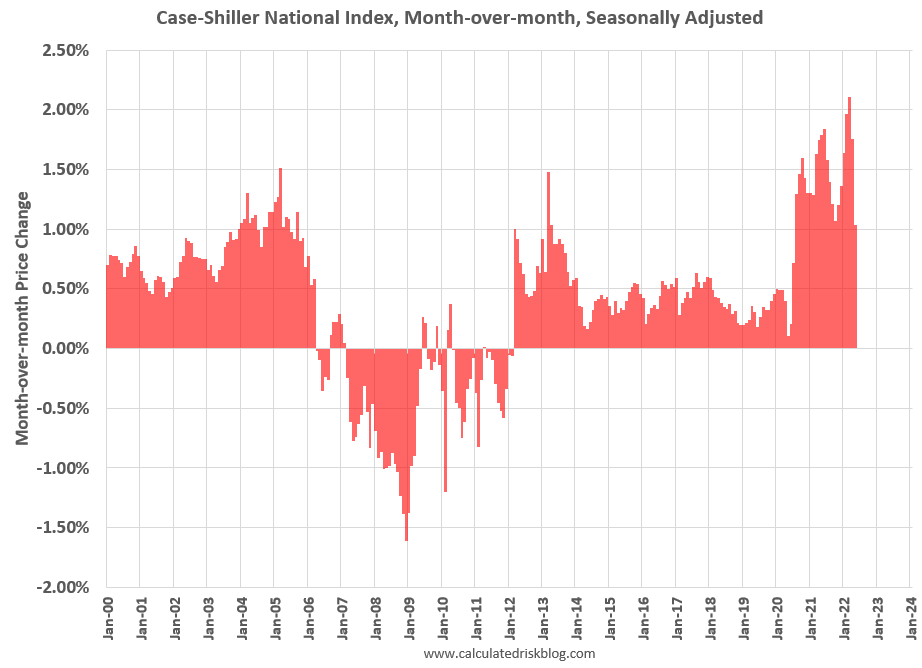
Both the Case-Shiller House Price Index (HPI) and the Federal Housing Finance Agency (FHFA) HPI for May were released today. Here is a graph of the month-over-month (MoM) change in the Case-Shiller National Index Seasonally Adjusted (SA).
The Case-Shiller Home Price Indices for “May” is a 3-month average of March, April and May closing prices. May closing prices include some contracts signed in January, so there is a significant lag to this data.
The MoM increase in Case-Shiller was at 1.04%. This was the smallest MoM increase since July 2020, and since this includes closings in March and April, this suggests price growth has slowed sharply.
There is much more in the article. You can subscribe at https://calculatedrisk.substack.com/
Case-Shiller: National House Price Index increased 19.7% year-over-year in May
by Calculated Risk on 7/26/2022 09:10:00 AM
S&P/Case-Shiller released the monthly Home Price Indices for May ("May" is a 3-month average of March, April and May prices).
This release includes prices for 20 individual cities, two composite indices (for 10 cities and 20 cities) and the monthly National index.
From S&P: S&P Corelogic Case-Shiller Index Reports Annual Home Price Gain Of 19.7% In May
The S&P CoreLogic Case-Shiller U.S. National Home Price NSA Index, covering all nine U.S. census divisions, reported a 19.7% annual gain in May, down from 20.6% in the previous month. The 10-City Composite annual increase came in at 19.0%, down from 19.6% in the previous month. The 20-City Composite posted a 20.5% year-over-year gain, down from 21.2% in the previous month.
Tampa, Miami, and Dallas reported the highest year-over-year gains among the 20 cities in May. Tampa led the way with a 36.1% year-over-year price increase, followed by Miami with a 34.0% increase, and Dallas with a 30.8% increase. Four of the 20 cities reported higher price increases in the year ending May 2022 versus the year ending April 2022.
...
Before seasonal adjustment, the U.S. National Index posted a 1.5% month-over-month increase in May, while the 10-City and 20-City Composites posted increases of 1.4% and 1.5%, respectively.
After seasonal adjustment, the U.S. National Index posted a month-over-month increase of 1.0%, and the 10-City and 20-City Composites both posted increases of 1.3%.
In May, all 20 cities reported increases before and after seasonal adjustments.
“Housing data for May 2022 continued strong, as price gains decelerated slightly from very high levels,” says Craig J. Lazzara, Managing Director at S&P DJI. “The National Composite Index rose by 19.7% for the 12 months ended May, down from April’s 20.6% year-over-year gain. We see a similar pattern in the 10-City Composite (up 19.0% in May vs. 19.6% in April) and in the 20-City Composite (+20.5% vs. +21.2%). Despite this deceleration, growth rates are still extremely robust, with all three composites at or above the 98th percentile historically
emphasis added
 Click on graph for larger image.
 The first graph shows the nominal seasonally adjusted Composite 10, Composite 20 and National indices (the Composite 20 was started in January 2000).
The Composite 10 index is up 1.3% in May (SA).
The Composite 20 index is up 1.3% (SA) in May.
The National index is 60% above the bubble peak (SA), and up 1.0% (SA) in May. The National index is up 119% from the post-bubble low set in February 2012 (SA).
 The second graph shows the year-over-year change in all three indices.
The Composite 10 SA is up 19.0% year-over-year. The Composite 20 SA is up 20.5% year-over-year.
The National index SA is up 19.7% year-over-year.
Price increases were slightly lower than expectations. I'll have more later.
Monday, July 25, 2022
Tuesday: New Home Sales, Case-Shiller House Prices, Richmond Fed Mfg
by Calculated Risk on 7/25/2022 08:55:00 PM
 Tuesday:
• At 9:00 AM ET, S&P/Case-Shiller House Price Index for May. The consensus is for a 21.0% year-over-year increase in the Comp 20 index for May.
• Also at 9:00 AM, FHFA House Price Index for May. This was originally a GSE only repeat sales, however there is also an expanded index.
• At 10:00 AM, New Home Sales for June from the Census Bureau. The consensus is for 666 thousand SAAR, down from 696 thousand in May.
• Also at 10:00 AM, Richmond Fed Survey of Manufacturing Activity for July.
On COVID (focus on hospitalizations and deaths):
Hospitalizations have almost quadrupled from the lows in April 2022.
 Click on graph for larger image.
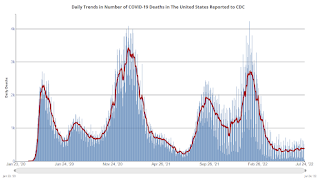
This graph shows the daily (columns) and 7-day average (line) of deaths reported.
| COVID Metrics | ||||
|---|---|---|---|---|
| Now | Week Ago | Goal | ||
| New Cases per Day2 | 120,032 | 129,355 | ≤5,0001 | |
| Hospitalized2 | 33,226 | 34,347 | ≤3,0001 | |
| Deaths per Day2 | 365 | 380 | ≤501 | |
| 1my goals to stop daily posts, 27-day average for Cases, Currently Hospitalized, and Deaths 🚩 Increasing 7-day average week-over-week for Cases, Hospitalized, and Deaths ✅ Goal met. | ||||
 Click on graph for larger image.
This graph shows the daily (columns) and 7-day average (line) of deaths reported.
Average daily deaths bottomed in July 2021 at 214 per day.


