 RSS Feed
 by Calculated Risk on 7/13/2022 07:00:00 AM
Wednesday, July 13, 2022
MBA: Mortgage Applications Decrease in Latest Weekly Survey
From the MBA: Mortgage Applications Decrease in Latest MBA Weekly Survey
— Mortgage applications decreased 1.7 percent from one week earlier, according to data from the Mortgage Bankers Association’s (MBA) Weekly Mortgage Applications Survey for the week ending July 8, 2022. This week’s results include an adjustment for the observance of Independence Day.
... The Refinance Index increased 2 percent from the previous week and was 80 percent lower than the same week one year ago. The seasonally adjusted Purchase Index decreased 4 percent from one week earlier. The unadjusted Purchase Index decreased 14 percent compared with the previous week and was 18 percent lower than the same week one year ago.
"Mortgage rates were mostly unchanged, but applications declined for the second straight week. Purchase applications for both conventional and government loans continue to be weaker due to the combination of much higher mortgage rates and the worsening economic outlook,” said Joel Kan, MBA’s Associate Vice President of Economic and Industry Forecasting. “After reaching a record $460,000 in March 2022, the average purchase loan size was $415,000 last week, pulled lower by the potential moderation of home-price growth and weaker purchase activity at the upper end of the market.”
Added Kan, “Refinance applications increased slightly last week, driven by an uptick in conventional and FHA refinances. The overall refinance index remained 5 percent below the average level reported in June. With the 30-year fixed rate 265 basis points higher than a year ago, refinance applications are expected to remain depressed.”
...
The average contract interest rate for 30-year fixed-rate mortgages with conforming loan balances ($647,200 or less) remained at 5.74 percent, with points decreasing to 0.59 from 0.65 (including the origination fee) for 80 percent loan-to-value ratio (LTV) loans.
emphasis added
 Click on graph for larger image.
The first graph shows the refinance index since 1990.
With higher mortgage rates, the refinance index has declined sharply over the last several months.
The refinance index is just above the lowest level since the year 2000.
The second graph shows the MBA mortgage purchase index
 According to the MBA, purchase activity is down 18% year-over-year unadjusted.
Note: Red is a four-week average (blue is weekly).
Tuesday, July 12, 2022
Wednesday: CPI, Beige Book
by Calculated Risk on 7/12/2022 09:01:00 PM
Wednesday:
• At 7:00 AM ET, The Mortgage Bankers Association (MBA) will release the results for the mortgage purchase applications index.
• At 8:30 AM, The Consumer Price Index for June from the BLS. The consensus is for a 1.1% increase in CPI, and a 0.6% increase in core CPI. The consensus is for CPI to be up 8.8% year-over-year and core CPI to be up 5.8% YoY.
• At 2:00 PM, the Federal Reserve Beige Book, an informal review by the Federal Reserve Banks of current economic conditions in their Districts.
On COVID (focus on hospitalizations and deaths):
| COVID Metrics | ||||
|---|---|---|---|---|
| Now | Week Ago | Goal | ||
| Percent fully Vaccinated | 67.0% | --- | ≥70.0%1 | |
| Fully Vaccinated (millions) | 222.5 | --- | ≥2321 | |
| New Cases per Day3🚩 | 118,026 | 105,890 | ≤5,0002 | |
| Hospitalized3🚩 | 31,036 | 28,508 | ≤3,0002 | |
| Deaths per Day3 | 306 | 325 | ≤502 | |
| 1 Minimum to achieve "herd immunity" (estimated between 70% and 85%). 2my goals to stop daily posts, 37-day average for Cases, Currently Hospitalized, and Deaths 🚩 Increasing 7-day average week-over-week for Cases, Hospitalized, and Deaths ✅ Goal met. | ||||
 Click on graph for larger image.
This graph shows the daily (columns) and 7-day average (line) of deaths reported.
Average daily deaths bottomed in July 2021 at 214 per day.
Leading Index for Commercial Real Estate "Slight Gain In June"
by Calculated Risk on 7/12/2022 02:19:00 PM
From Dodge Data Analytics: Dodge Momentum Index Hits 14-Year High With Slight Gain In June
The Dodge Momentum Index (DMI) increased less than one percentage point in June to 173.6 (2000=100) from the revised May reading of 173.1, pushing the measure to a 14-year high.
The Momentum Index, issued by Dodge Construction Network, is a monthly measure of the initial report for nonresidential building projects in planning. The index is shown to lead construction spending for nonresidential buildings by a full year. In June, the commercial component of the Momentum Index rose 4.1%, while the institutional component fell 6.2%.
emphasis added
 Click on graph for larger image.
This graph shows the Dodge Momentum Index since 2002. The index was at 173.6 in June, up from 173.1 in May.
According to Dodge, this index leads "construction spending for nonresidential buildings by a full year". This index suggested a decline in Commercial Real Estate construction through most of 2021, but a solid pickup this year and into 2023.
2nd Look at Local Housing Markets in June, Sales Down Sharply Year-over-year
by Calculated Risk on 7/12/2022 11:10:00 AM
Today, in the Calculated Risk Real Estate Newsletter: 2nd Look at Local Housing Markets in June
A brief excerpt:
We are seeing a significant change in inventory, and maybe a pickup in new listings. So far, most of the increase in inventory has been due to softer demand - likely because of higher mortgage rates - but we need to keep an eye on new listings too.There is much more in the article. You can subscribe at https://calculatedrisk.substack.com/
We are also seeing a sharp decline in closings in June, and this might be due to buyers cancelling escrow because of the increase in mortgage rates. Here is a table comparing the year-over-year Not Seasonally Adjusted (NSA) declines in sales this year from the National Association of Realtors® (NAR) with the local markets I track. So far, these measures have tracked closely, and the preliminary data below suggests a sharp decline in sales in June.
On cancellations, Lily Katz and Ben Walzer at Redfin wrote yesterday: The Deal Is Off: Home Sales Are Getting Canceled at the Highest Rate Since the Start of the Pandemic
Nationwide, roughly 60,000 home-purchase agreements fell through in June, equal to 14.9% of homes that went under contract that month. That’s the highest percentage on record with the exception of March and April 2020, when the housing market all but ground to a halt due to the onset of the coronavirus pandemic. It compares with 12.7% a month earlier and 11.2% a year earlier.

Reis: Office Vacancy Rate Increased in Q2, Mall Vacancy Rate Unchanged
by Calculated Risk on 7/12/2022 08:11:00 AM
From Moody’s Analytics Senior Economist Lu Chen: Apartment sets new record, Office continued its bumpy ride, and Retail stayed flat
Given the intriguing supply and demand dynamics, office vacancy trended up 30 bps and finished the2nd quarter at 18.4%, merely 10 bps lower than its pandemic high in Q2 2021. On the rent front, both asking and effective rents edged up 0.4% during the quarter – these are the highest growth rates since the pandemic began. .
...
Our data shows the national vacancy for neighborhood and community shopping center has stayed flat at 10.3%, while asking rent is virtually unchanged and effective rent inched up 0.1% in the second quarter. Trend data on regional and super regional malls tells a similar story. Vacancy stayed flat at 11% and effective rent was up 0.1% this quarter.
emphasis added
Reis reported the office vacancy rate was at 18.4% in Q2 2022, up from 18.1% in Q1, and down from 18.5% in Q2 2021.
Q2 2021 saw the highest vacancy rate for offices since the early '90s (following the S&L crisis)
NOTE: This says nothing about how many people are in the offices (related to the increase in work-from-home), just whether or not the office space is leased.
 Click on graph for larger image.
This graph shows the office vacancy rate starting in 1980 (prior to 1999 the data is annual).
The office vacancy rate was elevated prior to the pandemic and moved up during the pandemic.
Reis also reported that office effective rents were increased 0.4% in Q2; rents are about at the same as in early 2019.
For Neighborhood and Community malls (strip malls), the vacancy rate was 10.3% in Q2, unchanged from 10.3% in Q1, and down from 10.6% in Q2 2021. For strip malls, the vacancy rate peaked during the pandemic at 10.6% in both Q1 and Q2 2021.
 This graph shows the strip mall vacancy rate starting in 1980 (prior to 2000 the data is annual). The regional mall data starts in 2000. Back in the '80s, there was overbuilding in the mall sector even as the vacancy rate was rising. This was due to the very loose commercial lending that led to the S&L crisis.
 In the mid-'00s, mall investment picked up as mall builders followed the "roof tops" of the residential boom (more loose lending). This led to the vacancy rate moving higher even before the recession started. Then there was a sharp increase in the vacancy rate during the recession and financial crisis.
In the last several years, even prior to the pandemic, the regional mall vacancy rates increased significantly from an already elevated level.
Effective rents have been mostly unchanged for regional malls over the last 3 years, and flat for strip malls for 5+ years.
All vacancy data courtesy of Moody’s Analytics Reis
Monday, July 11, 2022
Key Week for Inflation and Mortgage Rates
by Calculated Risk on 7/11/2022 09:31:00 PM
 From Matthew Graham at Mortgage News Daily: Lots at Stake With Important Inflation Data This Week
Ultimately, the week will depend on the outcome of several inflation reports. The first one, Wednesday's CPI, is also by far the most important. Producer prices follow on Thursday and the inflation expectation component of the Consumer Sentiment data hit on Friday morning. If CPI hasn't already sent a strong enough message by mid-week, this trifecta of reports should go a long way toward helping the market pick a winner between 50bps and 75bps for the next Fed rate hike. It should also offer a strong comment on how high or low the ceiling should be for the trading range in bond yields. [30 year fixed 5.77%]Tuesday:
emphasis added
• At 6:00 AM ET, NFIB Small Business Optimism Index for June.
On COVID (focus on hospitalizations and deaths):
| COVID Metrics | ||||
|---|---|---|---|---|
| Now | Week Ago | Goal | ||
| Percent fully Vaccinated | 67.0% | --- | ≥70.0%1 | |
| Fully Vaccinated (millions) | 222.5 | --- | ≥2321 | |
| New Cases per Day3 | 103,907 | 112,666 | ≤5,0002 | |
| Hospitalized3🚩 | 28,320 | 28,238 | ≤3,0002 | |
| Deaths per Day3 | 281 | 352 | ≤502 | |
| 1 Minimum to achieve "herd immunity" (estimated between 70% and 85%). 2my goals to stop daily posts, 37-day average for Cases, Currently Hospitalized, and Deaths 🚩 Increasing 7-day average week-over-week for Cases, Hospitalized, and Deaths ✅ Goal met. | ||||
 Click on graph for larger image.
This graph shows the daily (columns) and 7-day average (line) of deaths reported.
Average daily deaths bottomed in July 2021 at 214 per day.
Q2 2022 Update: Unofficial Problem Bank list Decreased to 52 Institutions; Search for "Whale" Continues
by Calculated Risk on 7/11/2022 04:11:00 PM
The FDIC's official problem bank list is comprised of banks with a CAMELS rating of 4 or 5, and the list is not made public (just the number of banks and assets every quarter). Note: Bank CAMELS ratings are also not made public.
CAMELS is the FDIC rating system, and stands for Capital adequacy, Asset quality, Management, Earnings, Liquidity and Sensitivity to market risk. The scale is from 1 to 5, with 1 being the strongest.
As a substitute for the CAMELS ratings, surferdude808 is using publicly announced formal enforcement actions, and also media reports and company announcements that suggest to us an enforcement action is likely, to compile a list of possible problem banks in the public interest.
DISCLAIMER: This is an unofficial list, the information is from public sources only, and while deemed to be reliable is not guaranteed. No warranty or representation, expressed or implied, is made as to the accuracy of the information contained herein and same is subject to errors and omissions. This is not intended as investment advice. Please contact CR with any errors.
NOTE: I'm no longer updating the spreadsheet.
Here are the quarterly changes and a few comments from surferdude808:
Regulators still haven't disclosed the "whale" (that added close to $120 billion to problem assets).
Here are the quarterly changes and a few comments from surferdude808:
Update on the Unofficial Problem Bank List through June 30, 2022. Since the last update at the end of March 2022, the list decreased by two to 52 institutions after an addition and three removals. Assets decreased by $6.1 billion to $54.4 billion, with the change primarily resulting from a $6.1 billion decrease from updated asset figures through March 31, 2021. A year ago, the list held 65 institutions with assets of $51.8 billion. Added during the second quarter was St. Landry Bank and Trust Company, Opelousas, LA ($324 million). Removals during the quarter because of unassisted mergers included First National Bank of Muscatine, Muscatine, IA ($368 million); Lincoln 1st Bank, Lincoln Park, NJ ($261 million); and First National Bank in Fairfield, Fairfield, IA ($154 million).
With the conclusion of the second quarter, we bring an updated transition matrix to detail how banks are transitioning off the Unofficial Problem Bank List. Since we first published the Unofficial Problem Bank List on August 7, 2009 with 389 institutions, 1,784 institutions have appeared on a weekly or monthly list since then. Only 2.9 percent of the banks that have appeared on a list remain today as 1,732 institutions have transitioned through the list. Departure methods include 1,022 action terminations, 411 failures, 280 mergers, and 19 voluntary liquidations. Of the 389 institutions on the first published list, only 3 or less than 1.0 percent, still have a troubled designation more than ten years later. The 411 failures represent 23.1 percent of the 1,784 institutions that have made an appearance on the list. This failure rate is well above the 10-12 percent rate frequently cited in media reports on the failure rate of banks on the FDIC's official list.
On June 21, 2022, the FDIC released first quarter results and provided an update on the Official Problem Bank List. While FDIC did not make a comment within its press release on the Official Problem Bank List, they provided details in an attachment that listed 40 institutions with assets of $173 billion. The FDIC list had a material $119 billion increase in assets during the first quarter of 2022. None of the prudential banking regulators – FDIC, Federal Reserve, and OCC – have publicly released an enforcement action detailing the large institution added. The Financial Institutions Reform, Recovery and Enforcement Act (FIRREA) passed by Congress in 1989 requires publication of enforcement actions. See “Supervisory Enforcement Actions Since FIRREA and FDICIA,” published by the Federal reserve Bank of Minneapolis for further details. Prior to FIRREA, enforcement actions were not published by the prudential banking regulators. Section 913 of FIRREA requires public disclosures of enforcement actions. Section 913(2) does allow a delay in the enforcement action publication if “exceptional circumstances” exist. The prudential regulator must make a written determination that publication “would seriously threaten the safety & soundness of an insured depository institution.” The prudential regulator “may delay the publication of such order for a reasonable time.” The section does not define “a reasonable time.” It has been nearly six months since that enforcement action was issued, so it is unknown what constitutes “reasonable time.”
Second Home Market: South Lake Tahoe in June
by Calculated Risk on 7/11/2022 02:02:00 PM
With the pandemic, there was a surge in 2nd home buying.
I'm looking at data for some second home markets - and I'm tracking those markets to see if there is an impact from lending changes, rising mortgage rates or the easing of the pandemic.
This graph is for South Lake Tahoe since 2004 through June 2022, and shows inventory (blue), and the year-over-year (YoY) change in the median price (12-month average).
Note: The median price is distorted by the mix, but this is the available data.
 Click on graph for larger image.
Following the housing bubble, prices declined for several years in South Lake Tahoe, with the median price falling about 50% from the bubble peak.
Currently inventory is still very low, but up 5-fold from the record low set in February 2022, and up 54% year-over-year. Prices are up 14.0% YoY (but the YoY change has been trending down).
The second graph is from Eric Finnigan at John Burns Real Estate Consulting "the Second-Home Rush of 2020, in hindsight".
 The graph shows weekly 2nd home mortgage count.
The pandemic boom is obvious, and it now appears that 2nd home buying has declined to 2019 levels.
Homebuilder Comments in June: “Someone turned out the lights on our sales in June!"
by Calculated Risk on 7/11/2022 11:00:00 AM
Today, in the Calculated Risk Real Estate Newsletter: Homebuilder Comments in June: “Someone turned out the lights on our sales in June!""
A brief excerpt:
Read these builder comments from around the country. Sales have declined sharply in June.There many more comments in the article. You can subscribe at https://calculatedrisk.substack.com/
Some homebuilder comments courtesy of Rick Palacios Jr., Director of Research at John Burns Real Estate Consulting (a must follow for housing on twitter!):
#Atlanta builder: “Someone turned out the lights on our sales in June!”
#Austin builder: “Sales have fallen off a cliff. We’re selling 1/3 of what we sold in March and April. Trades are more willing to negotiate pricing since market has adjusted significantly past 60 days.”
#Birmingham builder: “Sales have fallen 75% the last two months in a further out community.”
#Boise builder: “Sales have slowed tremendously. Builders are dropping prices and halting new starts. Seeing prices drop on labor due to slowing of home starts. Expecting 15% to 20% reduction in most costs.”
Housing Inventory July 11th Update: Up 32% Year-over-year
by Calculated Risk on 7/11/2022 10:15:00 AM
Inventory is increasing rapidly. Inventory bottomed seasonally at the beginning of March 2022 and is now up 104% since then. More than double!
Altos reports inventory is up 31.7% year-over-year and is now 12.3% above the peak last year.
 Click on graph for larger image.
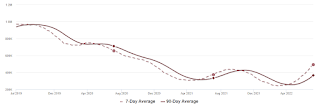
This inventory graph is courtesy of Altos Research.
 Click on graph for larger image.
This inventory graph is courtesy of Altos Research.
As of July 8th, inventory was at 491 thousand (7-day average), compared to 476 thousand the prior week.
Inventory is usually flat - or declines slightly - over the 4th of July weekend. This year inventory was up 3.2% from the previous week. Inventory is increasing much faster than normal for this time of year (both in percentage terms and in total inventory added).
Inventory is still historically low. Compared to the same week in 2021, inventory is up 31.7% from 373 thousand, however compared to the same week in 2020 inventory is down 25.0% from 654 thousand. Compared to 3 years ago, inventory is down 48.9% from 961 thousand.
Here are the inventory milestones I’m watching for with the Altos data:
1. The seasonal bottom (happened on March 4th for Altos) ✅
2. Inventory up year-over-year (happened on May 13th for Altos) ✅
3. Inventory up compared to two years ago (currently down 25.0% according to Altos)
4. Inventory up compared to 2019 (currently down 48.9%).
1. The seasonal bottom (happened on March 4th for Altos) ✅
2. Inventory up year-over-year (happened on May 13th for Altos) ✅
3. Inventory up compared to two years ago (currently down 25.0% according to Altos)
4. Inventory up compared to 2019 (currently down 48.9%).

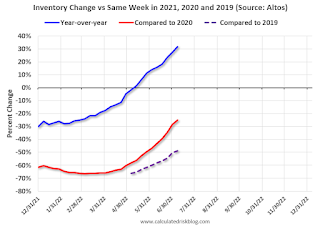
Here is a graph of the inventory change vs 2021, 2020 (milestone 3 above) and 2019 (milestone 4).
The blue line is the year-over-year data, the red line is compared to two years ago, and dashed purple is compared to 2019.
Two years ago (in 2020) inventory was declining all year, so the two-year comparison will get easier all year.
Based on the recent increases in inventory, my current estimate is inventory will be up compared to 2020 in late August of this year (in the next couple of months), and back to 2019 levels at the beginning of 2023.
Mike Simonsen discusses this data regularly on Youtube.


