 RSS Feed
 by Calculated Risk on 7/06/2022 02:10:00 PM
Wednesday, July 06, 2022
FOMC Minutes "Near-term inflation outlook had deteriorated"
From the Fed: Minutes of the Federal Open Market Committee, June 14-15, 2022. Excerpt on inflation risks:
In their discussion of risks, participants emphasized that they were highly attentive to inflation risks and were closely monitoring developments regarding both inflation and inflation expectations. Most agreed that risks to inflation were skewed to the upside and cited several such risks, including those associated with ongoing supply bottlenecks and rising energy and commodity prices. Participants judged that uncertainty about economic growth over the next couple of years was elevated. In that context, a couple of them noted that GDP and gross domestic income had been giving conflicting signals recently regarding the pace of economic growth, making it challenging to determine the economy's underlying momentum. Most participants assessed that the risks to the outlook for economic growth were skewed to the downside. Downside risks included the possibility that a further tightening in financial conditions would have a larger negative effect on economic activity than anticipated as well as the possibilities that the Russian invasion of Ukraine and the COVID-related lockdowns in China would have larger-than-expected effects on economic growth.
In their consideration of the appropriate stance of monetary policy, participants concurred that the labor market was very tight, inflation was well above the Committee's 2 percent inflation objective, and the near-term inflation outlook had deteriorated since the time of the May meeting. Against this backdrop, almost all participants agreed that it was appropriate to raise the target range for the federal funds rate 75 basis points at this meeting. One participant favored a 50 basis point increase in the target range at this meeting instead of 75 basis points. All participants judged that it was appropriate to continue the process of reducing the size of the Federal Reserve's balance sheet, as described in the Plans for Reducing the Size of the Federal Reserve's Balance Sheet that the Committee issued in May. In light of elevated inflation pressures and signs of deterioration in some measures of inflation expectations, all participants reaffirmed their strong commitment to returning inflation to the Committee's 2 percent objective. Participants observed that a return of inflation to the 2 percent objective was necessary for creating conditions conducive to a sustainably strong labor market over time.
In discussing potential policy actions at upcoming meetings, participants continued to anticipate that ongoing increases in the target range for the federal funds rate would be appropriate to achieve the Committee's objectives. In particular, participants judged that an increase of 50 or 75 basis points would likely be appropriate at the next meeting. Participants concurred that the economic outlook warranted moving to a restrictive stance of policy, and they recognized the possibility that an even more restrictive stance could be appropriate if elevated inflation pressures were to persist.
Participants noted that, with the federal funds rate expected to be near or above estimates of its longer-run level later this year, the Committee would then be well positioned to determine the appropriate pace of further policy firming and the extent to which economic developments warranted policy adjustments. They also remarked that the pace of rate increases and the extent of future policy tightening would depend on the incoming data and the evolving outlook for the economy. Many participants noted that the Committee's credibility with regard to bringing inflation back to the 2 percent objective, together with previous communications, had been helpful in shifting market expectations of future policy and had already contributed to a notable tightening of financial conditions that would likely help reduce inflation pressures by restraining aggregate demand. Participants recognized that ongoing policy firming would be appropriate if economic conditions evolved as expected.
At the current juncture, with inflation remaining well above the Committee's objective, participants remarked that moving to a restrictive stance of policy was required to meet the Committee's legislative mandate to promote maximum employment and price stability. In addition, such a stance would be appropriate from a risk management perspective because it would put the Committee in a better position to implement more restrictive policy if inflation came in higher than expected. Many participants judged that a significant risk now facing the Committee was that elevated inflation could become entrenched if the public began to question the resolve of the Committee to adjust the stance of policy as warranted. On this matter, participants stressed that appropriate firming of monetary policy, together with clear and effective communications, would be essential in restoring price stability.
Participants remarked that developments associated with Russia's invasion of Ukraine, the COVID-related lockdowns in China, and other factors restraining supply conditions would affect the inflation outlook and that it would likely take some time for inflation to move down to the Committee's 2 percent objective. Participants also judged that maintaining a strong labor market during the process of bringing inflation down to 2 percent would depend on many factors affecting demand and supply. Participants recognized that policy firming could slow the pace of economic growth for a time, but they saw the return of inflation to 2 percent as critical to achieving maximum employment on a sustained basis.
emphasis added
Black Knight Mortgage Monitor: "Early signs of cooling in the housing market"
by Calculated Risk on 7/06/2022 10:32:00 AM
Today, in the Calculated Risk Real Estate Newsletter: Black Knight Mortgage Monitor: "Early signs of cooling in the housing market"
A brief excerpt:
Note: Black Knights data on affordability goes back to 1975.There is much more in the article. You can subscribe at https://calculatedrisk.substack.com/
And on the payment to income ratio:
• With 30-year rates hovering close to 6% and home prices up nearly 11% since the start of 2022, affordability is at its worst point since the mid-1980s – when sharp Fed hikes led to high double-digit mortgage rates that resulted in a greater than 50% payment-to-income ratio
• The affordability challenge back then was almost entirely driven by the interest rate environment, while incomes largely kept up with home price growth
• As of mid-June 2022, it takes 36.2% of the median household income to make the mortgage payment on the average priced home purchase, well above the 34.1% post-1980s peak in July 2006
• The monthly principal and interest (P&I) payment for the average-priced home purchased with 20% down is now over $2,100 for the first time on record, up nearly $750 (55%) so far this year and nearly 2X the $1,089 required at the beginning of the pandemic

BLS: Job Openings Decreased to 11.3 million in May
by Calculated Risk on 7/06/2022 10:04:00 AM
From the BLS: Job Openings and Labor Turnover Summary
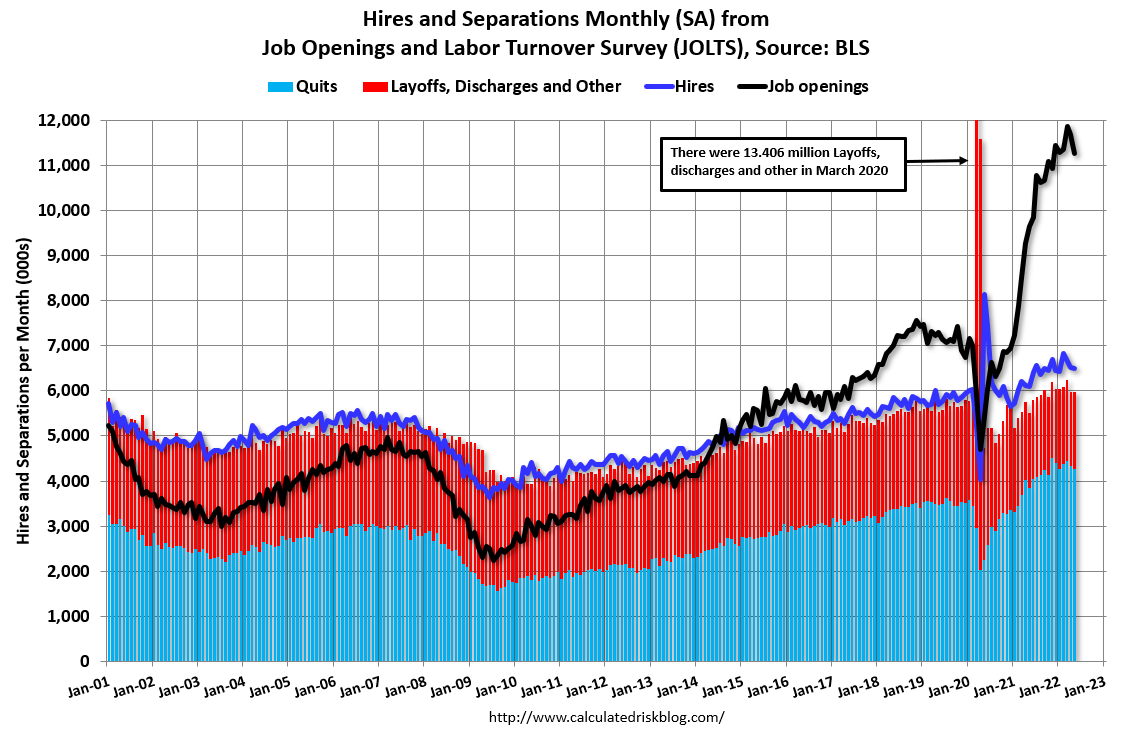
The number of job openings decreased to 11.3 million on the last business day of May, the U.S. Bureau of Labor Statistics reported today. Hires and total separations were little changed at 6.5 million and 6.0 million, respectively. Within separations, quits (4.3 million) and layoffs and discharges (1.4 million) were little changed.The following graph shows job openings (yellow line), hires (dark blue), Layoff, Discharges and other (red column), and Quits (light blue column) from the JOLTS.
emphasis added
This series started in December 2000.
Note: The difference between JOLTS hires and separations is similar to the CES (payroll survey) net jobs headline numbers. This report is for May, the employment report this Friday will be for June.
 Click on graph for larger image.
Note that hires (dark blue) and total separations (red and light blue columns stacked) are usually pretty close each month. This is a measure of labor market turnover. When the blue line is above the two stacked columns, the economy is adding net jobs - when it is below the columns, the economy is losing jobs.
The spike in layoffs and discharges in March 2020 is labeled, but off the chart to better show the usual data.
Jobs openings decreased in May to 11.254 million from 11.681 million in April.
The number of job openings (black) were up 17% year-over-year.
Quits were up 11% year-over-year. These are voluntary separations. (See light blue columns at bottom of graph for trend for "quits").
MBA: Mortgage Applications Decrease in Latest Weekly Survey
by Calculated Risk on 7/06/2022 07:00:00 AM
From the MBA: Mortgage Applications Decrease in Latest MBA Weekly Survey
Mortgage applications decreased 5.4 percent from one week earlier, according to data from the Mortgage Bankers Association’s (MBA) Weekly Mortgage Applications Survey for the week ending July 1, 2022. This week’s results include a holiday adjustment to account for early closings the Friday before Independence Day.
... The Refinance Index decreased 8 percent from the previous week and was 78 percent lower than the same week one year ago. The seasonally adjusted Purchase Index decreased 4 percent from one week earlier. The unadjusted Purchase Index increased 7 percent compared with the previous week and was 17 percent lower than the same week one year ago.
“Mortgage rates decreased for the second week in a row, as growing concerns over an economic slowdown and increased recessionary risks kept Treasury yields lower. Mortgage rates have increased sharply thus far in 2022 but have fallen 24 basis points over the past two weeks, with the 30-year fixed rate at 5.74 percent,” said Joel Kan, MBA’s Associate Vice President of Economic and Industry Forecasting. “Rates are still significantly higher than they were a year ago, which is why applications for home purchases and refinances remain depressed. Purchase activity is hamstrung by ongoing affordability challenges and low inventory, and homeowners still have reduced incentive to apply for a refinance."
...
The average contract interest rate for 30-year fixed-rate mortgages with conforming loan balances ($647,200 or less) decreased to 5.74 percent from 5.84 percent, with points increasing to 0.65 from 0.64 (including the origination fee) for 80 percent loan-to-value ratio (LTV) loans.
emphasis added
 Click on graph for larger image.
The first graph shows the refinance index since 1990.
With higher mortgage rates, the refinance index has declined sharply over the last several months.
The refinance index is at the lowest level since the year 2000.
The second graph shows the MBA mortgage purchase index
 According to the MBA, purchase activity is down 17% year-over-year unadjusted.
Note: Red is a four-week average (blue is weekly).
Tuesday, July 05, 2022
Wednesday: Job Openings, ISM Services, FOMC Minutes
by Calculated Risk on 7/05/2022 09:01:00 PM
Wednesday:
• At 7:00 AM ET, The Mortgage Bankers Association (MBA) will release the results for the mortgage purchase applications index.
• 10:00 AM, Job Openings and Labor Turnover Survey for May from the BLS. Jobs openings decreased in April to 11.400 million from 11.855 million in March.
• Also at 10:00 AM, the ISM Services Index for June. The consensus is for a reading of 54.5, down from 55.9.
• At 2:00 PM, FOMC Minutes, Meeting of June 14-15, 2022
On COVID (focus on hospitalizations and deaths):
| COVID Metrics | ||||
|---|---|---|---|---|
| Now | Week Ago | Goal | ||
| Percent fully Vaccinated | 66.9% | --- | ≥70.0%1 | |
| Fully Vaccinated (millions) | 222.3 | --- | ≥2321 | |
| New Cases per Day3 | 94,345 | 113,184 | ≤5,0002 | |
| Hospitalized3 | 23,459 | 26,162 | ≤3,0002 | |
| Deaths per Day3 | 295 | 340 | ≤502 | |
| 1 Minimum to achieve "herd immunity" (estimated between 70% and 85%). 2my goals to stop daily posts, 37-day average for Cases, Currently Hospitalized, and Deaths 🚩 Increasing 7-day average week-over-week for Cases, Hospitalized, and Deaths ✅ Goal met. | ||||
 Click on graph for larger image.
This graph shows the daily (columns) and 7-day average (line) of deaths reported.
Average daily deaths bottomed in July 2021 at 214 per day.
30-Year Mortgage Rates Decrease to 5.50%
by Calculated Risk on 7/05/2022 03:56:00 PM
Today, in the Calculated Risk Real Estate Newsletter: 30-Year Mortgage Rates Decrease to 5.50%
Excerpt:
After reaching 6.28% on June 14th, 30-year mortgage rates have decreased to 5.50% today according to Mortgagenewsdaily.com. The 10-year Treasury yield has fallen to 2.82%, apparently on “recession fears”, even though it is pretty clear the economy is not in a recession.
... Here is a graph from Mortgagenewsdaily.com that shows the 30-year mortgage rate since 2010. Although mortgage rates have fallen sharply over the last 2 weeks, rates are still much higher than earlier this year.
...
The sharp increase in rates in mid-June was related to a stronger than expected CPI report. Since then, inflation readings have been closer to expectations.

There is much more in the article. You can subscribe at https://calculatedrisk.substack.com/
Heavy Truck Sales Solid in June
by Calculated Risk on 7/05/2022 10:30:00 AM
The BEA released their estimate of vehicle sales for June this morning.
This graph shows heavy truck sales since 1967 using data from the BEA. The dashed line is the June 2022 seasonally adjusted annual sales rate (SAAR).
Heavy truck sales really collapsed during the great recession, falling to a low of 180 thousand SAAR in May 2009. Then heavy truck sales increased to a new all-time high of 570 thousand SAAR in April 2019.
 Click on graph for larger image.
Note: "Heavy trucks - trucks more than 14,000 pounds gross vehicle weight."
Heavy truck sales really declined at the beginning of the pandemic, falling to a low of 308 thousand SAAR in May 2020.
Heavy truck sales were at 475 thousand SAAR in June, down from 491 thousand in May, and down slightly from 476 thousand SAAR in June 2021.
Usually, heavy truck sales decline sharply prior to a recession. Sales were solid in June.
CoreLogic: House Prices up 20.2% YoY in May
by Calculated Risk on 7/05/2022 08:00:00 AM
Notes: This CoreLogic House Price Index report is for May. The recent Case-Shiller index release was for April. The CoreLogic HPI is a three-month weighted average and is not seasonally adjusted (NSA).
From CoreLogic: CoreLogic Data: National Home Price Gains Continue to Exceed 20% in May
CoreLogic® ... today released the CoreLogic Home Price Index (HPI™) and HPI Forecast™ for May 2022.
Though U.S. home price growth relaxed slightly in May from April, it remained in double digits year over year for the 16th consecutive month. As in past months, all states and Washington, D.C. posted annual appreciation, with 13 states posting gains of more than 20%. While rising interest rates cooled overheated demand this spring and are expected to contribute to slowing price growth over the next year, motivated buyers may have less competition and more opportunities moving forward.
“Slowing home price growth reflects the dampening consequence of higher mortgage rates on housing demand, which was the intention,” said Selma Hepp, deputy chief economist at CoreLogic. “With monthly mortgage expenses up about 50% from only a few months ago, fewer buyers are now competing for continually limited inventory. And while annual home price growth still exceeds 20%, we expect to see a rapid deceleration in the rate of growth over the coming year. Nevertheless, the normalization of overheated buying conditions should bring about more of a balance between buyers and sellers and a healthier overall housing market.”
...
U.S. home prices (including distressed sales) increased 20.2% in May 2022, compared to May 2021. On a month-over-month basis, home prices increased by 1.8% compared to April 2022.
...
Annual U.S. home price gains are forecast to slow to 5% by May 2023 as rising mortgage rates and affordability challenges are expected to cool buyer demand.
emphasis added
Monday, July 04, 2022
Tuesday: CoreLogic House Prices
by Calculated Risk on 7/04/2022 11:25:00 PM
Weekend:
• Schedule for Week of July 3, 2022
• House Price Declines: How Long for Real Prices to Recover?
• Housing Inventory July 4th Update: Inventory Almost Double from March Low
• Recession Measures and NBER
Tuesday:
• At 8:00 AM ET, Corelogic House Price index for May.
From CNBC: Pre-Market Data and Bloomberg futures S&P 500 futures are up 24, and DOW futures are up 132 (fair value).
Oil prices were up over the last week with WTI futures at $110.66 per barrel and Brent at $113.50 per barrel. A year ago, WTI was at $73 and Brent was at $78 - so WTI oil prices are up 50% year-over-year.
Here is a graph from Gasbuddy.com for nationwide gasoline prices. Nationally prices are at $4.78 per gallon. A year ago, prices were at $3.11 per gallon, so gasoline prices are up $1.67 per gallon year-over-year.
House Price Declines: How Long for Real Prices to Recover?
by Calculated Risk on 7/04/2022 01:39:00 PM
Today, in the Calculated Risk Real Estate Newsletter: House Price Declines: How Long for Real Prices to Recover?
Excerpt:
Housing economist Tom Lawler sent me some old FHFA research from 2009: A Brief Examination of Previous House Price Declines. ... A conclusion from the research:First, house price downturns have tended to be long. The median time required to return to prior peak prices was 10½ to 20 years. Second, it tends to take longer for prices to rise from the trough to their former peak than it takes prices to decline from peak to trough. While the difference is small for Census Divisions and states, FHFA’s Metropolitan Statistical Area and Division (MSA) indexes suggest that the time from peak to trough tends to be about 3¾ years, whereas the median recovery period (from trough to prior peak) was 6⅔ years.
emphasis added... Here is a similar look at national prices using the real Case-Shiller index (adjusted for inflation).
The real return following the ‘79 peak was 6.5 years. It took 11 years for real prices to reach the previous peak following the peak in ‘89.
And it took 14.5 years to return to the real peak reached during the housing bubble.
This is a little premature, but following a downturn, it typically takes a long time for prices to return to the previous real price peak. Of course, homeowners think in nominal terms, and if prices just “stall”, they usually don’t notice the inflation adjusted price decline.

There is much more in the article. You can subscribe at https://calculatedrisk.substack.com/


