 RSS Feed
 by Calculated Risk on 6/30/2022 09:51:00 AM
Thursday, June 30, 2022
Realtor.com Reports Weekly Inventory Up 25% Year-over-year
Today, in the Calculated Risk Real Estate Newsletter: Realtor.com Reports Weekly Inventory Up 25% Year-over-year
Excerpt:
Realtor.com has monthly and weekly data on the existing home market. Here is their weekly report released this morning from Chief Economist Danielle Hale: Weekly Housing Trends View — Data Week Ending June 25, 2022.. Note: They have data on list prices, new listings and more, but this focus is on inventory.• Active inventory continued to grow, rising 25% above one year ago. With more homeowners deciding to sell just as higher mortgage rates and prices are taking a big bite out of homebuyer purchasing power, the number of homes actively available to shoppers has made a quick about-face. Inventory was roughly even with last year’s levels at the beginning of May and the gains have mounted each week with this most recent week seeing five homes on the market for every four that a buyer at this time last year would have seen. Still, our June Housing Trends Report showed that the active listings count remained less than half its June 2019 level and just shy of two-thirds its June 2020 mark. Put another way, today’s shoppers have more options, but the market needs even more before the selection is on par with the pre-pandemic or even early-pandemic housing market....And here is a monthly graph from Realtor.com released today that shows their estimate of active inventory over the last six years. Note that inventory was declining rapidly for most of 2020, and it is very likely that inventory will be up compared to 2020 in Q3. (June 2022 is for mid-June, and inventory has increased further over the last two weeks).

There is much more in the article. You can subscribe at https://calculatedrisk.substack.com/
Personal Income increased 0.5% in May; Spending increased 0.2%
by Calculated Risk on 6/30/2022 08:42:00 AM
The BEA released the Personal Income and Outlays report for May:
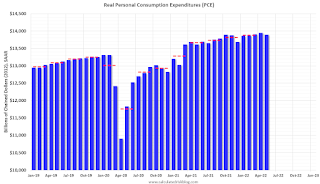
Personal income increased $113.4 billion (0.5 percent) in May, according to the Bureau of Economic Analysis. Disposable personal income (DPI) increased $96.5 billion (0.5 percent) and personal consumption expenditures (PCE) increased $32.7 billion (0.2 percent).The May PCE price index increased 6.3 percent year-over-year (YoY), unchanged from 6.3 percent YoY in April.
Real DPI decreased 0.1 percent in May and Real PCE decreased 0.4 percent; goods decreased 1.6 percent and services increased 0.3 percent. The PCE price index increased 0.6 percent. Excluding food and energy, the PCE price index increased 0.3 percent (
emphasis added
The PCE price index, excluding food and energy, increased 4.7 percent YoY, down from 4.9% in April.
The following graph shows real Personal Consumption Expenditures (PCE) through May 2022 (2012 dollars). Note that the y-axis doesn't start at zero to better show the change.
 Click on graph for larger image.
The dashed red lines are the quarterly levels for real PCE.
Personal income was at expectations, and the increase in PCE was below expectations.
Inflation was at expectations.
Using the two-month method to estimate Q1 PCE growth, PCE was increasing at a 1.6% annual rate in Q2 2022. (Using the mid-month method, PCE was increasing at 0.7%).
Using the two-month method to estimate Q1 PCE growth, PCE was increasing at a 1.6% annual rate in Q2 2022. (Using the mid-month method, PCE was increasing at 0.7%).
Weekly Initial Unemployment Claims at 231,000
by Calculated Risk on 6/30/2022 08:33:00 AM
The DOL reported:
In the week ending June 25, the advance figure for seasonally adjusted initial claims was 231,000, a decrease of 2,000 from the previous week's revised level. The previous week's level was revised up by 4,000 from 229,000 to 233,000. The 4-week moving average was 231,750, an increase of 7,250 from the previous week's revised average. The previous week's average was revised up by 1,000 from 223,500 to 224,500.The following graph shows the 4-week moving average of weekly claims since 1971.
emphasis added
 Click on graph for larger image.
The dashed line on the graph is the current 4-week average. The four-week average of weekly unemployment claims increased to 231,750.
The previous week was revised up.
Weekly claims were higher than the consensus forecast.
Wednesday, June 29, 2022
Thursday: Personal Income & Outlays, Unemployment Claims, Chicago PMI
by Calculated Risk on 6/29/2022 08:31:00 PM
Thursday:
• Early, Census Bureau to Release Vintage 2021 Population Estimates (this might be delayed)
• At 8:30 AM, The initial weekly unemployment claims report will be released. The consensus is for 230 thousand up from 229 thousand last week.
• At 8:30 AM, Personal Income and Outlays, May 2022. The consensus is for a 0.5% increase in personal income, and for a 0.5% increase in personal spending. And for the Core PCE price index to increase 0.4%. PCE prices are expected to be up 6.2% YoY, and core PCE prices up 4.7% YoY.
• At 9:45 AM: Chicago Purchasing Managers Index for June.
On COVID (focus on hospitalizations and deaths):
| COVID Metrics | ||||
|---|---|---|---|---|
| Now | Week Ago | Goal | ||
| Percent fully Vaccinated | 66.9% | --- | ≥70.0%1 | |
| Fully Vaccinated (millions) | 222.1 | --- | ≥2321 | |
| New Cases per Day3🚩 | 108,505 | 99,702 | ≤5,0002 | |
| Hospitalized3🚩 | 26,232 | 25,023 | ≤3,0002 | |
| Deaths per Day3🚩 | 321 | 283 | ≤502 | |
| 1 Minimum to achieve "herd immunity" (estimated between 70% and 85%). 2my goals to stop daily posts, 37-day average for Cases, Currently Hospitalized, and Deaths 🚩 Increasing 7-day average week-over-week for Cases, Hospitalized, and Deaths ✅ Goal met. | ||||
 Click on graph for larger image.
This graph shows the daily (columns) and 7-day average (line) of deaths reported.
Average daily deaths bottomed in July 2021 at 214 per day.
Update: Framing Lumber Prices Down 21% Year-over-year; Still up Sharply from Pre-pandemic Levels
by Calculated Risk on 6/29/2022 01:22:00 PM
Here is another monthly update on framing lumber prices.
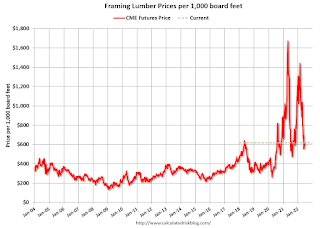
This graph shows CME random length framing futures through June 29th.
Lumber was at $618 per 1000 board feet this morning.
This is down from the peak of $1,733, and down 21% from $779 a year ago.
Prices are still up sharply from the pre-pandemic levels of around $400.
 Click on graph for larger image.
The slowdown in housing - and some supply improvement - has pushed down prices.
Several commodities are showing year-over-year price declines, and this will take some of the pressure off of inflation.
Prices are still up sharply from the pre-pandemic levels of around $400.
 Click on graph for larger image.
There is somewhat of a seasonal demand for lumber, and lumber prices usually peak in April or May (although it seems likely lumber prices peaked earlier this year).
The slowdown in housing - and some supply improvement - has pushed down prices.
Several commodities are showing year-over-year price declines, and this will take some of the pressure off of inflation.
Worst Housing Affordability" since 1991 excluding Bubble; Real House Prices and Price-to-Rent Ratio in April
by Calculated Risk on 6/29/2022 10:00:00 AM
Today, in the Calculated Risk Real Estate Newsletter: Worst Housing Affordability" since 1991 excluding Bubble
Excerpt:
I’ve put together my own affordability index - since 1976 - that is similar to the FirstAm approach (more of a house price index adjusted by mortgage rates and the median household income).
I used median income from the Census Bureau (estimated 2021 and 2022), assumed a 15% down payment, and used a 2% estimate for property taxes, insurance and maintenance. This is probably low for high property tax states like New Jersey and Texas, and too high for lower property tax states. If we were including condos, we’d also include HOA fees too (this is excluded).
For house prices, I used the Case-Shiller National Index, Seasonally Adjusted (SA). Also, for the down payment - there wasn’t a significant difference between 15% and 20%. For mortgage rates, I used the Freddie Mac PMMS (30-year fixed rates).
So here is what the index looks like (lower is more affordable like the FirstAm index):
Note that by this index, during the early ‘80s, homes were very unaffordable due to the very high mortgage rates. During the housing bubble, houses were also less affordable using 30-year mortgage rates, however, during the bubble, there were many “affordability products” that allowed borrowers to be qualified at the teaser rate (usually around 1%) that made houses seem more affordable.
In general, this would suggest houses are the least affordable since the housing bubble. And excluding the bubble - with all the “affordability products” - this is the worst affordability since 1989.
Look down to the second graph below (real house prices) and look what happened after 1989. It took more than a decade to return to 1989 prices in real terms.
Also, in April, the average 30-year mortgage rates were around 5.2%, and currently mortgage rates are close to 6.0% - so we already know the “Affordability Price Index” will increase further over the next couple of months (meaning houses are even less affordable).

There is much more in the article. You can subscribe at https://calculatedrisk.substack.com/
Q1 GDP Growth Revised down to minus 1.6% Annual Rate
by Calculated Risk on 6/29/2022 08:35:00 AM
From the BEA: Gross Domestic Product (Third Estimate), GDP by Industry, and Corporate Profits (Revised), First Quarter 2022
Real gross domestic product (GDP) decreased at an annual rate of 1.6 percent in the first quarter of 2022, according to the "third" estimate released by the Bureau of Economic Analysis. In the fourth quarter of 2021, real GDP increased 6.9 percent.Here is a Comparison of Third and Second Estimates. PCE growth was revised down from 3.1% to 1.8%. Residential investment was unrevised at 0.4%.
The "third" estimate of GDP released today is based on more complete source data than were available for the "second" estimate issued last month. In the second estimate, the decrease in real GDP was 1.5 percent. The update primarily reflects a downward revision to personal consumption expenditures (PCE) that was partly offset by an upward revision to private inventory investment
emphasis added
MBA: Mortgage Applications Increase in Latest Weekly Survey
by Calculated Risk on 6/29/2022 07:00:00 AM
From the MBA: Mortgage Applications Increase in Latest MBA Weekly Survey
Mortgage applications increased 0.7 percent from one week earlier, according to data from the Mortgage Bankers Association’s (MBA) Weekly Mortgage Applications Survey for the week ending June 24, 2022. This week’s results include an adjustment for the observance of the Juneteenth holiday.
... The Refinance Index increased 2 percent from the previous week and was 80 percent lower than the same week one year ago. The seasonally adjusted Purchase Index increased 0.1 percent from one week earlier. The unadjusted Purchase Index decreased 21 percent compared with the previous week and was 24 percent lower than the same week one year ago.
“Mortgage rates continue to experience large swings. After increasing 65 basis points during the past three weeks, the 30-year fixed rate declined 14 basis points last week to 5.84 percent. Rates are still significantly higher than they were a year ago, when the 30-year fixed rate was at 3.2 percent,” said Joel Kan, MBA’s Associate Vice President of Economic and Industry Forecasting. “The decline in mortgage rates led to a slight increase in refinancing, driven by an uptick in conventional loans. However, refinances are still 80 percent lower than a year ago and more than 60 percent below the historical average.”
Added Kan, “Overall purchase activity has weakened in recent months due to the quick jump in mortgage rates, high home prices, and growing economic uncertainty. Purchase applications were essentially flat last week but were supported by a 6 percent increase in government loans. The average purchase loan amount declined to $413,500, which is an ongoing downward trend since it hit a record $460,000 in March 2022.”
...
The average contract interest rate for 30-year fixed-rate mortgages with conforming loan balances ($647,200 or less) decreased to 5.84 percent from 5.98 percent, with points decreasing to 0.64 from 0.77 (including the origination fee) for 80 percent loan-to-value ratio (LTV) loans.
emphasis added
 Click on graph for larger image.
The first graph shows the refinance index since 1990.
With higher mortgage rates, the refinance index has declined sharply over the last several months.
The refinance index is just above the lowest level since the year 2000.
The second graph shows the MBA mortgage purchase index
 According to the MBA, purchase activity is down 24% year-over-year unadjusted.
Note: Red is a four-week average (blue is weekly).
Tuesday, June 28, 2022
Wednesday: GDP
by Calculated Risk on 6/28/2022 08:41:00 PM
 Wednesday:
• At 7:00 AM ET, The Mortgage Bankers Association (MBA) will release the results for the mortgage purchase applications index.
• 8:30 AM, Gross Domestic Product, 1st quarter 2022 (Third estimate). The consensus is that real GDP decreased 1.5% annualized in Q1, unchanged from the second estimate of a 1.5% decrease.
On COVID (focus on hospitalizations and deaths):
| COVID Metrics | ||||
|---|---|---|---|---|
| Now | Week Ago | Goal | ||
| Percent fully Vaccinated | 66.9% | --- | ≥70.0%1 | |
| Fully Vaccinated (millions) | 222.1 | --- | ≥2321 | |
| New Cases per Day3🚩 | 110,353 | 92,772 | ≤5,0002 | |
| Hospitalized3🚩 | 25,549 | 24,923 | ≤3,0002 | |
| Deaths per Day3🚩 | 307 | 267 | ≤502 | |
| 1 Minimum to achieve "herd immunity" (estimated between 70% and 85%). 2my goals to stop daily posts, 37-day average for Cases, Currently Hospitalized, and Deaths 🚩 Increasing 7-day average week-over-week for Cases, Hospitalized, and Deaths ✅ Goal met. | ||||
 Click on graph for larger image.
This graph shows the daily (columns) and 7-day average (line) of deaths reported.
Average daily deaths bottomed in July 2021 at 214 per day.
Predicting the Next Recession
by Calculated Risk on 6/28/2022 01:53:00 PM
The recession callers are back, and some like ARK's Cathie Wood and Home Depot's Ken Langone claim the US is already in a recession. I disagree. We did see negative real GDP growth in Q1, and we might see negative real GDP growth in Q2 - but this doesn't mean the US economy is in a recession.
PCE growth was solid in Q1 at a 3.1% annualized real rate and was also solid in April (May personal spending will be released Friday). There were over 1.6 million jobs added in Q1 (not a recession), and over 800 thousand jobs added in the first two months of Q2 (not a recession).
For a discussion of recessions, see NBER's What is a recession?
Way back in 2013, I wrote a post "Predicting the Next Recession. This post was in response to several recession forecasts (that were incorrect).
In that 2013 post, I wrote:
The next recession will probably be caused by one of the following (from least likely to most likely):Unfortunately, in 2020, one of those low probability events happened (pandemic), and that led to a recession in 2020.
3) An exogenous event such as a pandemic, significant military conflict, disruption of energy supplies for any reason, a major natural disaster (meteor strike, super volcano, etc), and a number of other low probability reasons. All of these events are possible, but they are unpredictable, and the probabilities are low that they will happen in the next few years or even decades.
emphasis added
2) Significant policy error. Two examples: not reaching a fiscal agreement and going off the "fiscal cliff" probably would have led to a recession, and Congress refusing to "pay the bills" would have been a policy error that would have taken the economy into recession.We've seen several policy errors, mostly related to immigration and trade during the previous administration, but none that would lead the economy into a recession.
1) Most of the post-WWII recessions were caused by the Fed tightening monetary policy to slow inflation. I think this is the most likely cause of the next recession. Usually, when inflation starts to become a concern, the Fed tries to engineer a "soft landing", and frequently the result is a recession.And this most common cause of a recession is the current concern. Since inflation picked up, mostly due to the pandemic (stimulus spending, supply constraints) and due to the invasion of Ukraine, the Fed has embarked on a tightening cycle to slow inflation.
The Fed cannot ease pandemic related supply constraints (except by curbing demand), and the Fed cannot stop the war. So, there is a possibility that the Fed will tighten too much and that will lead to a "hard landing" (aka recession).
The key will be to watch housing. Housing is the main transmission mechanism for Fed policy. We have already seen mortgage rates rise enough to sharply slow mortgage equity withdrawal and to slow housing activity.
For the economy, what I focus on is single family starts and new home sales. For the bottoms and tops for key housing activity, here is a graph of Single-family housing starts, New Home Sales, and Residential Investment (RI) as a percent of GDP.
Note: The pandemic has distorted the economic data, and as I've noted many times, we can't be a slave to any model.
 Click on graph for larger image.
The arrows point to some of the earlier peaks and troughs for these three measures.
The purpose of this graph is to show that these three indicators generally reach peaks and troughs together. Note that Residential Investment is quarterly and single-family starts and new home sales are monthly.
New home sales and single-family starts turned down, but this was partly due to the huge surge in sales during the pandemic. Residential investment might be peaking.
 The second graph shows the YoY change in New Home Sales from the Census Bureau. Currently new home sales (based on 3-month average) are down 10% year-over-year.
Note: the New Home Sales data is smoothed using a three month centered average before calculating the YoY change. The Census Bureau data starts in 1963.
Some observations:
1) When the YoY change in New Home Sales falls about 20%, usually a recession will follow. An exception for this data series was the mid '60s when the Vietnam buildup kept the economy out of recession. Another exception was the recent situation - we saw a YoY decline in new home sales related to the pandemic and the surge in new home sales in the second half of 2020. Ignore this pandemic distortion!
Also note that the sharp decline in 2010 was related to the housing tax credit policy in 2009 - and was just a continuation of the housing bust.
2) It is also interesting to look at the '86/'87 and the mid '90s periods. New Home sales fell in both of these periods, although not quite 20%. As I noted in earlier posts, the mid '80s saw a surge in defense spending and MEW that more than offset the decline in New Home sales. In the mid '90s, nonresidential investment remained strong.
If the Fed tightening cycle will lead to a recession, we should see housing turn down first (new home sales, single family starts, residential investment). This might be happening, but this usually leads the economy by a year or more. So, we might be looking at a recession in 2023.
There are other indicators too - such as the yield curve and heavy truck sales - but mostly I'll be watching housing. I'm not currently on recession watch.


