 RSS Feed
 by Calculated Risk on 6/21/2022 09:08:00 PM
Tuesday, June 21, 2022
Wednesday: Fed Chair Powell Testimony
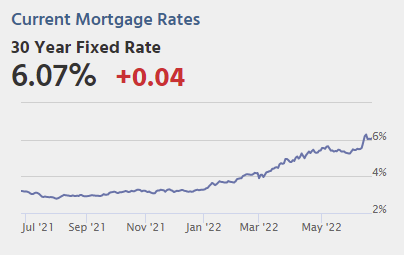 From Matthew Graham at Mortgage News Daily: Mortgage Rates Slightly Higher to Start The Week
Mortgage rates surged well into the 6% range last week before quickly cooling down after Wednesday's Fed announcement. The average top tier rate was nearly back below 6% by Friday. [30 year fixed 6.07%]Wednesday:
emphasis added
• At 7:00 AM ET, The Mortgage Bankers Association (MBA) will release the results for the mortgage purchase applications index.
• At 9:30 AM, Testimony, Fed Chair Jerome Powell, Semiannual Monetary Policy Report to Congress, Before the Committee on Banking, Housing, and Urban Affairs, U.S. Senate
During the day, The AIA's Architecture Billings Index for May (a leading indicator for commercial real estate).
On COVID (focus on hospitalizations and deaths):
| COVID Metrics | ||||
|---|---|---|---|---|
| Now | Week Ago | Goal | ||
| Percent fully Vaccinated | 66.8% | --- | ≥70.0%1 | |
| Fully Vaccinated (millions) | 221.9 | --- | ≥2321 | |
| New Cases per Day3 | 89,102 | 106,368 | ≤5,0002 | |
| Hospitalized3 | 23,992 | 24,066 | ≤3,0002 | |
| Deaths per Day3 | 239 | 307 | ≤502 | |
| 1 Minimum to achieve "herd immunity" (estimated between 70% and 85%). 2my goals to stop daily posts, 37-day average for Cases, Currently Hospitalized, and Deaths 🚩 Increasing 7-day average week-over-week for Cases, Hospitalized, and Deaths ✅ Goal met. | ||||
 Click on graph for larger image.
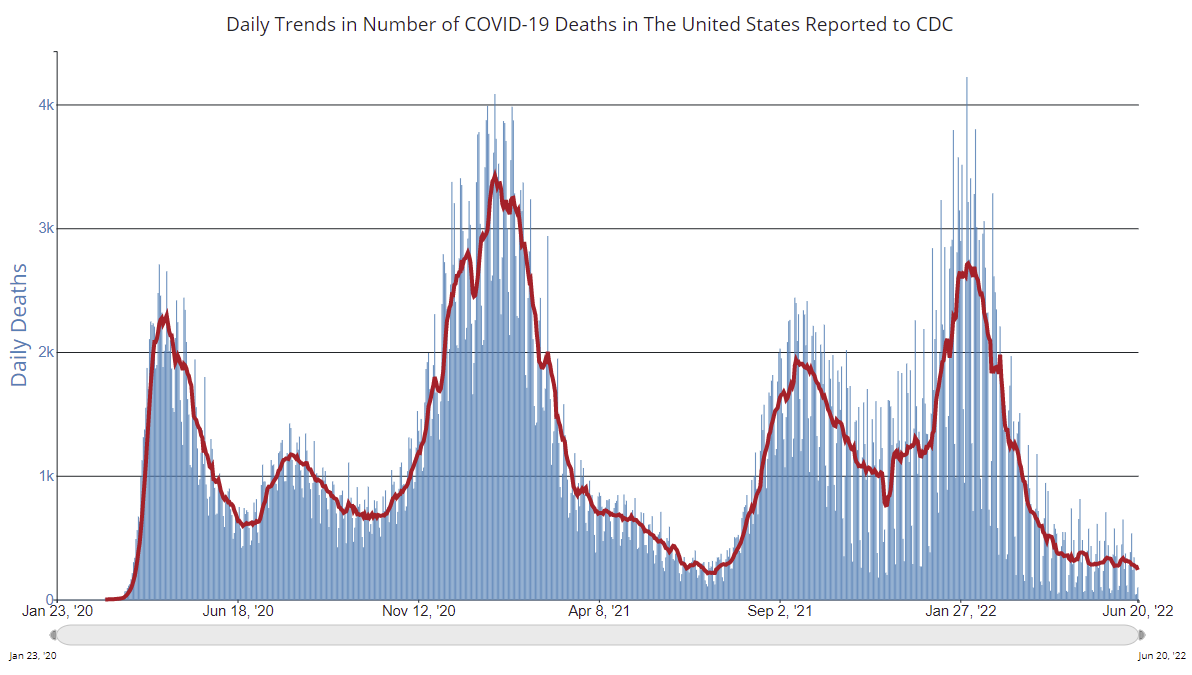
This graph shows the daily (columns) and 7-day average (line) of deaths reported.
Average daily deaths bottomed in July 2021 at 214 per day.
MBA Survey: "Share of Mortgage Loans in Forbearance Decreases to 0.85% in May"
by Calculated Risk on 6/21/2022 04:00:00 PM
Note: This is as of May 31st.
From the MBA: Share of Mortgage Loans in Forbearance Decreases to 0.85% in May
The Mortgage Bankers Association’s (MBA) monthly Loan Monitoring Survey revealed that the total number of loans now in forbearance decreased by 9 basis points from 0.94% of servicers’ portfolio volume in the prior month to 0.85% as of May 31, 2022. According to MBA’s estimate, 425,000 homeowners are in forbearance plans.
The share of Fannie Mae and Freddie Mac loans in forbearance decreased 5 basis points to 0.38%. Ginnie Mae loans in forbearance decreased 4 basis points to 1.25%, and the forbearance share for portfolio loans and private-label securities (PLS) declined 29 basis points to 1.86%.
“Servicers are whittling away at the remaining loans in forbearance, even as the pace of monthly forbearance exits slowed in May to a new survey low. Most borrowers exiting forbearance are moving into either a loan modification, payment deferral, or a combination of the two workout options,” said Marina Walsh, CMB, MBA’s Vice President of Industry Analysis.
Added Walsh, “It is a positive sign to see the overall servicing portfolio performance reach 95.85 percent current in May – 21 basis points higher than April’s figures. However, it is worth watching if the rapid increase in interest rates for all loans, combined with inflation that is outpacing wage growth, complicates post-forbearance workout options and puts additional pressure on borrowers in existing post-forbearance workouts.”
emphasis added
 Click on graph for larger image.
This graph shows the percent of portfolio in forbearance by investor type over time.
The share of forbearance plans is decreasing, and, at the end of May, there were about 425,000 homeowners in forbearance plans.
More Analysis on May Existing Home Sales
by Calculated Risk on 6/21/2022 10:55:00 AM
Today, in the CalculatedRisk Real Estate Newsletter: NAR: Existing-Home Sales Decreased to 5.41 million SAAR in May
Excerpt:
Sales in May (5.41 million SAAR) were down 3.4% from the previous month and were 8.6% below the May 2021 sales rate. Sales in April were revised down.There is much more in the article. You can subscribe at https://calculatedrisk.substack.com/ (Most content is available for free, so please subscribe).
The second graph shows existing home sales by month for 2021 and 2022.
Sales declined 8.6% year-over-year compared to April 2021. This was the ninth consecutive month with sales down year-over-year.
...
Key point on Timing of Sales
Existing home sales are reported when the transaction closes. So, sales in May are mostly for contracts signed in March and April when mortgage rates were significantly lower than today (and many buyers locked in the mortgage rate as soon as possible).
30-year mortgage rates in March were around 4.2% according to Freddie Mac. And rates increased to around 5% in April. Now rates are slightly over 6%.
My sense is contracts for sales really declined in June, and that will show up as closed sales in July and August.

NAR: Existing-Home Sales Decreased to 5.41 million SAAR in May
by Calculated Risk on 6/21/2022 10:11:00 AM
From the NAR: Existing-Home Sales Fell 3.4% in May; Median Sales Price Surpasses $400,000 for the First Time
Existing-home sales retreated for the fourth consecutive month in May, according to the National Association of Realtors®. Month-over-month sales declined in three out of four major U.S. regions, while year-over-year sales slipped in all four regions.
Total existing-home sales, completed transactions that include single-family homes, townhomes, condominiums and co-ops, fell 3.4% from April to a seasonally adjusted annual rate of 5.41 million in May. Year-over-year, sales receded 8.6% (5.92 million in May 2021).
...
Total housing inventory registered at the end of May was 1,160,000 units, an increase of 12.6% from April and a 4.1% decline from the previous year (1.21 million). Unsold inventory sits at a 2.6-month supply at the current sales pace, up from 2.2 months in April and 2.5 months in May 2021.
emphasis added
 Click on graph for larger image.
This graph shows existing home sales, on a Seasonally Adjusted Annual Rate (SAAR) basis since 1993.
Sales in May (5.41 million SAAR) were down 3.4% from the previous month and were 8.6% below the May 2021 sales rate. Sales in April were revised down.
The second graph shows nationwide inventory for existing homes.
 According to the NAR, inventory increased to 1.16 million in May from 1.03 million in April.
Headline inventory is not seasonally adjusted, and inventory usually decreases to the seasonal lows in December and January, and peaks in mid-to-late summer.
The last graph shows the year-over-year (YoY) change in reported existing home inventory and months-of-supply. Since inventory is not seasonally adjusted, it really helps to look at the YoY change. Note: Months-of-supply is based on the seasonally adjusted sales and not seasonally adjusted inventory.
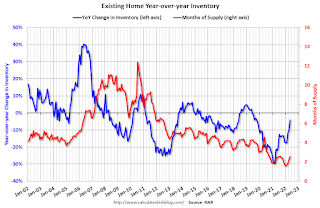 Inventory was down 4.1% year-over-year (blue) in May compared to May 2021.
Months of supply (red) increased to 2.6 months in May from 2.2 months in April.
This was close to the consensus forecast. I'll have more later.
The last graph shows the year-over-year (YoY) change in reported existing home inventory and months-of-supply. Since inventory is not seasonally adjusted, it really helps to look at the YoY change. Note: Months-of-supply is based on the seasonally adjusted sales and not seasonally adjusted inventory.
 Inventory was down 4.1% year-over-year (blue) in May compared to May 2021.
 Months of supply (red) increased to 2.6 months in May from 2.2 months in April.
This was close to the consensus forecast. I'll have more later.
DOT: Vehicle Miles Driven Increased Slightly year-over-year in April
by Calculated Risk on 6/21/2022 08:30:00 AM
This will be something to watch with higher gasoline prices.
The Department of Transportation (DOT) reported:
Travel on all roads and streets changed by +1.5% (+3.9 billion vehicle miles) for April 2022 as compared with April 2021. Travel for the month is estimated to be 263.1 billion vehicle miles.
The seasonally adjusted vehicle miles traveled for April 2022 is 270.7 billion miles, a 2.50% ( 6.6 billion vehicle miles) change over April 2021. It also represents a -0.9% change (-2.4 billion vehicle miles) compared with March 2022.
Cumulative Travel for 2022 changed by +4.5% (+44.0 billion vehicle miles). The cumulative estimate for the year is 1,016.7 billion vehicle miles of travel.
emphasis added
 Click on graph for larger image.
This graph shows the monthly total vehicle miles driven, seasonally adjusted.
Miles driven declined sharply in March 2020, and really collapsed in April 2020. After recovering, miles driven might be starting to soften due to high gasoline prices.
Monday, June 20, 2022
Tuesday: Existing Home Sales
by Calculated Risk on 6/20/2022 08:20:00 PM
Tuesday:
• At 8:30 AM ET, Chicago Fed National Activity Index for May. This is a composite index of other data.
• At 10:00 AM, Existing Home Sales for May from the National Association of Realtors (NAR). The consensus is for 5.41 million SAAR, down from 5.61 million. Housing economist Tom Lawler expects the NAR to report sales of 5.35 million SAAR for May.
Existing Home Sales: Lawler vs. the Consensus
by Calculated Risk on 6/20/2022 03:03:00 PM
Housing economist Tom Lawler has been sending me his predictions of what the NAR will report for 12 years. And he has graciously allowed me to share his predictions with the readers of this blog.
The table below shows the consensus for each month, Lawler's predictions, and the NAR's initially reported level of sales. Lawler hasn't always been closer than the consensus, but usually when there has been a fairly large spread between Lawler's estimate and the "consensus", Lawler has been closer.
The NAR is scheduled to release Existing Home Sales for May, tomorrow at 10:00 AM, Tuesday, June 21st.
The consensus is for 5.41 million SAAR in May. Tom Lawler estimates the NAR will report sales of 5.35 million SAAR.
Over the last 12 years, the consensus average miss was 147 thousand, and Lawler's average miss was 72 thousand.
The consensus is for 5.41 million SAAR in May. Tom Lawler estimates the NAR will report sales of 5.35 million SAAR.
Over the last 12 years, the consensus average miss was 147 thousand, and Lawler's average miss was 72 thousand.
| Existing Home Sales, Forecasts and NAR Report millions, seasonally adjusted annual rate basis (SAAR) | |||
|---|---|---|---|
| Month | Consensus | Lawler | NAR reported1 |
| May-10 | 6.20 | 5.83 | 5.66 |
| Jun-10 | 5.30 | 5.30 | 5.37 |
| Jul-10 | 4.66 | 3.95 | 3.83 |
| Aug-10 | 4.10 | 4.10 | 4.13 |
| Sep-10 | 4.30 | 4.50 | 4.53 |
| Oct-10 | 4.50 | 4.46 | 4.43 |
| Nov-10 | 4.85 | 4.61 | 4.68 |
| Dec-10 | 4.90 | 5.13 | 5.28 |
| Jan-11 | 5.20 | 5.17 | 5.36 |
| Feb-11 | 5.15 | 5.00 | 4.88 |
| Mar-11 | 5.00 | 5.08 | 5.10 |
| Apr-11 | 5.20 | 5.15 | 5.05 |
| May-11 | 4.75 | 4.80 | 4.81 |
| Jun-11 | 4.90 | 4.71 | 4.77 |
| Jul-11 | 4.92 | 4.69 | 4.67 |
| Aug-11 | 4.75 | 4.92 | 5.03 |
| Sep-11 | 4.93 | 4.83 | 4.91 |
| Oct-11 | 4.80 | 4.86 | 4.97 |
| Nov-11 | 5.08 | 4.40 | 4.42 |
| Dec-11 | 4.60 | 4.64 | 4.61 |
| Jan-12 | 4.69 | 4.66 | 4.57 |
| Feb-12 | 4.61 | 4.63 | 4.59 |
| Mar-12 | 4.62 | 4.59 | 4.48 |
| Apr-12 | 4.66 | 4.53 | 4.62 |
| May-12 | 4.57 | 4.66 | 4.55 |
| Jun-12 | 4.65 | 4.56 | 4.37 |
| Jul-12 | 4.50 | 4.47 | 4.47 |
| Aug-12 | 4.55 | 4.87 | 4.82 |
| Sep-12 | 4.75 | 4.70 | 4.75 |
| Oct-12 | 4.74 | 4.84 | 4.79 |
| Nov-12 | 4.90 | 5.10 | 5.04 |
| Dec-12 | 5.10 | 4.97 | 4.94 |
| Jan-13 | 4.90 | 4.94 | 4.92 |
| Feb-13 | 5.01 | 4.87 | 4.98 |
| Mar-13 | 5.03 | 4.89 | 4.92 |
| Apr-13 | 4.92 | 5.03 | 4.97 |
| May-13 | 5.00 | 5.20 | 5.18 |
| Jun-13 | 5.27 | 4.99 | 5.08 |
| Jul-13 | 5.13 | 5.33 | 5.39 |
| Aug-13 | 5.25 | 5.35 | 5.48 |
| Sep-13 | 5.30 | 5.26 | 5.29 |
| Oct-13 | 5.13 | 5.08 | 5.12 |
| Nov-13 | 5.02 | 4.98 | 4.90 |
| Dec-13 | 4.90 | 4.96 | 4.87 |
| Jan-14 | 4.70 | 4.67 | 4.62 |
| Feb-14 | 4.64 | 4.60 | 4.60 |
| Mar-14 | 4.56 | 4.64 | 4.59 |
| Apr-14 | 4.67 | 4.70 | 4.65 |
| May-14 | 4.75 | 4.81 | 4.89 |
| Jun-14 | 4.99 | 4.96 | 5.04 |
| Jul-14 | 5.00 | 5.09 | 5.15 |
| Aug-14 | 5.18 | 5.12 | 5.05 |
| Sep-14 | 5.09 | 5.14 | 5.17 |
| Oct-14 | 5.15 | 5.28 | 5.26 |
| Nov-14 | 5.20 | 4.90 | 4.93 |
| Dec-14 | 5.05 | 5.15 | 5.04 |
| Jan-15 | 5.00 | 4.90 | 4.82 |
| Feb-15 | 4.94 | 4.87 | 4.88 |
| Mar-15 | 5.04 | 5.18 | 5.19 |
| Apr-15 | 5.22 | 5.20 | 5.04 |
| May-15 | 5.25 | 5.29 | 5.35 |
| Jun-15 | 5.40 | 5.45 | 5.49 |
| Jul-15 | 5.41 | 5.64 | 5.59 |
| Aug-15 | 5.50 | 5.54 | 5.31 |
| Sep-15 | 5.35 | 5.56 | 5.55 |
| Oct-15 | 5.41 | 5.33 | 5.36 |
| Nov-15 | 5.32 | 4.97 | 4.76 |
| Dec-15 | 5.19 | 5.36 | 5.46 |
| Jan-16 | 5.32 | 5.36 | 5.47 |
| Feb-16 | 5.30 | 5.20 | 5.08 |
| Mar-16 | 5.27 | 5.27 | 5.33 |
| Apr-16 | 5.40 | 5.44 | 5.45 |
| May-16 | 5.64 | 5.55 | 5.53 |
| Jun-16 | 5.48 | 5.62 | 5.57 |
| Jul-16 | 5.52 | 5.41 | 5.39 |
| Aug-16 | 5.44 | 5.49 | 5.33 |
| Sep-16 | 5.35 | 5.55 | 5.47 |
| Oct-16 | 5.44 | 5.47 | 5.60 |
| Nov-16 | 5.54 | 5.60 | 5.61 |
| Dec-16 | 5.54 | 5.55 | 5.49 |
| Jan-17 | 5.55 | 5.60 | 5.69 |
| Feb-17 | 5.55 | 5.41 | 5.48 |
| Mar-17 | 5.61 | 5.74 | 5.71 |
| Apr-17 | 5.67 | 5.56 | 5.57 |
| May-17 | 5.55 | 5.65 | 5.62 |
| Jun-17 | 5.58 | 5.59 | 5.52 |
| Jul-17 | 5.57 | 5.38 | 5.44 |
| Aug-17 | 5.48 | 5.39 | 5.35 |
| Sep-17 | 5.30 | 5.38 | 5.39 |
| Oct-17 | 5.30 | 5.60 | 5.48 |
| Nov-17 | 5.52 | 5.77 | 5.81 |
| Dec-17 | 5.75 | 5.66 | 5.57 |
| Jan-18 | 5.65 | 5.48 | 5.38 |
| Feb-18 | 5.42 | 5.44 | 5.54 |
| Mar-18 | 5.28 | 5.51 | 5.60 |
| Apr-18 | 5.60 | 5.48 | 5.46 |
| May-18 | 5.56 | 5.47 | 5.43 |
| Jun-18 | 5.45 | 5.35 | 5.38 |
| Jul-18 | 5.43 | 5.40 | 5.34 |
| Aug-18 | 5.36 | 5.36 | 5.34 |
| Sep-18 | 5.30 | 5.20 | 5.15 |
| Oct-18 | 5.20 | 5.31 | 5.22 |
| Nov-18 | 5.19 | 5.23 | 5.32 |
| Dec-18 | 5.24 | 4.97 | 4.99 |
| Jan-19 | 5.05 | 4.92 | 4.94 |
| Feb-19 | 5.08 | 5.46 | 5.51 |
| Mar-19 | 5.30 | 5.40 | 5.21 |
| Apr-19 | 5.36 | 5.31 | 5.19 |
| May-19 | 5.29 | 5.40 | 5.34 |
| Jun-19 | 5.34 | 5.25 | 5.27 |
| Jul-19 | 5.39 | 5.40 | 5.42 |
| Aug-19 | 5.38 | 5.42 | 5.49 |
| Sep-19 | 5.45 | 5.36 | 5.38 |
| Oct-19 | 5.49 | 5.36 | 5.46 |
| Nov-19 | 5.45 | 5.43 | 5.35 |
| Dec-19 | 5.43 | 5.40 | 5.54 |
| Jan-20 | 5.45 | 5.42 | 5.46 |
| Feb-20 | 5.50 | 5.58 | 5.77 |
| Mar-20 | 5.30 | 5.25 | 5.27 |
| Apr-20 | 4.30 | 4.17 | 4.33 |
| May-20 | 4.38 | 3.80 | 3.91 |
| Jun-20 | 4.86 | 4.65 | 4.72 |
| Jul-20 | 5.39 | 5.85 | 5.86 |
| Aug-20 | 6.00 | 5.92 | 6.00 |
| Sep-20 | 6.25 | 6.38 | 6.54 |
| Oct-20 | 6.45 | 6.63 | 6.85 |
| Nov-20 | 6.70 | 6.50 | 6.69 |
| Dec-20 | 6.55 | 6.62 | 6.76 |
| Jan-21 | 6.60 | 6.48 | 6.69 |
| Feb-21 | 6.51 | 6.29 | 6.22 |
| Mar-21 | 6.17 | 6.02 | 6.01 |
| Apr-21 | 6.09 | 5.96 | 5.85 |
| May-21 | 5.74 | 5.78 | 5.80 |
| Jun-21 | 5.90 | 5.79 | 5.86 |
| Jul-21 | 5.84 | 5.86 | 5.99 |
| Aug-21 | 5.88 | 5.90 | 5.88 |
| Sep-21 | 6.06 | 6.20 | 6.29 |
| Oct-21 | 6.20 | 6.34 | 6.34 |
| Nov-21 | 6.20 | 6.45 | 6.46 |
| Dec-21 | 6.45 | 6.33 | 6.18 |
| Jan-22 | 6.12 | 6.36 | 6.50 |
| Feb-22 | 6.16 | 5.97 | 6.02 |
| Mar-22 | 5.80 | 5.74 | 5.77 |
| Apr-22 | 5.62 | 5.57 | 5.61 |
| May-22 | 5.41 | 5.35 | NA |
| 1NAR initially reported before revisions. | |||
Housing Completions will Increase Sharply in 2022
by Calculated Risk on 6/20/2022 10:51:00 AM
Today, in the Calculated Risk Real Estate Newsletter: Housing Completions will Increase Sharply in 2022
A brief excerpt:
Even as housing starts slow, there will be a sharp increase in new supply in 2022 including both single family homes and apartments.There is much more in the article. You can subscribe at https://calculatedrisk.substack.com/
This graph shows total housing completions and placements since 1968 with an estimate for 2022. Note that the net additional to the housing stock is less because of demolitions and destruction of older housing units.
My current estimate is total completions (single family, multi-family, manufactured homes) will increase about 17% in 2022 to almost 1.7 million. If correct, this would be the most completions since 2006.
...

Housing Inventory June 20th Update: Inventory up 18.5% Year-over-year
by Calculated Risk on 6/20/2022 09:42:00 AM
Altos reports inventory is up 18.5% year-over-year.
Inventory usually declines in the winter, and then increases in the spring. Inventory bottomed seasonally at the beginning of March 2022 and is now up 74% since then.
 Click on graph for larger image in graph gallery.
This inventory graph is courtesy of Altos Research.
As of June 17th, inventory was at 419 thousand (7-day average), compared to 396 thousand the prior week. Inventory was up 5.6% from the previous week. Inventory is increasing much faster than normal for this time of year (both in percentage terms and in total inventory added).
Note: Next week, inventory will likely exceed the peak in 2021.
Inventory is still historically low. Compared to the same week in 2021, inventory is up 18.5% from 353 thousand, however compared to the same week in 2020 inventory is down 39.3% from 690 thousand. Compared to 3 years ago, inventory is down 56.5% from 963 thousand.
Inventory is still historically low. Compared to the same week in 2021, inventory is up 18.5% from 353 thousand, however compared to the same week in 2020 inventory is down 39.3% from 690 thousand. Compared to 3 years ago, inventory is down 56.5% from 963 thousand.
Here are the inventory milestones I’m watching for with the Altos data:
1. The seasonal bottom (happened on March 4th for Altos) ✅
2. Inventory up year-over-year (happened on May 13th for Altos) ✅
3. Inventory up compared to two years ago (currently down 39.3% according to Altos)
4. Inventory up compared to 2019 (currently down 56.5%).

1. The seasonal bottom (happened on March 4th for Altos) ✅
2. Inventory up year-over-year (happened on May 13th for Altos) ✅
3. Inventory up compared to two years ago (currently down 39.3% according to Altos)
4. Inventory up compared to 2019 (currently down 56.5%).

Here is a graph of the inventory change vs 2021, 2020 (milestone 3 above) and 2019 (milestone 4).
The blue line is the year-over-year data, the red line is compared to two years ago, and dashed purple is compared to 2019.
Two years ago (in 2020) inventory was declining all year, so the two-year comparison will get easier all year.
My current guess is inventory will be up in Q4 compared to the same week in 2020.
Mike Simonsen discusses this data regularly on Youtube.
Five High Frequency Indicators for the Economy
by Calculated Risk on 6/20/2022 08:06:00 AM
These indicators are mostly for travel and entertainment. It is interesting to watch these sectors recover as the pandemic subsides. Notes: I've added back gasoline supplied to see if there is an impact from higher gasoline prices. Apple has discontinued "Apple mobility", and restaurant traffic is mostly back to normal.
The TSA is providing daily travel numbers.
This data is as of June 19th.
 Click on graph for larger image.
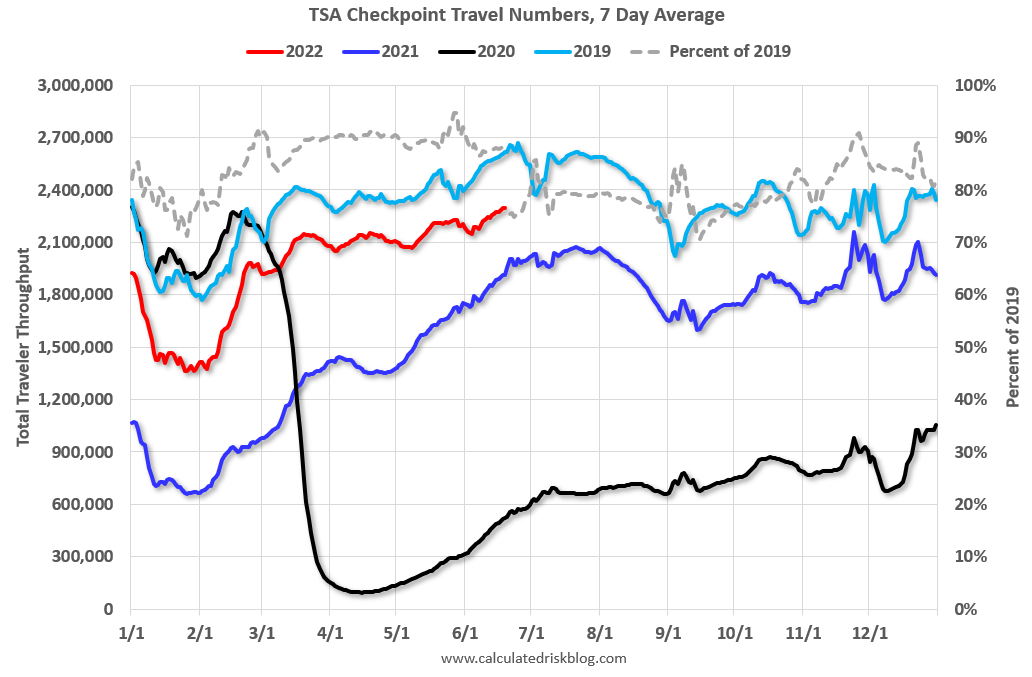
This data shows the 7-day average of daily total traveler throughput from the TSA for 2019 (Light Blue), 2020 (Black), 2021 (Blue) and 2022 (Red).
The dashed line is the percent of 2019 for the seven-day average.
The 7-day average is down 12.1% from the same day in 2019 (87.9% of 2019). (Dashed line)
Air travel has been moving sideways over the last several months, off about 10% from 2019.
 This data shows domestic box office for each week and the median for the years 2016 through 2019 (dashed light blue).
 Black is 2020, Blue is 2021 and Red is 2022.
The data is from BoxOfficeMojo through June 16th.
Note that the data is usually noisy week-to-week and depends on when blockbusters are released.
Movie ticket sales were at $297 million last week, up about 47% from the median for the week due to Jurassic Park.
Note that the data is usually noisy week-to-week and depends on when blockbusters are released.
Movie ticket sales were at $297 million last week, up about 47% from the median for the week due to Jurassic Park.
 This graph shows the seasonal pattern for the hotel occupancy rate using the four-week average.
 The red line is for 2022, black is 2020, blue is the median, and dashed light blue is for 2021. Dashed purple is 2019 (STR is comparing to a strong year for hotels).
This data is through June 11th. The occupancy rate was down 4.1% compared to the same week in 2019.
The 4-week average of the occupancy rate is slightly above the median rate for the previous 20 years (Blue).
Notes: Y-axis doesn't start at zero to better show the seasonal change.
Notes: Y-axis doesn't start at zero to better show the seasonal change.
 This graph, based on weekly data from the U.S. Energy Information Administration (EIA), shows gasoline supplied compared to the same week of 2019.
Blue is for 2020. Purple is for 2021, and Red is for 2022.
As of June 10th, gasoline supplied was down 7.9% compared to the same week in 2019.
Recently gasoline supplied has been running somewhat below 2019 levels.
Here is some interesting data on New York subway usage (HT BR).
 This graph is from Todd W Schneider.
 This graph shows how much MTA traffic has recovered in each borough (Graph starts at first week in January 2020 and 100 = 2019 average).
Manhattan is at about 39% of normal.
This data is through Friday, June 17th.
He notes: "Data updates weekly from the MTA’s public turnstile data, usually on Saturday mornings".


