 RSS Feed
 by Calculated Risk on 5/17/2022 02:38:00 PM
Tuesday, May 17, 2022
LA Port Traffic: Imports Steady in April
Notes: The expansion to the Panama Canal was completed in 2016 (As I noted a few years ago), and some of the traffic that used the ports of Los Angeles and Long Beach is probably going through the canal. This might be impacting TEUs on the West Coast.
Container traffic gives us an idea about the volume of goods being exported and imported - and usually some hints about the trade report since LA area ports handle about 40% of the nation's container port traffic.
The following graphs are for inbound and outbound traffic at the ports of Los Angeles and Long Beach in TEUs (TEUs: 20-foot equivalent units or 20-foot-long cargo container).
To remove the strong seasonal component for inbound traffic, the first graph shows the rolling 12-month average.
 Click on graph for larger image.
On a rolling 12-month basis, inbound traffic was unchanged in April compared to the rolling 12 months ending in March. Outbound traffic was down 0.7% compared to the rolling 12 months ending the previous month.
The 2nd graph is the monthly data (with a strong seasonal pattern for imports).
 Usually imports peak in the July to October period as retailers import goods for the Christmas holiday, and then decline sharply and bottom in February or March depending on the timing of the Chinese New Year.
Imports were unchanged YoY in April, and exports were down 7% YoY.
This tied last year for record inbound traffic for the month of April. There is no impact - yet - on inbound traffic due to the shutdown in China.
NAHB: Builder Confidence Decreased to 69 in May, "Housing market is now slowing"
by Calculated Risk on 5/17/2022 10:14:00 AM
The National Association of Home Builders (NAHB) reported the housing market index (HMI) was at 69, down from 77 in April. Any number above 50 indicates that more builders view sales conditions as good than poor.
From the NAHB: Builder Confidence Plunges on Rising Interest Rates, Growing Affordability Woes
In a sign that the housing market is now slowing, builder confidence took a steep drop in May as growing affordability challenges in the form of rapidly rising interest rates, double-digit price increases for material costs and ongoing home price appreciation are taking a toll on buyer demand.
Builder confidence in the market for newly built single-family homes fell eight points to 69 in May, according to the National Association of Home Builders (NAHB)/Wells Fargo Housing Market Index (HMI). This is the fifth straight month that builder sentiment has declined and the lowest reading since June 2020.
Housing is the business cycle, and the sector is particularly sensitive to changes for interest rates. And the housing market is facing growing challenges. Building material costs are up 19% from a year ago, in less than three months mortgage rates have surged to a 12-year high and based on current affordability conditions, less than 50% of new and existing home sales are affordable for a typical family. Entry-level and first-time home buyers are especially bearing the brunt of this rapid rise in mortgage rates.
...
All three HMI indices posted major losses in May. The HMI index gauging current sales conditions fell eight points to 78, the gauge measuring sales expectations in the next six months dropped 10 points to 63 and the component charting traffic of prospective buyers posted a nine-point decline to 52.
Looking at the three-month moving averages for regional HMI scores, the Northeast held steady at 72 while the Midwest dropped seven points to 62, the South fell two points to 80 and the West posted a six-point decline to 83.
emphasis added
 Click on graph for larger image.
This graph shows the NAHB index since Jan 1985.
This was well below the consensus forecast, but still historically a decent reading.
Industrial Production Increased 1.1 Percent in April
by Calculated Risk on 5/17/2022 09:20:00 AM
From the Fed: Industrial Production and Capacity Utilization
In April, total industrial production increased 1.1 percent—the fourth consecutive month of gains of 0.8 percent or greater—and manufacturing output rose 0.8 percent. The index for utilities moved up 2.4 percent, and the index for mining advanced 1.6 percent. At 105.6 percent of its 2017 average, total industrial production in April was 6.4 percent above its year-earlier level. Capacity utilization climbed to 79.0 percent, a rate that is 0.5 percentage point below its long-run (1972–2021) average.
emphasis added
 Click on graph for larger image.
This graph shows Capacity Utilization. This series is up from the record low set in April 2020, and above the level in February 2020 (pre-pandemic).
Capacity utilization at 79.0% is 0.5% below the average from 1972 to 2020. This was well above consensus expectations.
Note: y-axis doesn't start at zero to better show the change.
 The second graph shows industrial production since 1967.
Industrial production increased in April to 105.6. This is above the February 2020 level.
The change in industrial production was well above consensus expectations.
Retail Sales Increased 0.9% in April
by Calculated Risk on 5/17/2022 08:39:00 AM
On a monthly basis, retail sales were increased 0.9% from March to April (seasonally adjusted), and sales were up 8.2 percent from April 2021.
From the Census Bureau report:
Advance estimates of U.S. retail and food services sales for April 2022, adjusted for seasonal variation and holiday and trading-day differences, but not for price changes, were $677.7 billion, an increase of 0.9 percent from the previous month, and 8.2 percent above April 2021. ...The February 2022 to March 2022 percent change was revised from up 0.7 percent to up 1.4 percent.
emphasis added
 Click on graph for larger image.
This graph shows retail sales since 1992. This is monthly retail sales and food service, seasonally adjusted (total and ex-gasoline).
Retail sales ex-gasoline were up 1.3% in April.
The second graph shows the year-over-year change in retail sales and food service (ex-gasoline) since 1993.
Retail and Food service sales, ex-gasoline, increased by 5.9% on a YoY basis.
 Sales growth in April were above expectations, and sales in February and March were revised up, combined.
Monday, May 16, 2022
Tuesday: Retail Sales, Industrial Production, Homebuilder Survey, Fed Chair Powell
by Calculated Risk on 5/16/2022 09:05:00 PM
From Matthew Graham at Mortgage News Daily: Mortgage Rates Unchanged to Slightly Lower
Mortgage rates are coming off of one of their best weeks in nearly 2 years, which isn't quite as glamorous as it sounds, but still a good accomplishment (read more about it in last week's recap HERE). Rates managed to maintain those levels as the new week began. Some lenders were microscopically better, but not enough to have a noticeable impact on most quotes. [30 year fixed 5.37%]Tuesday:
emphasis added
• At 8:30 AM ET, Retail sales for April is scheduled to be released. The consensus is for 0.8% increase in retail sales.
• At 9:15 AM, The Fed will release Industrial Production and Capacity Utilization for April. The consensus is for a 0.4% increase in Industrial Production, and for Capacity Utilization to increase to 78.5%.
• At 10:00 AM, The May NAHB homebuilder survey. The consensus is for a reading of 75 down from 77 last month. Any number above 50 indicates that more builders view sales conditions as good than poor.
• At 2:00 PM, Discussion, Fed Chair Jerome H. Powell, Conversation with Nick Timiraos, At the Wall Street Journal Future of Everything Festival, New York, New York
On COVID (focus on hospitalizations and deaths):
| COVID Metrics | ||||
|---|---|---|---|---|
| Now | Week Ago | Goal | ||
| Percent fully Vaccinated | 66.4% | --- | ≥70.0%1 | |
| Fully Vaccinated (millions) | 220.6 | --- | ≥2321 | |
| New Cases per Day3🚩 | 90,337 | 68,610 | ≤5,0002 | |
| Hospitalized3🚩 | 14,524 | 13,683 | ≤3,0002 | |
| Deaths per Day3 | 263 | 308 | ≤502 | |
| 1 Minimum to achieve "herd immunity" (estimated between 70% and 85%). 2my goals to stop daily posts, 37-day average for Cases, Currently Hospitalized, and Deaths 🚩 Increasing 7-day average week-over-week for Cases, Hospitalized, and Deaths ✅ Goal met. | ||||
 Click on graph for larger image.
This graph shows the daily (columns) and 7-day average (line) of deaths reported.
Average daily deaths bottomed in July 2021 at 214 per day.
A Slowdown in Showings
by Calculated Risk on 5/16/2022 04:54:00 PM
Today, in the Calculated Risk Real Estate Newsletter: A Slowdown in Showings
A brief excerpt:
The following data is courtesy of David Arbit, Director of Research at the Minneapolis Area REALTORS® and NorthstarMLS (posted with permission). Here is a link to their data.There is much more in the article. You can subscribe at https://calculatedrisk.substack.com/
The first graph shows the 7-day average showings for the Twin Cities area for 2019, 2020, 2021, and 2022.
There was a huge dip in showings in 2020 (black) at the start of the pandemic, and then showing were well above 2019 (blue) levels for the rest of the year. And showings in 2021 (gold) were very strong in the first half of the year, and then were closer to 2019 in the 2nd half.
Click on graph for larger image.
Note that there were dips in showings during holidays (July 4th, Memorial Day, Thanksgiving and Christmas), and also dips related to protests and curfews related to the deaths of George Floyd and Daunte Wright.
2022 (red) started off solid but is now below the previous three years.

MBA Survey: "Share of Mortgage Loans in Forbearance Decreases to 0.94% in April"
by Calculated Risk on 5/16/2022 04:39:00 PM
Note: This is as of April 30th.
From the MBA: Share of Mortgage Loans in Forbearance Decreases to 0.94% in April
The Mortgage Bankers Association’s (MBA) monthly Loan Monitoring Survey revealed that the total number of loans now in forbearance decreased by 11 basis points from 1.05% of servicers’ portfolio volume in the prior month to 0.94% as of April 30, 2022. According to MBA’s estimate, 470,000 homeowners are in forbearance plans.
The share of Fannie Mae and Freddie Mac loans in forbearance decreased 6 basis points to 0.43%. Ginnie Mae loans in forbearance decreased 9 basis points to 1.29%, and the forbearance share for portfolio loans and private-label securities (PLS) declined 29 basis points to 2.15%.
“With the number of borrowers in forbearance decreasing to less than half a million, the pace of monthly forbearance exits reached its lowest level since MBA started tracking exits in June 2020,” said Marina Walsh, CMB, MBA’s Vice President of Industry Analysis. “Servicers are expected to continue making small incremental inroads to the remaining loans in forbearance.”
In addition to improvement in the overall forbearance rate, the percentage of borrowers who were current on their mortgage payments increased to the highest level of 2022, despite potential headwinds such as high inflation and stock market volatility.
emphasis added
 Click on graph for larger image.
This graph shows the percent of portfolio in forbearance by investor type over time.
The share of forbearance plans is decreasing, and, at the end of April, there were about 470,000 homeowners in forbearance plans.
Lawler: Mortgage/Treasury Spreads Part II: “Decomposing” the Widening This Year
by Calculated Risk on 5/16/2022 12:51:00 PM
Today, in the Calculated Risk Real Estate Newsletter: Lawler: Mortgage/Treasury Spreads Part II: “Decomposing” the Widening This Year
A brief excerpt:
From housing economist Tom Lawler:There is much more in the article. You can subscribe at https://calculatedrisk.substack.com/
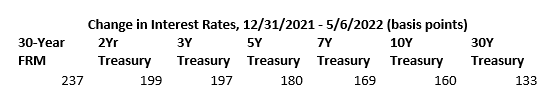
From the end of last year to May 6th of this year 30-year fixed mortgage rates increased by about 237 basis points, the largest increase over such a short period of time since the early 1980’s. Over that same period other interest rates went up sharply as well, including Treasury rates, but the increases in Treasury rates was significantly lower than the rise in mortgage rates.
Click on graph for larger image.
During this same period, Fannie Mae’s required net yield on purchases of 30-year fixed-rate mortgages for delivery in 30-days, which is set based on prices of mortgage-backed securities, also increased by 233 basis points. As such, almost all of the “widening” in the spread between mortgage rates and Treasury rates reflected a widening in MBS yields relative to Treasury yields.
So: why did MBS yields increase by much more than Treasury yields over this period?
Housing Inventory May 16th Update: Inventory UP 1.5% Year-over-Year
by Calculated Risk on 5/16/2022 09:32:00 AM
Altos reports inventory is up year-over-year!
Inventory usually declines in the winter, and then increases in the spring. Inventory bottomed seasonally at the beginning of March 2022 and is now up 32% since then.
 Click on graph for larger image in graph gallery.
This inventory graph is courtesy of Altos Research.
As of May 13th, inventory was at 318 thousand (7-day average), compared to 305 thousand the prior week. Inventory was up 4.2% from the previous week.
Inventory is still very low. Compared to the same week in 2021, inventory is up 1.5% from 314 thousand, however compared to the same week in 2020, and inventory is down 56.4% from 729 thousand. Compared to 3 years ago, inventory is down 65.2% from 915 thousand.
Inventory is still very low. Compared to the same week in 2021, inventory is up 1.5% from 314 thousand, however compared to the same week in 2020, and inventory is down 56.4% from 729 thousand. Compared to 3 years ago, inventory is down 65.2% from 915 thousand.
Here are the inventory milestones I’m watching for with the Altos data:
1. The seasonal bottom (happened on March 4th for Altos) ✅
2. Inventory up year-over-year (happened on May 13th for Altos) ✅
3. Inventory up compared to two years ago (currently down 56% according to Altos)
4. Inventory up compared to 2019 (currently down 65%).
1. The seasonal bottom (happened on March 4th for Altos) ✅
2. Inventory up year-over-year (happened on May 13th for Altos) ✅
3. Inventory up compared to two years ago (currently down 56% according to Altos)
4. Inventory up compared to 2019 (currently down 65%).

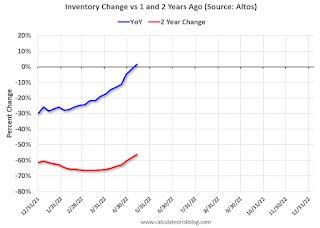
Here is a graph of the inventory change year-over-year and vs two years ago (milestone 3 above).
The blue line is the year-over-year data, and the red line is compared to two years ago.
Inventory is now up year-over-year. Two years ago (in 2020) inventory was declining all year, so the two-year comparison will get easier all year.
Mike Simonsen discusses this data regularly on Youtube.
Four High Frequency Indicators for the Economy
by Calculated Risk on 5/16/2022 08:15:00 AM
These indicators are mostly for travel and entertainment. It is interesting to watch these sectors recover as the pandemic subsides. Note: Apple has discontinued "Apple mobility", and restaurant traffic is mostly back to normal.
The TSA is providing daily travel numbers.
This data is as of May 15th.
 Click on graph for larger image.
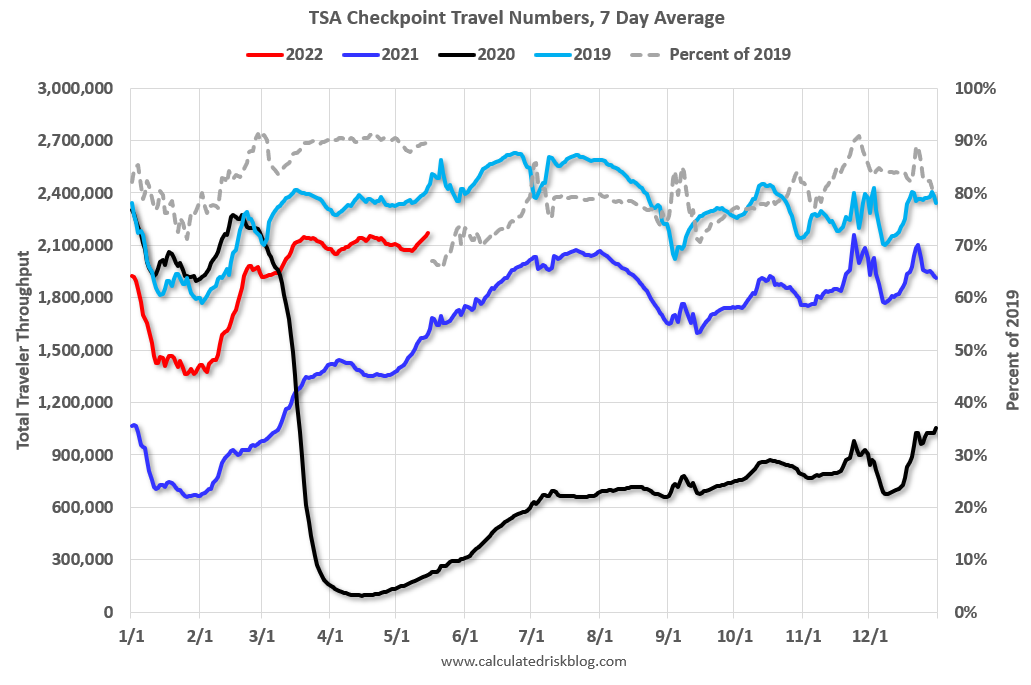
This data shows the 7-day average of daily total traveler throughput from the TSA for 2019 (Light Blue), 2020 (Black), 2021 (Blue) and 2022 (Red).
The dashed line is the percent of 2019 for the seven-day average.
The 7-day average is down 10.7% from the same day in 2019 89.3% of 2019). (Dashed line)
Air travel has been moving sideways over the last two months, off about 10% from 2019.
 This data shows domestic box office for each week and the median for the years 2016 through 2019 (dashed light blue).
 Black is 2020, Blue is 2021 and Red is 2022.
The data is from BoxOfficeMojo through May 12th.
Note that the data is usually noisy week-to-week and depends on when blockbusters are released.
Movie ticket sales were at $277 million last week, up about 17% from the median for the week due to strong sales for Dr Strange.
Note that the data is usually noisy week-to-week and depends on when blockbusters are released.
Movie ticket sales were at $277 million last week, up about 17% from the median for the week due to strong sales for Dr Strange.
 This graph shows the seasonal pattern for the hotel occupancy rate using the four-week average.
 The red line is for 2022, black is 2020, blue is the median, and dashed light blue is for 2021. Dashed purple is 2019 (STR is comparing to a strong year for hotels).
This data is through May 7th. The occupancy rate was down 6.1% compared to the same week in 2019.
The 4-week average of the occupancy rate is at the median rate for the previous 20 years (Blue).
Notes: Y-axis doesn't start at zero to better show the seasonal change.
Notes: Y-axis doesn't start at zero to better show the seasonal change.
The 4-week average of the occupancy rate will now mostly move sideways seasonally until the summer.
Here is some interesting data on New York subway usage (HT BR).
 This graph is from Todd W Schneider.
 This graph shows how much MTA traffic has recovered in each borough (Graph starts at first week in January 2020 and 100 = 2019 average).
Manhattan is at about 39% of normal.
This data is through Friday, May 13th.
He notes: "Data updates weekly from the MTA’s public turnstile data, usually on Saturday mornings".


