 RSS Feed
 by Calculated Risk on 5/01/2022 02:21:00 PM
Sunday, May 01, 2022
Housing: "What Killed the Home ATM in 2006?"
Today, in the Calculated Risk Real Estate Newsletter: Housing: "What Killed the Home ATM in 2006?"
Excerpt:
A reader (ht SV) asked an interesting question: What killed the Home ATM in 2006?
First, the “Home ATM” is a joking reference to mortgage equity withdrawal (MEW), where homeowners extract equity from their homes - like a cash-out refinance or with a Home Equity Line of Credit (HELOC).
In this post, I’ll compare MEW for the current period to both the housing bubble and the 1978 to 1982 period. In Housing: Don't Compare the Current Housing Boom to the Bubble and Bust, I pointed out that demographics, lending standards, and the Fed fighting inflation are similar to the 1978 to 1982 period, and dissimilar to the housing bubble - and I suggested that we look to the 1980 for parallels to the current boom and coming housing slowdown (not the bubble).
...
The following graph shows the net equity extraction, or mortgage equity withdrawal (MEW), results, using the Flow of Funds (and BEA data) compared to the Kennedy-Greenspan method.
Note that MEW (as a percent of DPI) was at about the same level in 1980 as today and is well below the peak bubble years.
...
So, this is another reason - along with similar demographics, lending standards, and concerns about inflation - to compare the current housing market to the 1978 to 1982 period, and not to the housing bubble. (Of course, there are differences too).

There is much more in the article. You can subscribe at https://calculatedrisk.substack.com/
FOMC Preview: 50bp Rate Hike, Announce "commencement of balance sheet runoff"
by Calculated Risk on 5/01/2022 08:11:00 AM
Expectations are the FOMC will announce a 50bp rate increase in the federal funds rate at the meeting this week and probably also announce the "commencement of balance sheet runoff".
From Merrill Lynch:
1 Projections of change in real GDP and inflation are from the fourth quarter of the previous year to the fourth quarter of the year indicated.
The unemployment rate was at 3.6% in March. The question is: Will the slowdown in economic growth push up the unemployment rate? Or will the rate continue to decline?
2 Projections for the unemployment rate are for the average civilian unemployment rate in the fourth quarter of the year indicated.
As of March 2022, PCE inflation was up 6.6% from March 2021. This was a new cycle high. With the ongoing negative impacts on the supply chain, and on energy and food costs from the war, inflation might stay elevated longer than expected.
PCE core inflation was up 5.2% in March year-over-year. This was slightly below the February YoY increase, but it is too early to say the core inflation has peaked.
"The Fed has signaled a major hawkish shift at this meeting, and we expect them to deliver, with a 50bp rate increase and the announcement of Quantitative Tightening (QT) starting in June.From Goldman Sachs:
...
On QT, the minutes of the March FOMC meeting detailed the plans for reducing the size of the balance sheet, indicating general agreement behind monthly caps of $60bn for Treasuries and $35bn for agency MBS phased in over three months or more. These finalized details clear the way for QT to be announced at this meeting, with starting monthly caps of $20bn for Treasuries and $10bn for agency MBS. Importantly, our US rates strategy team believes QT implementation will actually begin with a lag in June."
"Policy actions at the May FOMC meeting seem set after Chair Powell and other FOMC members strongly suggested that they intend to raise the policy rate by 50bp and announce the start of balance sheet reduction.
The key question is therefore what comes next. We forecast another 50bp hike in June followed by a deceleration to a 25bp/meeting pace of tightening for the rest of 2022, but see reasonably high chances that the FOMC will continue to hike in 50bp increments until reaching their median neutral rate estimate of 2.25-2.5%. We will therefore be paying close attention to any comments from Chair Powell at the press conference that suggest the FOMC intends to hike in 50bp increments beyond June."
Analysts will be looking for comments on the size of future rate hikes, the pace of the runoff of assets (not reinvesting), and comments on selling MBS in the future.
Note: No projections will be released at this meeting. However, for review, here are the March projections. In March, most participants expected seven rate hikes in 2022.
Wall Street forecasts are being revised down for 2022 due to the ongoing negative supply chain impacts from the pandemic (see China), and the war in Ukraine. For example, Goldman Sachs is now forecasting a 1.6% increase in real GDP, Q4-over-Q4 for 2022, well below the FOMC projections in March.
Wall Street forecasts are being revised down for 2022 due to the ongoing negative supply chain impacts from the pandemic (see China), and the war in Ukraine. For example, Goldman Sachs is now forecasting a 1.6% increase in real GDP, Q4-over-Q4 for 2022, well below the FOMC projections in March.
| GDP projections of Federal Reserve Governors and Reserve Bank presidents, Change in Real GDP1 | ||||
|---|---|---|---|---|
| Projection Date | 2022 | 2023 | 2024 | |
| Mar 2022 | 2.5 to 3.0 | 2.1 to 2.5 | 1.8 to 2.0 | |
| Dec 2021 | 3.6 to 4.5 | 2.0 to 2.5 | 1.8 to 2.0 | |
The unemployment rate was at 3.6% in March. The question is: Will the slowdown in economic growth push up the unemployment rate? Or will the rate continue to decline?
| Unemployment projections of Federal Reserve Governors and Reserve Bank presidents, Unemployment Rate2 | ||||
|---|---|---|---|---|
| Projection Date | 2022 | 2023 | 2024 | |
| Mar 2022 | 3.4 to 3.6 | 3.3 to 3.6 | 3.2 to 3.7 | |
| Dec 2021 | 3.4 to 3.7 | 3.2 to 3.6 | 3.2 to 3.7 | |
As of March 2022, PCE inflation was up 6.6% from March 2021. This was a new cycle high. With the ongoing negative impacts on the supply chain, and on energy and food costs from the war, inflation might stay elevated longer than expected.
| Inflation projections of Federal Reserve Governors and Reserve Bank presidents, PCE Inflation1 | ||||
|---|---|---|---|---|
| Projection Date | 2022 | 2023 | 2024 | |
| Mar 2022 | 4.1 to 4.7 | 2.3 to 3.0 | 2.1 to 2.4 | |
| Dec 2021 | 2.2 to 3.0 | 2.1 to 2.5 | 2.0 to 2.2 | |
PCE core inflation was up 5.2% in March year-over-year. This was slightly below the February YoY increase, but it is too early to say the core inflation has peaked.
| Core Inflation projections of Federal Reserve Governors and Reserve Bank presidents, Core Inflation1 | ||||
|---|---|---|---|---|
| Projection Date | 2022 | 2023 | 2024 | |
| Mar 2022 | 3.9 to 4.4 | 2.4 to 3.0 | 2.1 to 2.4 | |
| Dec 2021 | 2.5 to 3.0 | 2.1 to 2.4 | 2.0 to 2.2 | |
Saturday, April 30, 2022
Real Estate Newsletter Articles this Week
by Calculated Risk on 4/30/2022 02:11:00 PM
At the Calculated Risk Real Estate Newsletter this week:
• Realtor.com Reports Weekly Inventory down only 6% Year-over-year
• Real House Prices, Price-to-Rent Ratio and Price-to-Median Income in February Worst "Affordability" since Housing Bubble
• March New Home Sales: Little Completed Inventory, High Number of Homes Under Construction
• Case-Shiller National Index up 19.8% Year-over-year in February; New Record Monthly Increase
• Housing and Demographics
This is usually published 4 to 6 times a week and provides more in-depth analysis of the housing market.
The blog will continue as always!
You can subscribe at https://calculatedrisk.substack.com/
Most content is available for free (and no Ads), but please subscribe!
Schedule for Week of May 1, 2022
by Calculated Risk on 4/30/2022 08:11:00 AM
The key report scheduled for this week is the April employment report.
Other key reports include April vehicle sales, and the March trade balance.
The FOMC meets this week, and the FOMC is expected to raise rates 50bp.
For manufacturing, the April ISM manufacturing index will be released.
10:00 AM ET: ISM Manufacturing Index for April. The consensus is for the ISM to be at 57.6, up from 57.1 in March.
10:00 AM: Construction Spending for March. The consensus is for a 0.7% increase in construction spending.
8:00 AM ET: Corelogic House Price index for March.
 10:00 AM ET: Job Openings and Labor Turnover Survey for March from the BLS.
 This graph shows job openings (yellow line), hires (purple), Layoff, Discharges and other (red column), and Quits (light blue column) from the JOLTS.
Jobs openings decreased slightly in February to 11.266 million from 11.283 million in January. The number of job openings (yellow) were up 43% year-over-year.
 All day: Light vehicle sales for April. The expectation is for light vehicle sales to be 13.8 million SAAR in April, up from 13.36 million in March (Seasonally Adjusted Annual Rate).
This graph shows light vehicle sales since the BEA started keeping data in 1967. The dashed line is the sales rate for the previous month.
7:00 AM ET: The Mortgage Bankers Association (MBA) will release the results for the mortgage purchase applications index.
8:15 AM: The ADP Employment Report for April. This report is for private payrolls only (no government). The consensus is for 395,000 payroll jobs added in April, down from 455,000 added in March.
 8:30 AM: Trade Balance report for March from the Census Bureau.
 This graph shows the U.S. trade deficit, with and without petroleum, through the most recent report. The blue line is the total deficit, and the black line is the petroleum deficit, and the red line is the trade deficit ex-petroleum products.
The consensus is the trade deficit to be $107.0 billion. The U.S. trade deficit was at $89.2 Billion in February.
10:00 AM: the ISM Services Index for April. The consensus is for a reading of 58.5, up from 58.3.
2:00 PM: FOMC Meeting Announcement. The FOMC is expected to raise the Fed Funds rate by 50bp at this meeting and announce "commencement of balance sheet runoff".
2:30 PM: Fed Chair Jerome Powell holds a press briefing following the FOMC announcement.
8:30 AM: The initial weekly unemployment claims report will be released. The consensus is for 180 thousand unchanged from 180 thousand last week.
 8:30 AM: Employment Report for April. The consensus is for 400,000 jobs added, and for the unemployment rate to be unchanged at 3.6%.
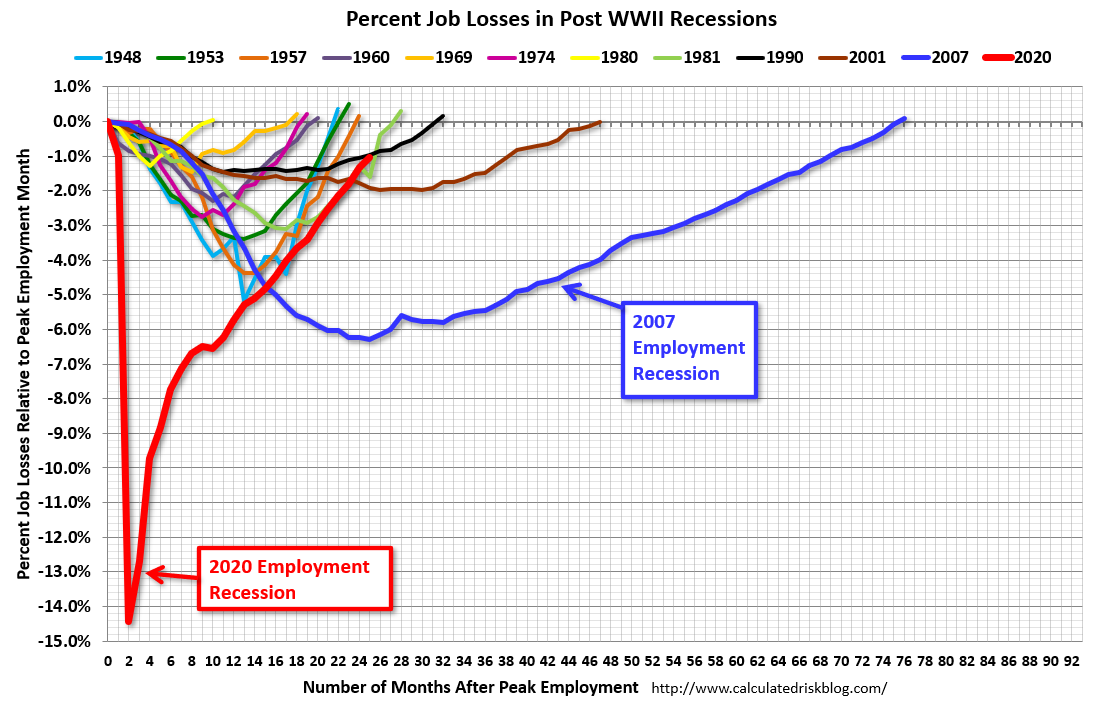
There were 431,000 jobs added in February, and the unemployment rate was at 3.6%.
This graph shows the job losses from the start of the employment recession, in percentage terms.
The current employment recession was by far the worst recession since WWII in percentage terms. However, the current employment recession, 25 months after the onset, has recovered quicker than the previous two recessions.
Friday, April 29, 2022
COVID Update: Hospitalizations and New Cases Increasing
by Calculated Risk on 4/29/2022 10:17:00 PM
On COVID (focus on hospitalizations and deaths):
| COVID Metrics | ||||
|---|---|---|---|---|
| Now | Week Ago | Goal | ||
| Percent fully Vaccinated | 66.1% | --- | ≥70.0%1 | |
| Fully Vaccinated (millions) | 219.6 | --- | ≥2321 | |
| New Cases per Day3🚩 | 54,696 | 40,713 | ≤5,0002 | |
| Hospitalized3🚩 | 10,991 | 9,997 | ≤3,0002 | |
| Deaths per Day3 | 311 | 340 | ≤502 | |
| 1 Minimum to achieve "herd immunity" (estimated between 70% and 85%). 2my goals to stop daily posts, 37-day average for Cases, Currently Hospitalized, and Deaths 🚩 Increasing 7-day average week-over-week for Cases, Hospitalized, and Deaths ✅ Goal met. | ||||
 Click on graph for larger image.
This graph shows the daily (columns) and 7-day average (line) of deaths reported.
Average daily deaths bottomed in July 2021 at 214 per day.
Fannie Mae: Mortgage Serious Delinquency Rate Decreased in March
by Calculated Risk on 4/29/2022 04:09:00 PM
Fannie Mae reported that the Single-Family Serious Delinquency decreased to 1.01% in March from 1.11% in February. The serious delinquency rate is down from 2.58% in March 2021.
These are mortgage loans that are "three monthly payments or more past due or in foreclosure".
The Fannie Mae serious delinquency rate peaked in February 2010 at 5.59% following the housing bubble and peaked at 3.32% in August 2020 during the pandemic.
 Click on graph for larger image
By vintage, for loans made in 2004 or earlier (1% of portfolio), 3.12% are seriously delinquent (down from 3.30% in February).
For loans made in 2005 through 2008 (2% of portfolio), 5.14% are seriously delinquent (down from 5.46%),
For recent loans, originated in 2009 through 2021 (97% of portfolio), 0.81% are seriously delinquent (down from 0.89%). So, Fannie is still working through a few poor performing loans from the bubble years.
Mortgages in forbearance are counted as delinquent in this monthly report, but they will not be reported to the credit bureaus.
The pandemic related increase in delinquencies was very different from the increase in delinquencies following the housing bubble. Lending standards had been fairly solid over the previous decade, and most of these homeowners had equity in their homes - and the vast majority of these homeowners have been able to restructure their loans once they were employed.
Freddie Mac reported earlier.
Hotels: Occupancy Rate Down 4.2% Compared to Same Week in 2019
by Calculated Risk on 4/29/2022 02:32:00 PM
U.S. hotel performance increased from the previous week, according to STR‘s latest data through April 23.The following graph shows the seasonal pattern for the hotel occupancy rate using the four-week average.
April 17-23, 2022 (percentage change from comparable week in 2019*):
• Occupancy: 65.8% (-4.2%)
• Average daily rate (ADR): $148.35 (+15.4%)
• Revenue per available room (RevPAR): $97.66 (+10.5%)
*Due to the pandemic impact, STR is measuring recovery against comparable time periods from 2019.
emphasis added
 Click on graph for larger image.
The red line is for 2022, black is 2020, blue is the median, and dashed light blue is for 2021. Dashed purple is 2019 (STR is comparing to a strong year for hotels).
The 4-week average of the occupancy rate is at the median rate for the previous 20 years (Blue).
Note: Y-axis doesn't start at zero to better show the seasonal change.
The 4-week average of the occupancy rate will now mostly move sideways seasonally until the summer.
Realtor.com Reports Weekly Inventory down only 6% Year-over-year
by Calculated Risk on 4/29/2022 11:46:00 AM
Today, in the Calculated Risk Real Estate Newsletter: Realtor.com Reports Weekly Inventory down only 6% Year-over-year
Excerpt:
Realtor.com has monthly and weekly data on the existing homes. Here is their most recent weekly report released yesterday: Weekly Housing Trends View — Data Week Ending April 23, 2022. They have data on list prices, new listing and more, but this focus is on inventory.• Active inventory is down just 6 percent from a year ago.
The number of homes for sale is past this year’s seasonal low, which was also a record low, which means the number of homes for sale is climbing week to week and month to month as it typically does in spring. While the market has not yet caught up to last year’s level, this week marked a big jump forward. The gap between this year’s homes for sale and last year’s is one-fifth the size that it was at the beginning of the year. The catch up is likely to continue, as we noted last week, as new listings grow and home sales slow, and we expect active inventory to surpass year ago levels in the next few months. This growth will mean more options for shoppers than they’ve had in a while, even though inventory continues to lag pre-pandemic normal.Here is a graph of the year-over-year change in inventory according to realtor.com. Note: I corrected a sign error in the data for Feb 26, 2022.
The previous week, inventory was down 12.6% YoY according to Realtor.com. That is close to the 11.2% that Altos reported. I expect Altos to report a single digit year-over-year decline in inventory on Monday.

There is much more in the article. You can subscribe at https://calculatedrisk.substack.com/
Personal Income increased 0.5% in March; Spending increased 1.1%
by Calculated Risk on 4/29/2022 08:38:00 AM
The BEA released the Personal Income and Outlays report for March:
Personal income increased $107.2 billion (0.5 percent) in March, according to estimates released today by the Bureau of Economic Analysis. Disposable personal income (DPI) increased $89.7 billion (0.5 percent) and personal consumption expenditures (PCE) increased $185.0 billion (1.1 percent).The March PCE price index increased 6.6 percent year-over-year and the PCE price index, excluding food and energy, increased 5.2 percent year-over-year.
Real DPI decreased 0.4 percent in March and Real PCE increased 0.2 percent; goods decreased 0.5 percent and services increased 0.6 percent. The PCE price index increased 0.9 percent. Excluding food and energy, the PCE price index increased 0.3 percent
emphasis added
The following graph shows real Personal Consumption Expenditures (PCE) through March 2022 (2012 dollars). Note that the y-axis doesn't start at zero to better show the change.
 Click on graph for larger image.
The dashed red lines are the quarterly levels for real PCE.
Personal income was slightly above expectations, and the increase in PCE was above expectations.
Thursday, April 28, 2022
Friday: Personal Income and Outlays, Chicago PMI
by Calculated Risk on 4/28/2022 09:15:00 PM
Friday:
• At 8:30 AM ET: Personal Income and Outlays, March 2021. The consensus is for a 0.4% increase in personal income, and for a 0.6% increase in personal spending. And for the Core PCE price index to increase 0.3%. PCE prices are expected to be up 6.4% YoY, and core PCE prices up 5.3% YoY.
• At 9:45 AM, Chicago Purchasing Managers Index for April. The consensus is for a reading of 62.0, down from 62.9 in March.
• At 10:00 AM, University of Michigan's Consumer sentiment index (Final for April). The consensus is for a reading of 65.7.
On COVID (focus on hospitalizations and deaths):
| COVID Metrics | ||||
|---|---|---|---|---|
| Now | Week Ago | Goal | ||
| Percent fully Vaccinated | 66.1% | --- | ≥70.0%1 | |
| Fully Vaccinated (millions) | 219.6 | --- | ≥2321 | |
| New Cases per Day3🚩 | 53,133 | 42,426 | ≤5,0002 | |
| Hospitalized3🚩 | 10,803 | 9,909 | ≤3,0002 | |
| Deaths per Day3 | 334 | 352 | ≤502 | |
| 1 Minimum to achieve "herd immunity" (estimated between 70% and 85%). 2my goals to stop daily posts, 37-day average for Cases, Currently Hospitalized, and Deaths 🚩 Increasing 7-day average week-over-week for Cases, Hospitalized, and Deaths ✅ Goal met. | ||||
 Click on graph for larger image.
This graph shows the daily (columns) and 7-day average (line) of deaths reported.
Average daily deaths bottomed in July 2021 at 214 per day.


